A Stock Market On Edge – Above the 40 (June 26, 2020)

Stock Market Statistics AT40 = 40.1% of stocks are trading above their respective 40-day moving averages (DMAs) (2-month low)AT200 = 20.1% of stocks are trading above their respective 200DMAs VIX = 34.7Short-term Trading Call: neutral Stock Market Commentary After a one-day respite, the damage in the stock market continued. This time, the damage was more … Read more

A Trampling at the Frontlines of the Stock Market – Above the 40 (June 24, 2020)

Stock Market Statistics AT40 = 47.9% of stocks are trading above their respective 40-day moving averages (DMAs) (2-month low)AT200 = 21.5% of stocks are trading above their respective 200DMAs VIX = 33.8Short-term Trading Call: neutral Stock Market Commentary The damage in the stock market is only visible upon close examination. The top technicals for the … Read more

Stock Market Risk and Reward from Rising VIX and End of Overbought Period

AT40 (T2108) closed at 68.7% and once again dropped out of overbought trading conditions.

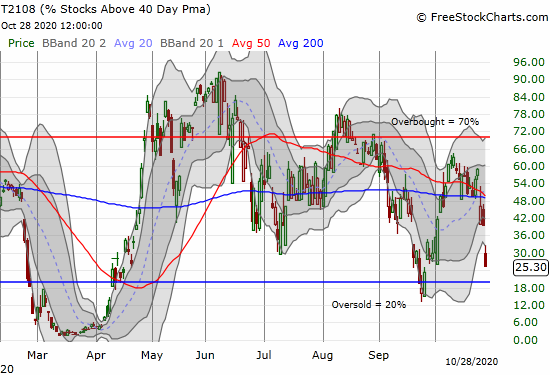
The financial markets have presented numerous extremes during the coronavirus pandemic. I rely on the percentage of stocks trading above their respective 40-day moving averages (DMAs), aka AT40 (T2108), as a measure of oversold (below 20%) and overbought (above 70%) extremes in the stock market. In just three months, the stock market went from printing … Read more

Support for Another Round of Overbought Conditions in the Stock Market – Above the 40 (June 13, 2020)

Stock Market Statistics AT40 = 74.1% of stocks are trading above their respective 40-day moving averages (DMAs) (first overbought day, 17 of last 19 trading days overbought)AT200 = 22.6% of stocks are trading above their respective 200DMAs VIX = 36.1 (down 11.5%)Short-term Trading Call: cautiously bullish Stock Market Commentary In the last Above the 40 … Read more

Warning Signs, Promising Signs in the Stock Market – Above the 40 (June 11, 2020)

Stock Market Statistics AT40 = 69.2% of stocks are trading above their respective 40-day moving averages (DMAs) (ending 16 days overbought)AT200 = 20.5% of stocks are trading above their respective 200DMAs VIX = 40.8 (up 48.0%)Short-term Trading Call: cautiously bullish Stock Market Commentary It was fun while it lasted. The Federal Reserve delivered its latest … Read more

How to Protect Gains After Surviving A Stock Market Sell-Off

The stock market crash in March was stomach-churning and generated a lot of panic. At its lowest point, the S&P 500 (SPY) was down 33.9% from its all-time high set just the previous month. The rebound from that stock market sell-off has been heroic with a 32.1% gain taking the index within another 14.6% rally … Read more

Overbought Trading Conditions Come to A Swift and Ominous End – Above the 40 (May 1, 2020)

Stock Market Statistics AT40 = 68.6% of stocks are trading above their respective 40-day moving averages (DMAs) (ending 2 days overbought)AT200 = 12.2% of stocks are trading above their respective 200DMAsVIX = 37.2Short-term Trading Call: neutral Stock Market Commentary The Federal Reserve’s last statement on monetary policy may go down as the short-term peak in … Read more

Stock Market’s New Bear/Bull Battle Lines – Above the 40 (April 22, 2020)

AT40 = 33.8% of stocks are trading above their respective 40-day moving averages (DMAs) AT200 = 11.3% of stocks are trading above their respective 200DMAsVIX = 42.0Short-term Trading Call: cautiously bullish Stock Market Commentary Crash culture started this week with an astonishing collapse in oil prices. The stock market held on admirably, especially tech stocks. … Read more

Tech Leaves Behind A Stock Market Back in Oversold Conditions – Above the 40 (April 13, 2020)

AT40 = 19.7% of stocks are trading above their respective 40-day moving averages (DMAs) (oversold day #1)AT200 = 9.2% of stocks are trading above their respective 200DMAsVIX = 41.2Short-term Trading Call: cautiously bullish Stock Market Commentary It lasted just a day. The market’s historic oversold period lasted 31 days and ended with a flurry. This … Read more

Culture of Collapse: Air Travel’s Disappearance In One Chart

Since companies began restricting business travel over precautions with the coronavirus pandemic, the Transportation Security Administration (TSA) provided data on screenings at U.S. airports. These data say a lot about the disappearance of air travel in the U.S. Almost every screening represents a passenger on a flight. The TSA provides a year-over-year comparison, normalized to … Read more