
Stock Market Statistics
- AT40 = 26.5% of stocks are trading above their respective 40-day moving averages (DMAs)
- AT200 = 44.5% of stocks are trading above their respective 200DMAs (8-month high)
- VIX = 38.0
- Short-term Trading Call: cautiously bullish
Stock Market Commentary
A little over a week ago, the stock market looked poised to launch higher contrary to the growing risks and angst associated with a worsening coronavirus pandemic and a contentious U.S. Presidential election. Abruptly, important supports at 50-day moving averages (DMAs) gave way and flipped the tenor of the stock market. A gathering storm of confirmed 50DMA breakdowns rapidly expanded across indices and individual stocks. The selling took the stock market as a whole close to oversold trading conditions. Now, the risks facing the stock market are salient and palpable even as the stock market somehow avoided triggering oversold conditions.
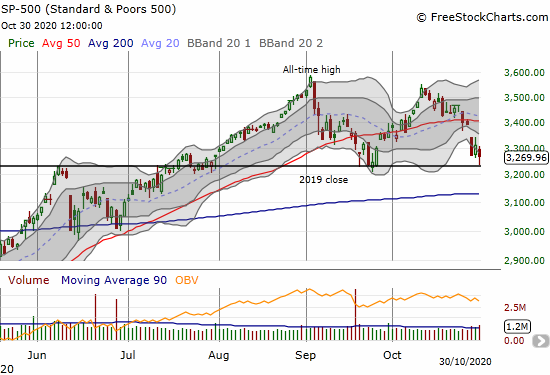
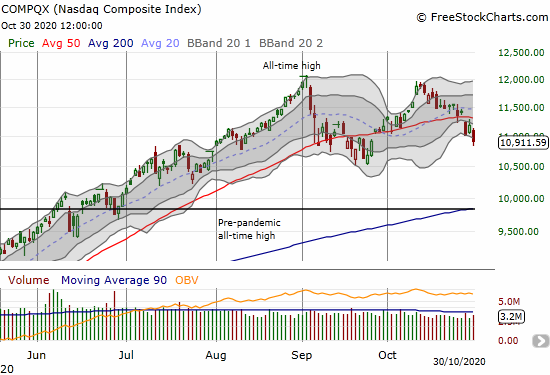
The Stock Market Indices
The S&P 500 (SPY) started the week with a 50DMA breakdown, marginally confirmed that breakdown the next day, and announced the confirmation with a gap down and 3.5% loss the next day. On Friday, buyers stepped in to defend support at the 2019 close in picture-perfect form. Note how this support held in September as well. How many times can this support sustain hits by sellers?
The NASDAQ (COMPQX) sunk 2.5% on Friday in the wake of broad selling in tech names, including a swath of big cap tech names which reported earnings the evening before. The loss confirmed Wednesday’s 50DMA breakdown and locked in the theme of the week of confirmed 50DMA breakdowns.
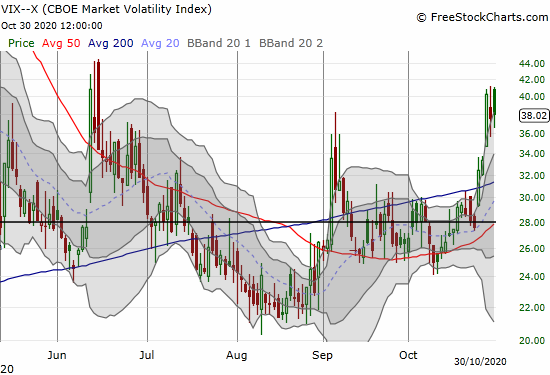
Stock Market Volatility
The volatility index (VIX) somehow faded off its intraday high despite the broadened selling in the stock market. The VIX finished Friday with a very small gain. The highs of the week held as resistance and just short of June’s high. The lack of on-going follow-through is a small positive in the trading action.
The Short-Term Trading Call
AT40 (T2108), the percentage of stocks trading above their respective 40DMAs, dropped to 25.3% on Wednesday and closed at its low. Somehow, my favorite technical indicator did not go lower despite the major indices closing at their lows of the week and the month on Friday. Combined with the VIX failing to follow-through on Wednesday’s surge, the market has a glimmer of “close enough to oversold” bullishness. This shimmering is struggling to shine through the gathering storm clouds formed by the large horizon of confirmed 50DMA breakdowns.
I nibbled on some stocks on Friday with a focus on the big cap tech stocks that suffered post-earnings. If not for the upcoming elections, I would be poised to do more aggressive buying this week. However, as per my AT40 trading rules, I will trigger more aggressive buys if the stock market goes oversold with AT40 closing below 20%.
Stock Chart Reviews – Below the 50DMA
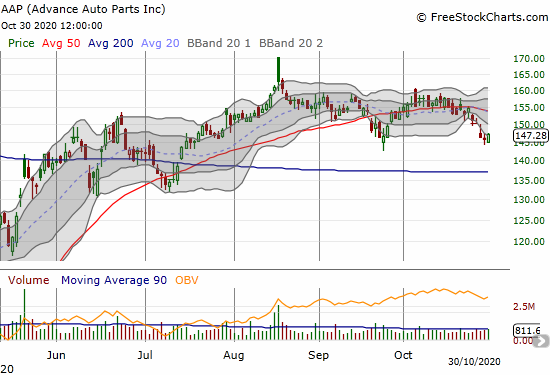
Advance Auto Parts Inc (AAP)
Advance Auto Parts Inc (AAP) peaked out with August earnings. AAP is now trying to hold support at the September low. The stock is slowly weakening with a second straight month suffering a 50DMA breakdown.
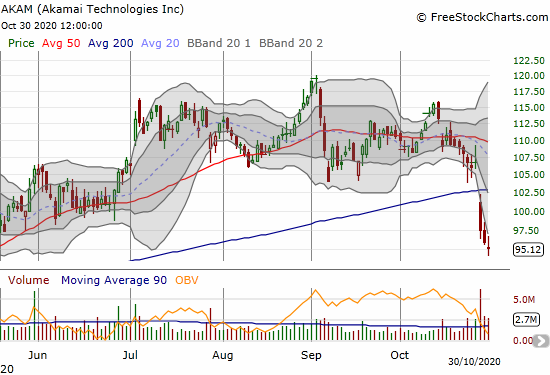
Akami Technologies (AKAM)
Earnings did not treat content data network (CDN) company Akami Technologies (AKAM) well. AKAM lost 8.7% on a 200DMA breakdown and sellers have not stopped since. AKAM is in a bearish position.
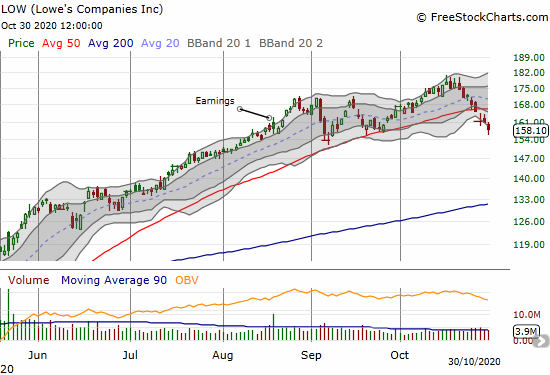
Lowe’s Companies Inc (LOW)
Lowe’s Companies Inc (LOW) is one of the most reliable plays in the housing market. However, last week LOW confirmed a 50DMA breakdown. Since the last all-time high, LOW has managed only three up days. LOW ended the week trying to hold one of the support levels from September. If those support points break, LOW will enter a definite bearish zone.
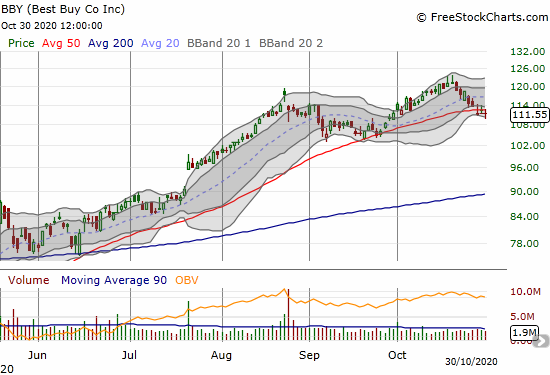
Best Buy (BBY)
Electronics retailer Best Buy (BBY) broke the plane on its 50DMA. However, BBY is clinging just below that important trend line. BBY becomes bearish on a confirmed 50DMA breakdown with a close below $110.
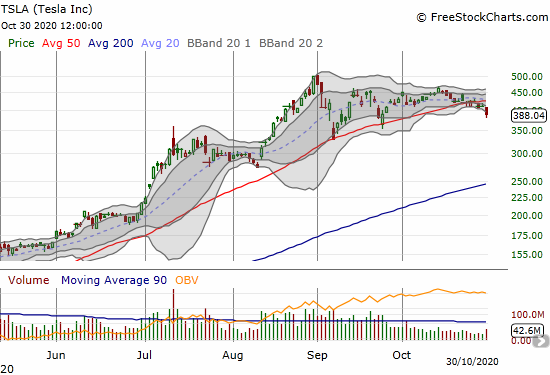
Tesla (TSLA)
Tesla (TSLA) is one of the more interesting confirmed 50DMA breakdowns I am tracking. The 50DMA supported TSLA’s amazing run-up since April. This important trendline was only tested twice since then, both times in September. TSLA is technically bearish until it technically closes above its 50DMA. To the downside, the biggest test comes at September’s lowest low. This move caught me in the middle of a calendar call spread. Note how TSLA ha stalled for two months under its all-time high.
iShares Dow Jones US Home Construction Index Fund ETF (ITB)
The iShares Dow Jones US Home Construction Index Fund ETF (ITB) continues to slide. ITB has just two up days since the all-time high in mid-October. Investors and traders continue to sell as though the historic housing data numbers have gotten as good as things can get for now.

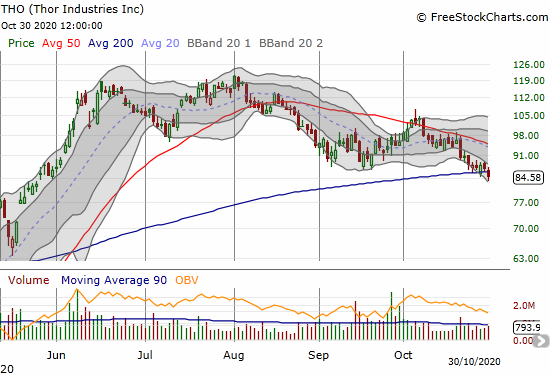
Thor Industries Inc. (THO)
The outdoor recreational trade continues to wane. RV maker Thor Industries (THO) confirmed 50DMA resistance with a bearish 200DMA breakdown. THO is on a 3-month downtrend.
Spotify (SPOT)
Spotify (SPOT) still looks topped out. Buyers stepped in to defend the 50DMA after a post-earnings breakdown, but sellers returned with a vengeance on Friday to take SPOT right to the September lows and a fresh 50DMA breakdown. The $300 level looks like firm resistance now.

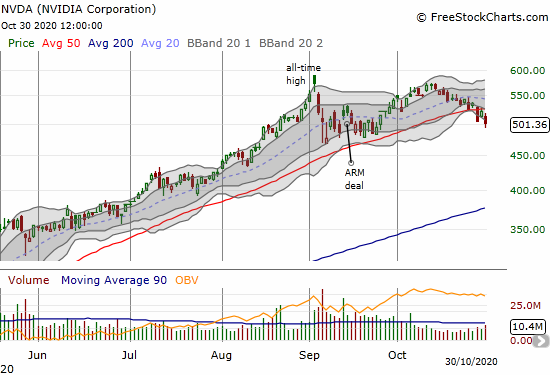
Nvidia Corporation (NVDA)
I thought Nvidia (NVDA) was breaking down in September. A subsequent rally stopped short of the all-time high. NVDA is now on a short-term downtrend with the week ending with a confirmed 50DMA breakdown.
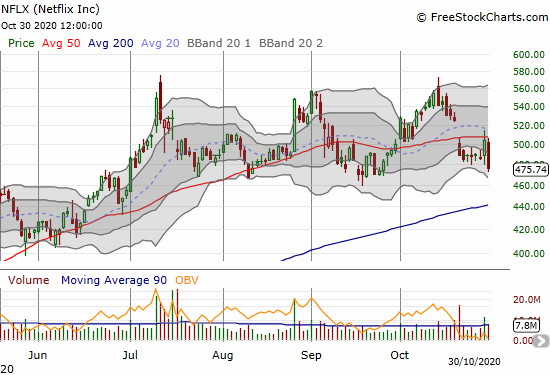
Netflix Inc (NFLX)
I am watching Netflix (NFLX) closely as it hit the bottom of its 4-month trading range. The latest weakness started with a post-earnings gap down and 50DMA breakdown. Excitement over an announced price hike lasted just one day as sellers took out NFLX the next day for a 5.6% loss. NFLX confirmed 50DMA ressitance.
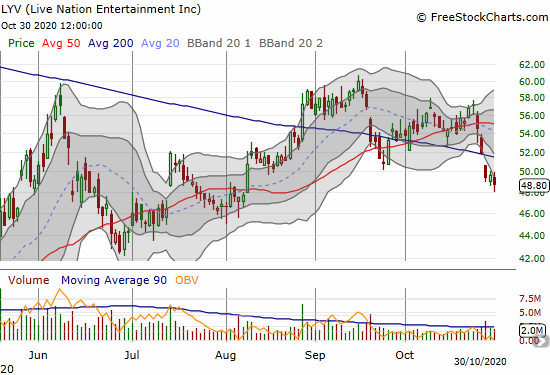
Live Nation Entertainment Inc (LYV)
With coronavirus cases raging across much of America, the near-term prospects for live entertainment and large gatherings look dimmer. Live Nation Entertainment (LYV) is in bearish territory with a confirmed 200DMA breakdown that started with a sharp gap down on Wednesday.
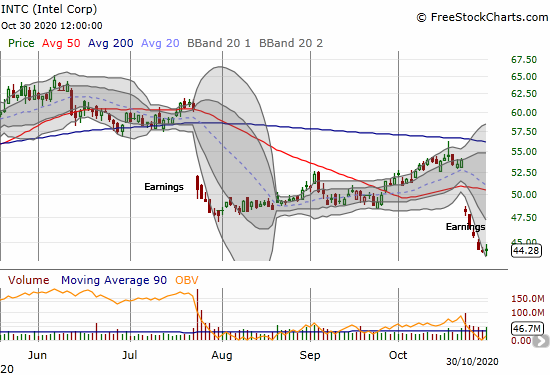
Intel Corp (INTC)
Intel (INTC) is in true bearish territory as sellers continue to pound away relentlessly. Friday’s gain was the first up day since the nasty post-earnings gap down. Still, INTC is now at a 17-month low. I will get interested in buying between-earnings call options on a close above $45.
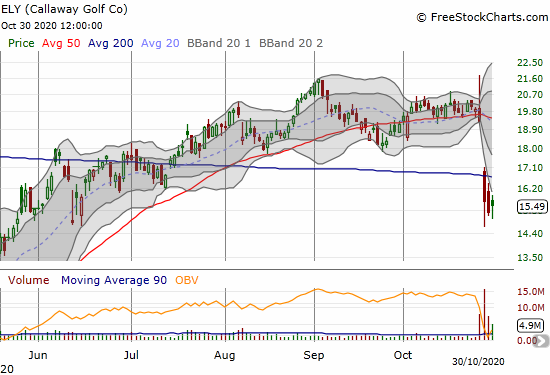
Callaway Golf Co (ELY)
Golf was one of the first sports to get back on track after the coronavirus pandemic got going. So I was surprised to see Callaway Golf Co (ELY) suffer a bearish combined 50 and 200DMA breakdown after reporting earnings. An acquisition may be weighing down price.
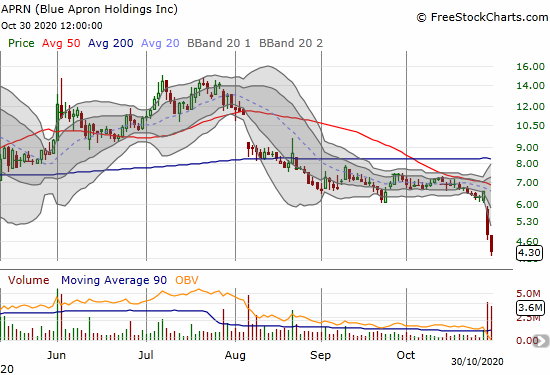
Blue Apron Holdings (APRN)
Blue Apron Holdings (APRN) was one of the first stocks that received attention as a pandemic-related bet. In four days, APRN rocketed from $2.29 to as high as $28.84. At the time, I expressed skepticism over the move. So I am not surprised to see APRN crumbling in the wake of its latest earnings report to trade at a level last seen during that March run-up.
Zillow Group Inc (ZG)
Zillow Group (ZG) is yet one more stock suffering its first close below its 50DMA since April. ZG confirmed that 50DMA breakdown with Friday’s loss despite a small rebound from the intraday lows. ZG signaled more potential trouble for the seasonal trade in home builders and the housing market in general.

Stock Chart Reviews – Above the 50DMA
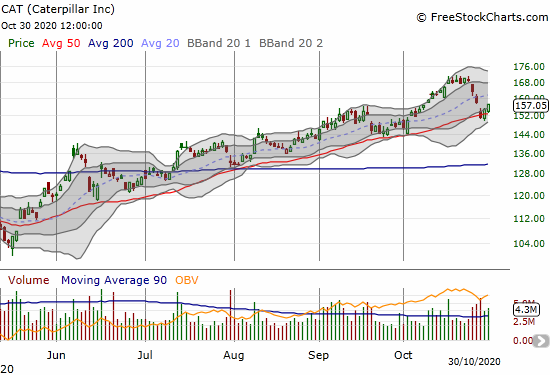
Caterpillar Inc (CAT)
Ahead of earnings, I held out Caterpillar (CAT) as a major test of the industrial plays I prefer in the stock market. CAT failed resoundingly with a 3.2% post-earnings loss. However, CAT is already working on a recovery with a convincing defense of 50DMA support. I am looking to buy into CAT calls this week.
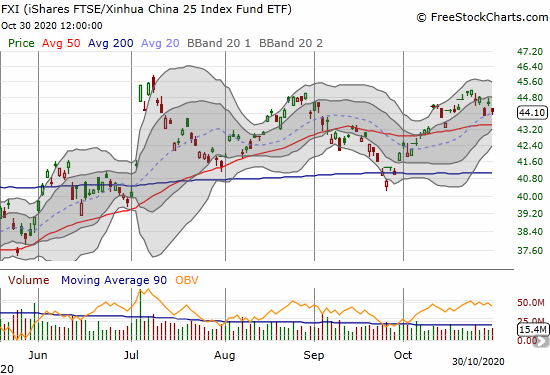
iShares FTSE Xinhua China 25 Index Fund ETF (FXI)
The iShares FTSE Xinhua China 25 Index Fund ETF (FXI) looks like it is carving out a triple top. While FXI remains above its 50DMA, it does not look like a buy until/unless it can break through the triple top.
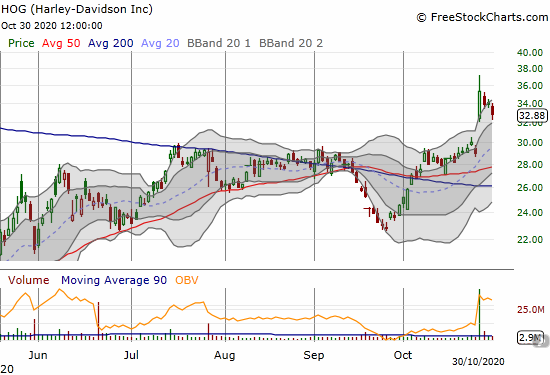
Harley-Davidson (HOG)
Harley-Davidson (HOG) popped for a 22.1% post-earnings gain. I like buying into the current cooling period.
Micron Technology Inc (MU)
Given the recent struggles in high-tech, I am surprised to see Micron Technology Inc (MU) holding important support at the converged 50 and 200DMAs. MU is down over the last two weeks and off a 4-month high.

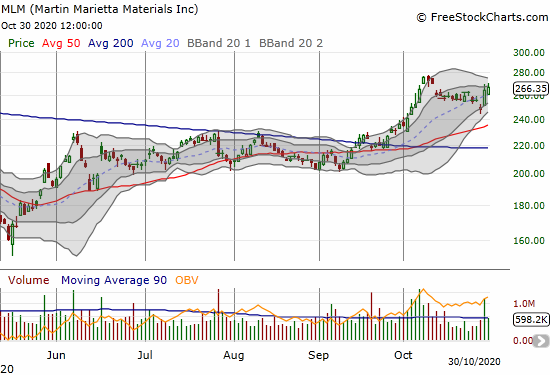
Martin Marietta Materials (MLM)
I bailed on Martin Marietta Materials (MLM) after an analyst downgrade gapped MLM down earlier in the month. A 6.5% post-earnings rebound breathed new life into MLM. Still, I will not return to the stock until/unless it can pierce through the recent high. I will also get “re-interested” in MLM at much lower prices, like a test of 200DMA support.
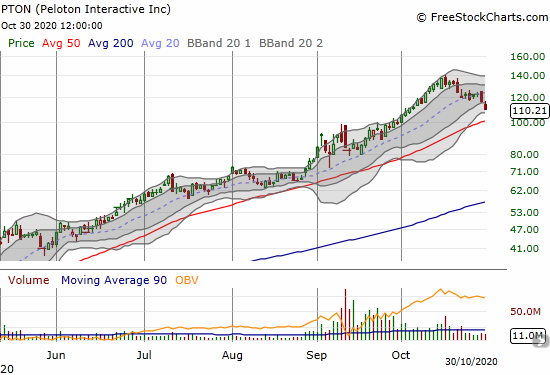
Peloton Interactive Inc (PTON)
Peloton Interactive Inc (PTON) has not cooled off in a long time. PTON is about 21% off its all-time high and looking at a likely test of 50DMA support.
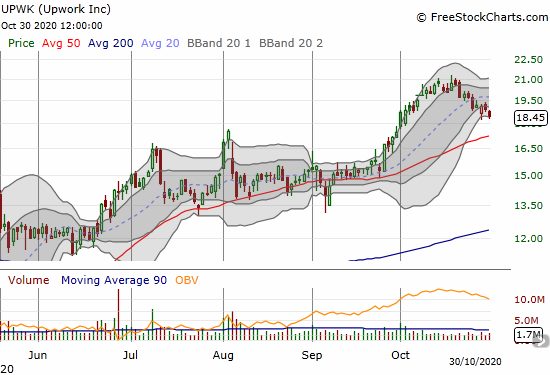
Upwork Inc (UPWK)
After Upwork (UPWK) fell off recent highs, I decided finally to take profits. I still believe in the longer-term story. However, I wanted to preserve profits in front of what looks like an eventual test of 50DMA support.
— – —
FOLLOW Dr. Duru’s commentary on financial markets via email, StockTwits, Twitter, and even Instagram!
“Above the 40” uses the percentage of stocks trading above their respective 40-day moving averages (DMAs) to assess the technical health of the stock market and to identify extremes in market sentiment that are likely to reverse. Abbreviated as AT40, Above the 40 is an alternative label for “T2108” which was created by Worden. Learn more about T2108 on my T2108 Resource Page. AT200, or T2107, measures the percentage of stocks trading above their respective 200DMAs.
Active AT40 (T2108) periods: Day #25 over 20%, Day #3 below 30% (underperiod), Day #21 over 40%, Day #5 under 50%, Day #14 under 60%, Day #43 under 70%
Daily AT40 (T2108)
")
Black line: AT40 (T2108) (% measured on the right)
Red line: Overbought threshold (70%); Blue line: Oversold threshold (20%)
Weekly AT40 (T2108)

*All charts created using FreeStockCharts unless otherwise stated
The T2108 charts above are my LATEST updates independent of the date of this given AT40 post. For my latest AT40 post click here.
Be careful out there!
Full disclosure: long ITB calls, long TSLA calls
*Charting notes: FreeStockCharts stock prices are not adjusted for dividends. TradingView.com charts for currencies use Tokyo time as the start of the forex trading day. FreeStockCharts currency charts are based on Eastern U.S. time to define the trading day.