
Stock Market Statistics
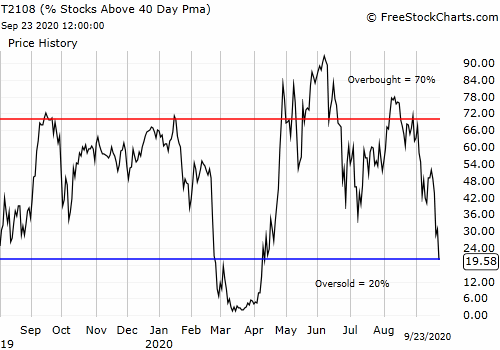
AT40 = 19.6% of stocks are trading above their respective 40-day moving averages (DMAs) (oversold)
AT200 = 36.2% of stocks are trading above their respective 200DMAs
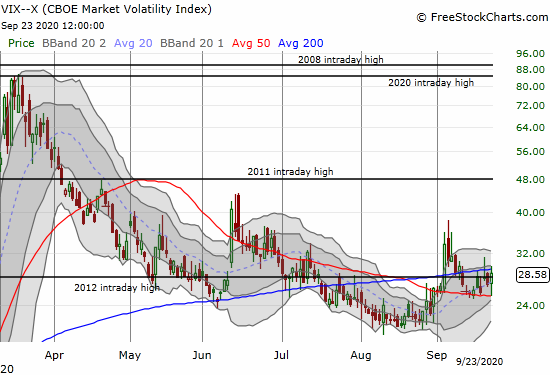
VIX = 28.6
Short-term Trading Call: cautiously bullish
Stock Market Commentary
On Monday I switched to a neutral short-term trading call to get mentally ready for a major change in market posture. I anticipated some back and forth and churn on the way to either oversold trading or a bullish 50DMA breakout. The stock market pressed the point right away with today’s sharp plunge into oversold territory.
The Stock Market Indices
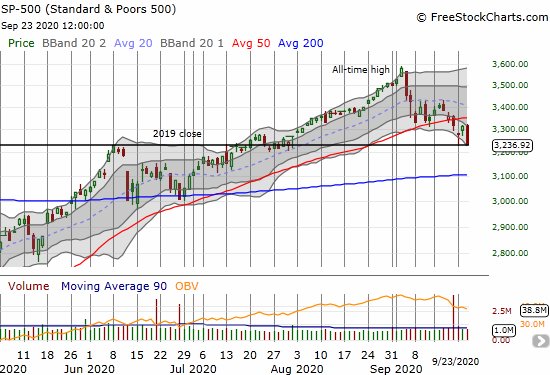
The buyers failed to show up today like they did Monday in perfect, robotic fashion. The S&P 500 (SPY) closed right on top of its 2019 close with a 2.4% loss. A short-term downtrend is in place with the lower Bollinger Band (BB) turned downward.
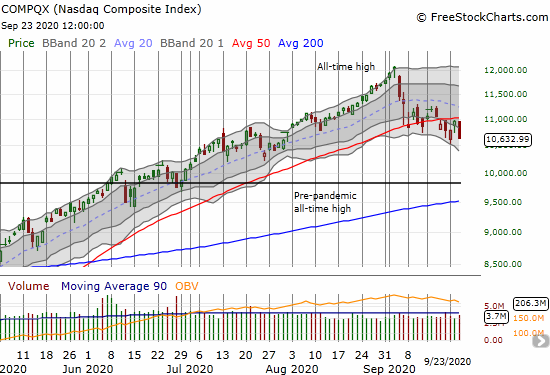
The NASDAQ (COMPQX) outpaced the S&P 500 to the downside with a 3.0% loss. There is no natural support for the tech-laden index until the July lows, and I still think the pre-pandemic all-time high is calling out for an eventual retest.
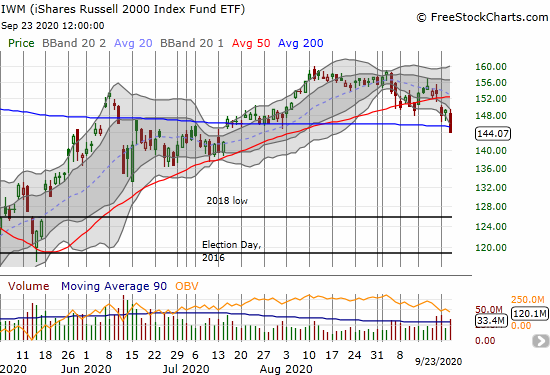
Small caps yawned last Friday in the face of that day’s high tech breakdown. This time around the iShares Russell 2000 Index Fund ETF (IWM) was a full participant in the selling. IWM lost 3.4% and made a bearish 200DMA breakdown that helps to confirm a definitive change in the market’s mood. IWM looks like it has topped out for some time to come.
Stock Market Volatility
The volatility index (VIX) actually struggled to make headway and ended the day with a relatively modest 6.4% gain. I am looking for a real pop before selling my UVXY shares. I fully expect such a pop before oversold trading ends.
Oversold Stock Market: The Short-Term Trading Call

AT40 (T2108), the percentage of stocks trading above their respective 40DMAs, plunged all the way to 19.6. My favorite technical indicator closed in oversold territory, below 20%, for the first time since April.
By rule, the start of oversold trading sends my trading call to cautiously bullish. Accordingly, I nibbled on a few of the decent to good setups I mentioned in last Friday’s post. However, a nibble is all I can stomach right now because I still see a lot more downside potential in the stock market (especially for tech). I did not close any more puts or shorts. AT200 (T2107), the percentage of stocks trading above their respective 200DMAs, is still at 36.2% and peaked out just below 50%.
The downside risks make oversold trading particularly tricky; I prefer to stay stubbornly focused on the bullish case. I do not anticipate as difficult an oversold period as the March stock market collapse, but I also see upside potential on bullish trades capped by the overhead resistance created by 50DMAs on the major indices. Of course, a 50DMA breakout following oversold conditions wold be a very bullish development.
Stock Chart Reviews – Below the 50DMA
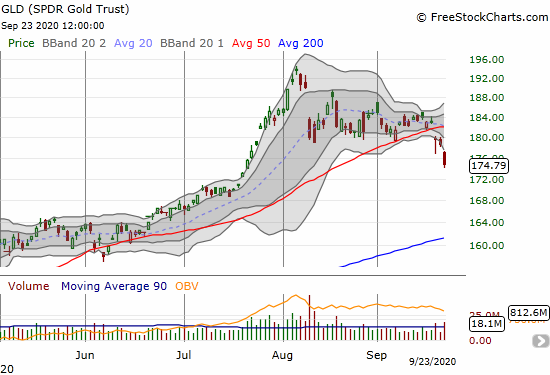
SPDR Gold Trust (GLD)
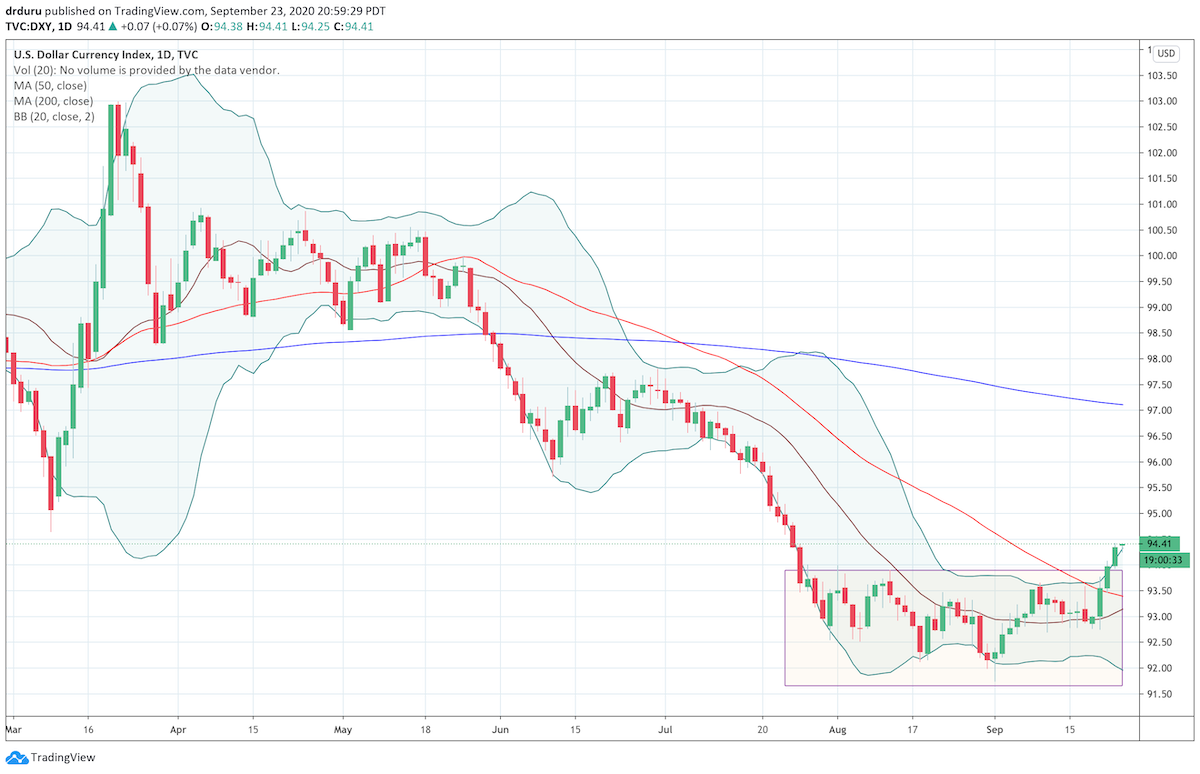
The sell-off in commodities and precious metals caught me off-guard. The U.S. dollar (DXY) is bottoming and changing the bear-dollar market narrative I thought would last for weeks and months ahead.
SPDR Gold Trust (GLD) confirmed a 50DMA breakdown. The drop looks particularly bearish because price fell out of a wedge or triangle pattern. I am sitting on the residual value left in my GLD calls, and I look to buy into a steeper sell-off with call expirations stretching out to early 2021.
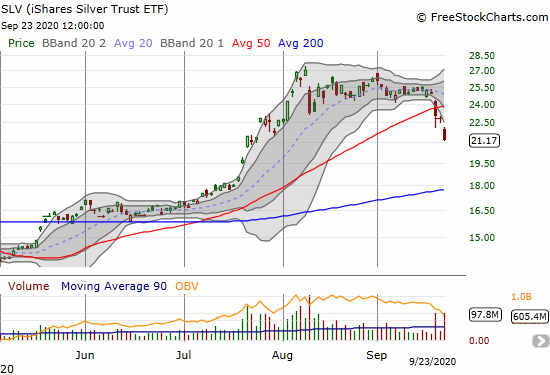
iShares Silver Trust ETF (SLV)
The iShares Silver Trust ETF (SLV) returned to under-performing GLD. SLV confirmed a 50DMA breakdown and plunged 7.1%. I can see SLV eventually testing uptrending 200DMa support. I will reload on SLV calls on such a test.
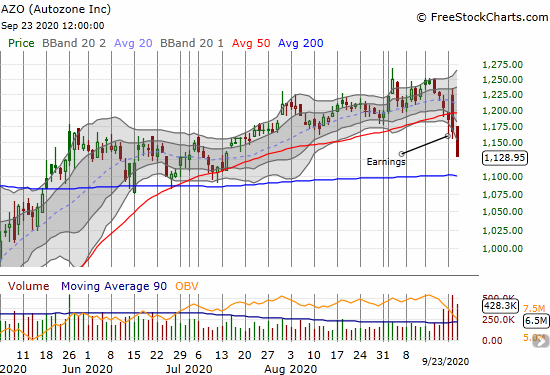
Autozone (AZO)
Autozone (AZO) had a nasty post-earnings gap and crap that confirmed the previous day’s 50DMA breakdown. Today’s 3.2% loss put 200DMA support into play. Still, given the strength of the used car market, I am surprised AZO did not report results that sent the stock soaring. AZO has good company as a growing number of companies have completely reversed post-earnings gains from July and August and sometimes even further back.
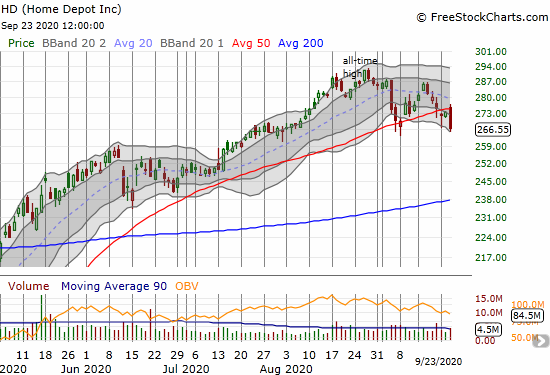
Home Depot Inc. (HD)
Home Depot (HD) is printing a topping pattern. Today’s 2.5% loss confirmed a 50DMA breakdown and signaled buyer’s exhaustion with the latest top around the declining 20DMA. Home Depot’s sudden technical troubles could be a warning for the rest of the housing sector.
Stock Chart Reviews – Above the 50DMA
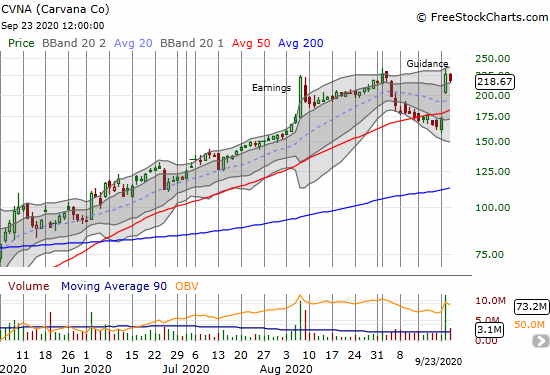
Carvana (CVNA)
As if the early August post-earnings pop was not enough, on-line/vending machine used car company Carvana (CVNA) went for another round on the heels of positive earnings guidance. On Tuesday, the stock soared 30.6% on news that the company would hit EBITDA breakeven this quarter.
I got caught completely flat-footed with CVNA high on my list on Monday for buying put options – 50DMA breakdowns are not created equal! In fact, I was so convinced of this trade, I completely ignored the bullish signal that flashed with the bullish engulfing pattern that created a 5.4% gain on a very negative market day.
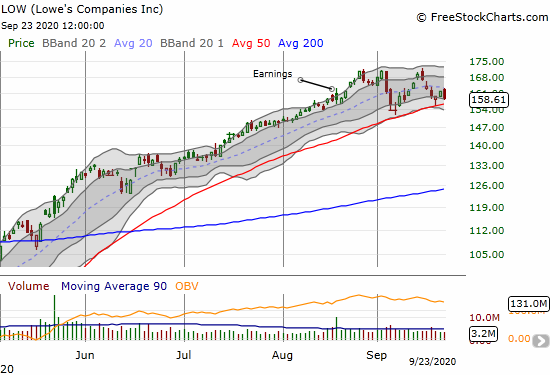
Lowe’s Companies (LOW)
Lowe’s Companies (LOW) is actually out-performing HD on a relative basis. This month LOW survived two 50DMA tests. However, I doubt a third test will work out as well. LOW is forming on a double-top.
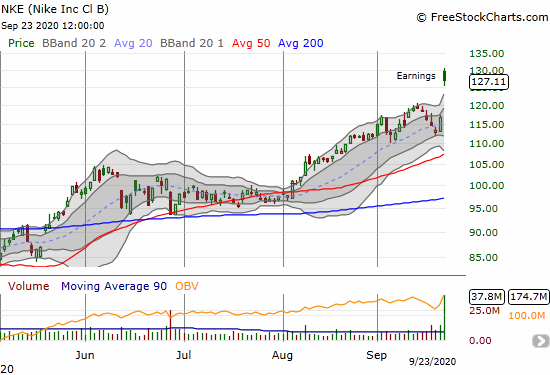
Nike (NKE)
Nike (NKE) crushed earnings with a large gap up and close with an 8.8% gain. Even with the fade off the intraday all-time high, NKE was a definite bright spot on the day! Still, no way I chase this stock higher.
— – —
FOLLOW Dr. Duru’s commentary on financial markets via email, StockTwits, Twitter, and even Instagram!
“Above the 40” uses the percentage of stocks trading above their respective 40-day moving averages (DMAs) to assess the technical health of the stock market and to identify extremes in market sentiment that are likely to reverse. Abbreviated as AT40, Above the 40 is an alternative label for “T2108” which was created by Worden. Learn more about T2108 on my T2108 Resource Page. AT200, or T2107, measures the percentage of stocks trading above their respective 200DMAs.
Active AT40 (T2108) periods: Day #112 over 20%, Day #1 under 30% (underperiod ending 105 days over 30% and 50 days over 40%), Day #1 under 40%, Day #10 under 50%, Day #12 under 60%, Day #15 under 70%
Daily AT40 (T2108)
")
Black line: AT40 (T2108) (% measured on the right)
Red line: Overbought threshold (70%); Blue line: Oversold threshold (20%)
Weekly AT40 (T2108)

*All charts created using FreeStockCharts unless otherwise stated
The T2108 charts above are my LATEST updates independent of the date of this given AT40 post. For my latest AT40 post click here.
Be careful out there!
Full disclosure: long QQQ put spread and calendar put spread, long UVXY, long GLD shares and calls, long SLV shares and calls, long and short U.S. dollar pairs, long CVNA calendar put spread and put
*Charting notes: FreeStockCharts stock prices are not adjusted for dividends. TradingView.com charts for currencies use Tokyo time as the start of the forex trading day. FreeStockCharts currency charts are based on Eastern U.S. time to define the trading day.