
Stock Market Statistics
- AT40 = 46.3% of stocks are trading above their respective 40-day moving averages (DMAs)
- AT200 = 51.9% of stocks are trading above their respective 200DMAs (8-month high)
- VIX = 32.5
- Short-term Trading Call: cautiously bullish
Stock Market Commentary
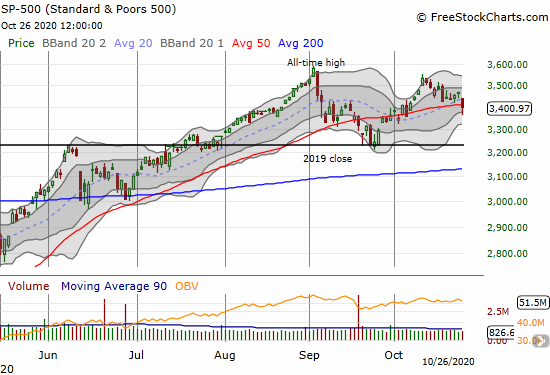
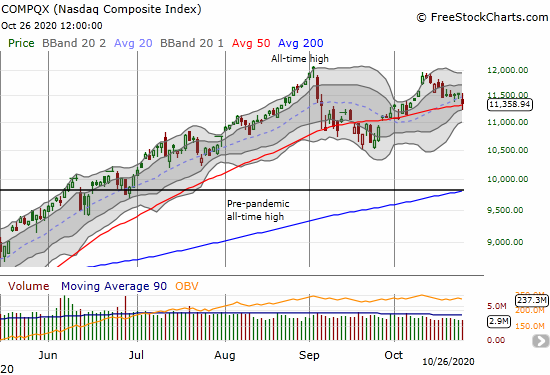
The stock market looked like it was warming up from a period of cooling as key support levels gently repelled the S&P 500 (SPY) and the NASDAQ (COMPQX). That warming melted stock market support levels instead of launching rockets to higher levels as I expected.
The prior technical read came to a swift end Sunday night as international markets dipped into the red and U.S. stock futures sold off. By the time U.S. markets opened, my enthusiasm for new entry points cooled off. Pick from a broad variety of flavors of the day to back into an explanation for the selling. Whether fears of failed negotiations over COVID-19 relief in the U.S., soaring COVID-19 cases in the U.S., looming pandemic lockdowns in Europe, political risks, a major downside surprise in tech, or a small dip in new home sales, the day provided plenty of reasons to resurrect selling pressures in the stock market.
The Stock Market Indices
Before today, the S&P 500 (SPY) looked primed for a fresh bounce. Instead, the index gapped down at the open and soon sliced right through 50DMA support. A rebound off the intraday low was not enough to prevent the 50DMA breakdown. Now I brace for the implications of follow-through selling after this important breach of stock market support.
The NASDAQ (COMPQX) avoided a 50DMA breakdown with a sufficiently strong rebound. The tech-laden index offers a sliver of hope for a belated launch of a fresh rally even after losing 1.6% on the day. The NASDAQ placed a half-hearted vote in favor of stock market support.
Stock Market Volatility
Right after I concluded that the 2012 intraday high had become an important pivot line, the VIX broke out. Suddenly, it looks like the VIX is ready to run hot going into the U.S. Presidential election next week. If more stock market support gives way, the VIX should surge even higher.

The Short-Term Trading Call
AT40 (T2108), the percentage of stocks trading above their respective 40DMAs, dropped below 50% again. There is plenty of room both to the upside and to the downside. If the S&P 500 confirms a 50DMA breakdown, I will drop my short-term trading call to neutral. Subsequently, an oversold reading (AT40 below 20%) or a fresh 50DMA breakout (confirmed with follow-up buying), will get me back on the bullish side of the ledger. Even with the S&P 500 and the NASDAQ toying with (confirmed) 50DMA breakdowns, I am more interested in waiting for bullish setups than chasing the bearish case. As a result, I do not foresee flipping back to bearish any time soon. I am still looking for the conditions that ignite the launch to higher levels.
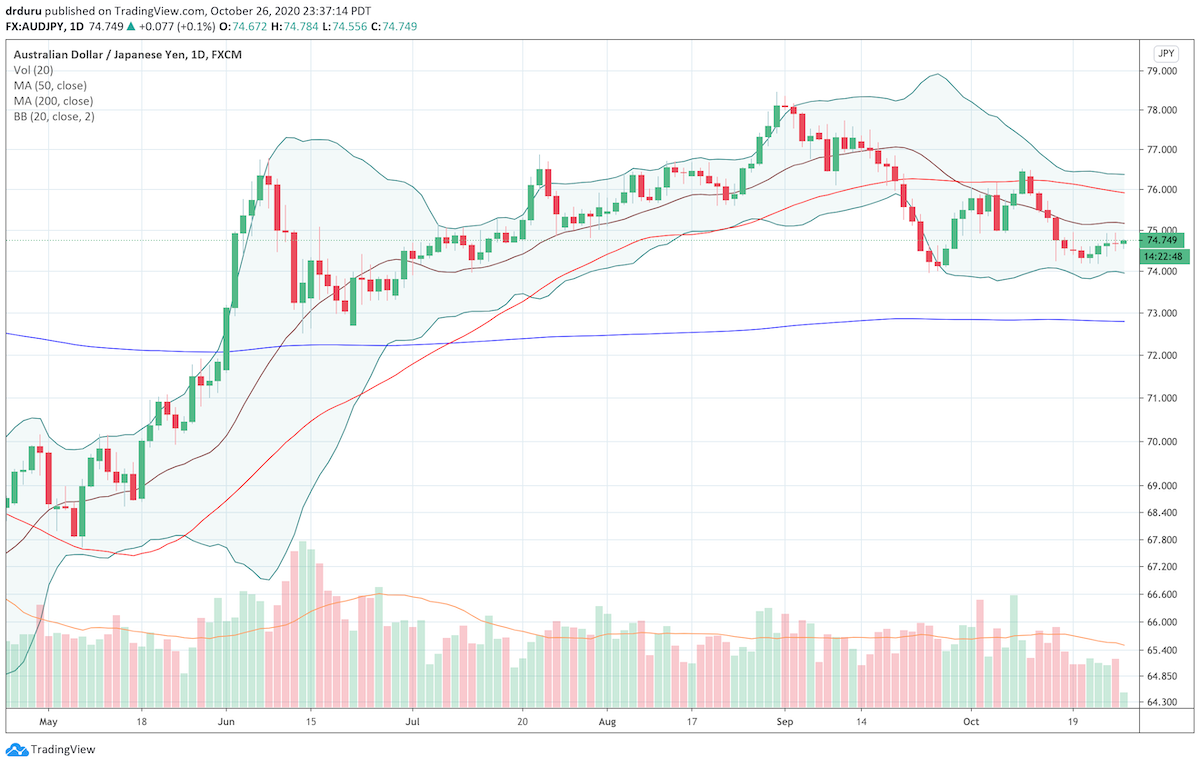
The Australian dollar versus the Japanese (AUD/JPY) is also keeping me on launch watch. This indicator of risk appetites went absolutely nowhere all day. At the time of writing, AUD/JPY is still holding support from its September lows.
Stock Chart Reviews – Below the 50DMA
SAP SE (SAP)
Enterprise software company SAP SE (SAP) sent reverberations throughout the software sector after a small cut in guidance generated a massive post-earnings plunge. The stock is extremely over-extended as it closed well below its lower Bollinger Band (BB). As a result, I think the odds are high for some kind of relief bounce before SAP goes much lower from here.

Oracle Corporation (ORCL)
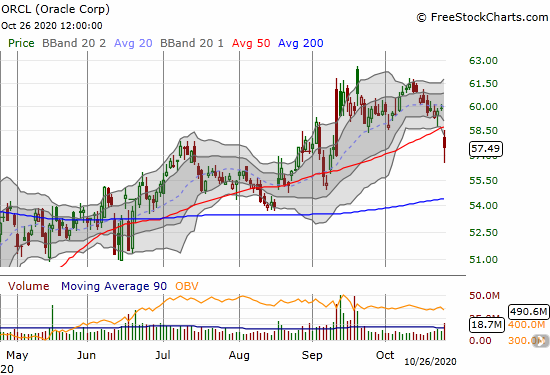
Software/database company Oracle Corporation (ORCL) fell in sympathy with SAP given the overlapping enterprise software footprints. ORCL’s 50DMA breakdown looks bearish enough to put 200DMA support in play. ORCL is now net down after striking a deal in partnership with Walmart (WMT) for Chinese social video platform Tik Tok. Suddenly, that deal feels like forever ago (is it even really happening?).
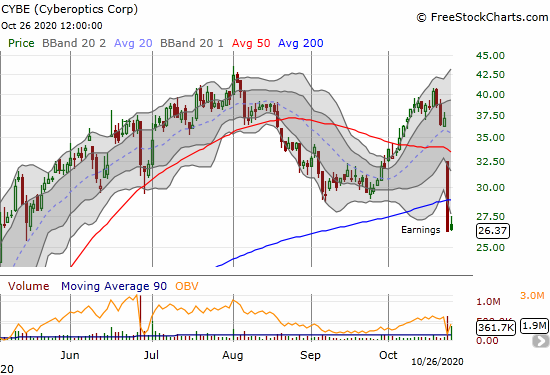
Cyberoptics Corp (CYBE)
Sensing technology solutions and system products company Cyberoptics Corp (CYBE) caught my attention after I saw an analyst defending the stock. Post-earnings selling sent the stock crashing through 50 and 200DMAs. From a technical basis, this stock is tough to defend. CYBE is bearish until proven positive with at least a firm close above the 200DMA.
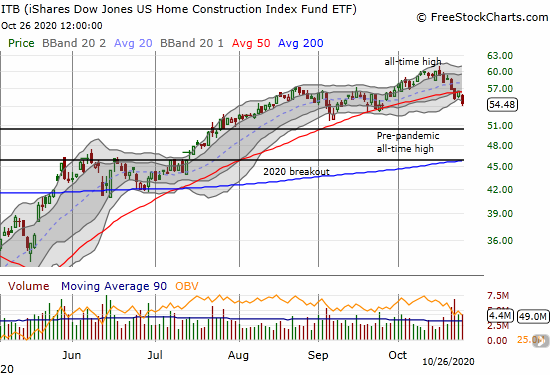
iShares Dow Jones US Home Construction Index Fund ETF (ITB)
Last week I “officially” launched my seasonal trade on home builders as related stocks teetered on critical 50DMA supports or even broke them. Today, many of these same stocks followed through and confirmed 50DMA breakdowns. Most importantly, the iShares Dow Jones US Home Construction Index Fund ETF (ITB) dropped to a 1-month low after confirming its 50DMA breakdown. Before making more trades, I now wait to see what happens when/if ITB retests lows from September.
A small sequential drop in new home sales helped to sour the mood. Expectations are running very high for housing given the extreme optimism of home builders.
Source: U.S. Census Bureau and U.S. Department of Housing and Urban Development, New One Family Houses Sold: United States [HSN1F], retrieved from FRED, Federal Reserve Bank of St. Louis, October 27, 2020.
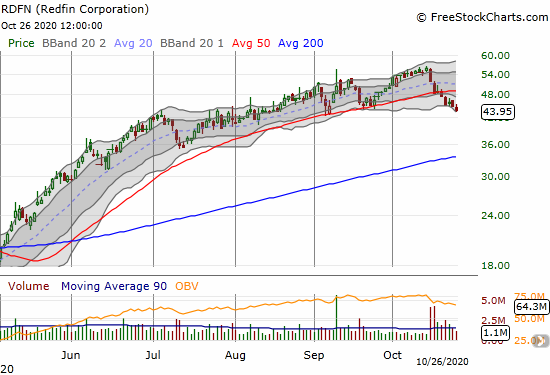
Redfin Corporation (RDFN)
Home buying and selling services company Redfin Corporation (RDFN) entered the “no touch” zone. Like ITB, RDFN is in a clear downtrend from its recent all-time high. Additionally, RDFN is already retesting its September (intraday) lows. If that support fails, RDFN has little to no back-up support until its 200DMA.
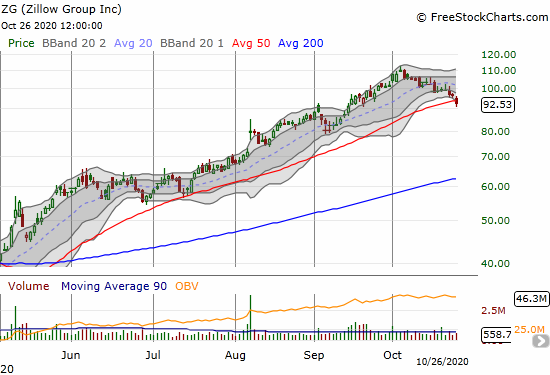
Zillow Group (ZG)
Redfin competitor Zillow Group (ZG) closed below its 50DMA for the first time since April. RDFN last touched its 50DMA in July. A confirmed 50DMA breakdown makes me incrementally more worried about the short-term prospects for housing-related stocks. Of course, per the seasonal buying strategy, these kinds of declines created my preferred entry points.
Stock Chart Reviews – Above the 50DMA
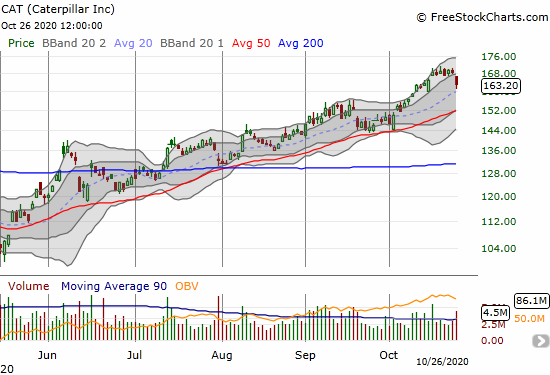
Caterpillar (CAT)
Heavy-equipment maker Caterpillar (CAT) presents a key challenge to my current preference for industrial-type stocks. CAT reports earnings Tuesday morning (October 27th) and fell 3.2% ahead of these earnings. Most importantly, CAT stopped just short of testing its Jan, 2018 all-time high. So follow-up selling from here could mark a solid top for CAT with a 50DMA breakdown further confirming the bearish signal. In other words, CAT really needs a strong showing and reaction from earnings!
— – —
FOLLOW Dr. Duru’s commentary on financial markets via email, StockTwits, Twitter, and even Instagram!
“Above the 40” uses the percentage of stocks trading above their respective 40-day moving averages (DMAs) to assess the technical health of the stock market and to identify extremes in market sentiment that are likely to reverse. Abbreviated as AT40, Above the 40 is an alternative label for “T2108” which was created by Worden. Learn more about T2108 on my T2108 Resource Page. AT200, or T2107, measures the percentage of stocks trading above their respective 200DMAs.
Active AT40 (T2108) periods: Day #21 over 20%, Day #20 over 30%, Day #17 over 40% (overperiod), Day #1 under 50% (underperiod ending 2 days over 50%), Day #10 under 60%, Day #39 under 70%
Daily AT40 (T2108)
")
Black line: AT40 (T2108) (% measured on the right)
Red line: Overbought threshold (70%); Blue line: Oversold threshold (20%)
Weekly AT40 (T2108)

*All charts created using FreeStockCharts unless otherwise stated
The T2108 charts above are my LATEST updates independent of the date of this given AT40 post. For my latest AT40 post click here.
Be careful out there!
Full disclosure: long UVXY, long ITB calls
*Charting notes: FreeStockCharts stock prices are not adjusted for dividends. TradingView.com charts for currencies use Tokyo time as the start of the forex trading day. FreeStockCharts currency charts are based on Eastern U.S. time to define the trading day.