
Stock Market Statistics
- AT40 = 71.7% of stocks are trading above their respective 40-day moving averages (DMAs) (Day #1 overbought)
- AT200 = 66.9%% of stocks are trading above their respective 200DMAs (near 3-year high and confirmed breakout above post financial crisis downtrend)
- VIX = 24.8
- Short-term Trading Call: neutral
Stock Market Commentary
The week of stock market action started with a divergent celebration of positive coronavirus vaccine news. Day number two went much lighter on the extremes but still continued the divergent trading action. High-flying, high-tech stocks continued to sell off while cheaper value, industrial, and reopen stocks gained more ground on the theme of an imminent pandemic recovery. The positive moves were enough to push the stock market into overbought trading conditions.
The Stock Market Indices
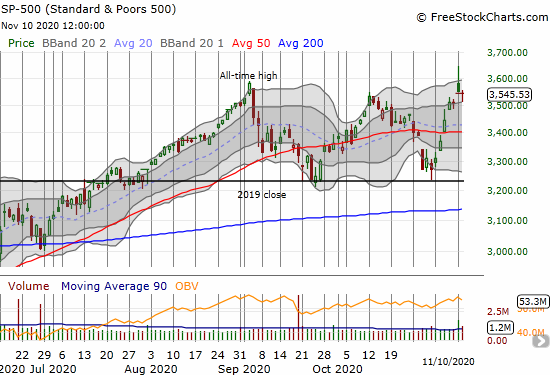
The S&P 500 (SPY) bounced off the bottom of its upper Bollinger Band (BB) and effectively closed flat for the day. The index barely avoided confirming the topping pattern (a blow-off top) from the previous day.
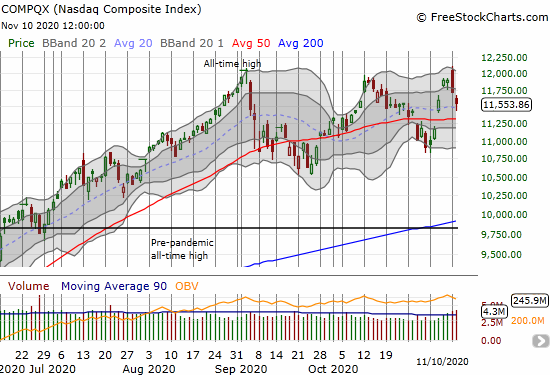
The NASDAQ (COMPQX) lost another 1.4% and confirmed its topping pattern (bearish engulfing). The tech-laden index has a triple top in place yet it remains above its 50-day moving average (DMA) trendline. Moreover, the NASDAQ is pivoting around its 50DMA in what has become a 3-month trading range. So even if the NASDAQ further confirms its bearishness with a 50DMA breakdown, the bottom of the trading range is likely ready to provide support against further losses.
Stock Market Volatility
The volatility index (VIX) lost 3.7%. Its failure to confirm the bottoming hammer pattern from the day before is a good sign for the bulls at the beginning of overbought trading. However, that bottoming pattern is not yet invalidated either.
The Short-Term Trading Call: Overbought Trading

AT40 (T2108), the percentage of stocks trading above their respective 40DMAs, closed at 71.7% and crossed the overbought threshold of 70%. AT40 failed to close above the previous day’s intraday high, so its grip on overbought trading status looks tenuous.
AT200 (T2107), the percentage of stocks trading above their respective 200DMA, pushed to a fresh 3-year high and confirmed strengthening breadth in the stock market. So while a small group of stocks that benefited from the themes of the pandemic are falling fast, a larger crop of beneficiaries from a pandemic recovery are rising out of their sub-200DMA lockdowns. As a result, I will have to be very selective with bearish positions when AT40 falls out of overbought trading conditions. I will also stay neutral as long as AT200 is performing so well. There are no short-term trading conditions that flip me back to outright bullish short except a fresh trip to or close to oversold conditions.
Stock Chart Reviews – Below the 50DMA
Best Buy (BBY)
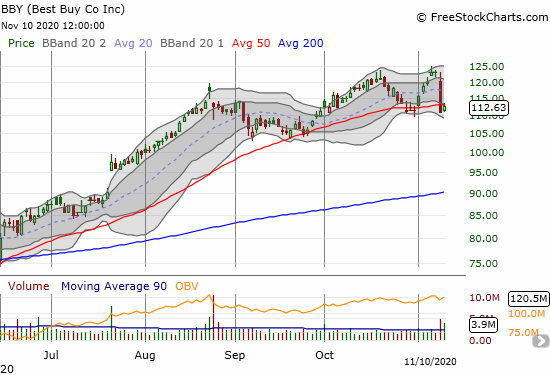
Best Buy (BBY) soared through much of the pandemic as shoppers rushed to buy gadgets to accommodate a new remote work, educational, and social environment. I was surprised that BBY plunged so deeply as it joined the negative side of the reopen trade. Then again, I am also amazed at the run-up BBY enjoyed to this point. BBY closed at $51.65 at the depths of the stock market collapse. Although BBY remains below its 50DMA, it did not confirm the breakdown with follow-through selling. I like taking a swing at going long here with a tight stop below the previous day’s low (which coincides with the October low).
D.R. Horton Inc (DHI)
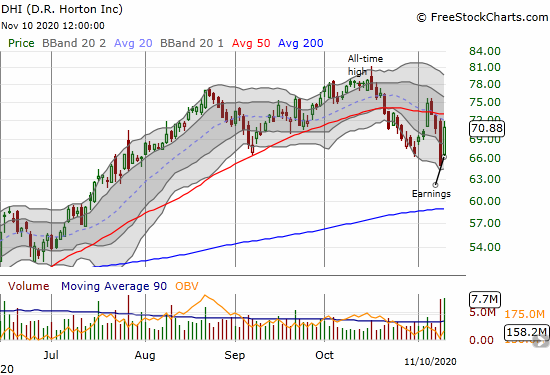
D.R. Horton Inc. (DHI) helped revive interest in home builders. The company received strong applause (or at least strong relief) after raising guidance in its earnings report. DHI soared 9.1%. The stock still needs to recover from its confirmed 50DMA breakdown.
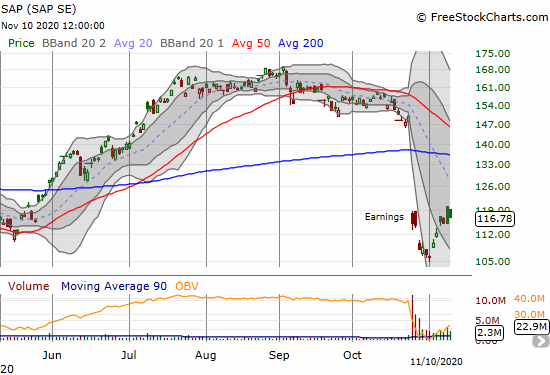
SAP SE (SAP)
After SAP crashed post-earnings, I concluded the stock would experience a relief rally before going lower. The relief rally lasted just a few minutes after the next day’s open. SAP faded and then gapped down again from there. The relief rally is in place now. SAP even survived the sell-off in tech. The stock is a short below $115, the previous day’s low, and a buy above $120, which would confirm an on-going post-earnings recovery.
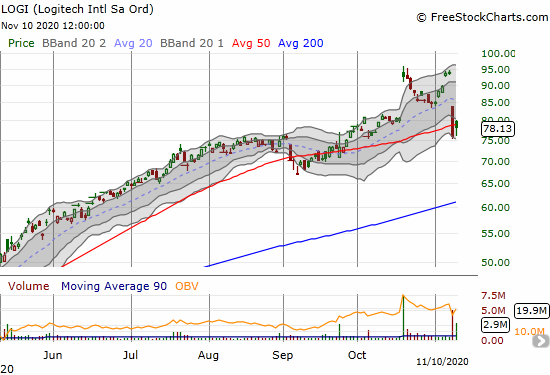
Logitech International SA (LOGI)
During the pandemic, buying the gadget makers was an even better bet than the retailers selling the gadgets. Computer peripherals company Logitech International SA (LOGI) fell as low as $33.98 in March’s stock market collapse. Its last earnings report sent the stock soaring 15.8% to a new all-time high. The stock cooled off from there. LOGI got caught up in Monday’s sell-off of pandemic beneficiaries. The stock recovered today with a close above its 50DMA. LOGI is a buy here with a stop below Monday’s low. I would target an eventual fill of the gap down.
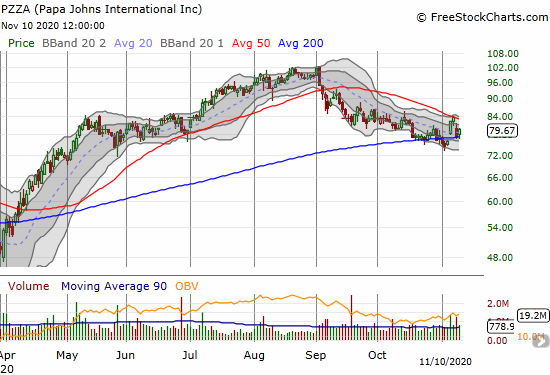
Papa Johns International (PZZA)
I bought call options in Papa Johns International (PZZA) as it rose from a positive post-earnings response last Thursday. PZZA closed that day with an 8.1% gain and followed through the next day. I was prepared for PZZA to make a 50DMA breakout this week, but it too got caught up in the selective sell-off. I did not quite appreciate how much pizza delivery benefited from the lockdowns of the pandemic.
PZZA held 200DMA support so it remains in a bullish position. I am looking for a continued rebound and recovery and will buy shares on a confirmed 50DMA breakout. Accordingly, I added to my call options on the dip. I just hope the stock did not exhaust itself tagging $100 in August.
Stock Chart Reviews – Above the 50DMA
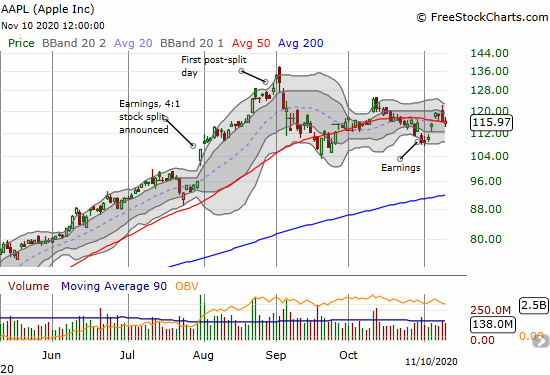
Apple (AAPL)
I think Apple straddles the fence between the pandemic-friendly stocks and the pandemic-recovery stocks. I still scratch my head over how Apple thrived through the pandemic. The prospects of a return to normalcy should further boost Apple’s results as a consumer products company. Indeed, AAPL gapped up on Monday before mercurial traders and investors tossed the stock over the fence. AAPL is still holding 50DMA support, and I am clinging to weekly call options on the stock.
General Motors Company (GM)
I flagged General Motors Company (GM) as a bullish 200DMA breakout in September. The drama with Nikola (NKLA) ultimately kept me out of the stock even after GM neatly survived a test of 50DMA support later that month. Thirty-three percent later, and I am of course regretting I never made the move. I am looking for the next dip to buy. I like GM’s strong post-earnings performance and the growing narrative about GM’s strong offerings in electrified transportation.

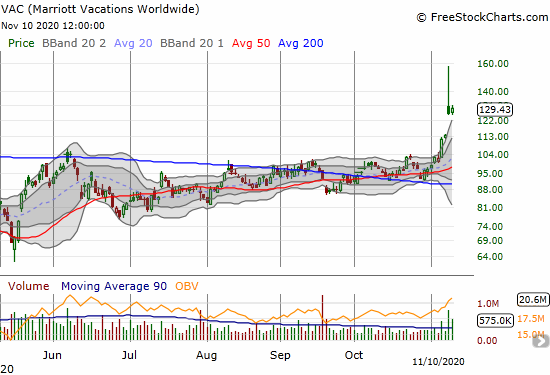
Marriott Vacations Worldwide (VAC)
Monday was full of astounding extremes as traders and investors stampeded into reopening stocks. Marriott Vacations Worldwide (VAC) was one of the most extreme that I saw given the range of movement. At one point, VAC was up 38.5%. Profit-takers squeezed VAC back down to a 10.7% gain. I am surprised the selling did not continue today. Once VAC calms down, I will likely buy into this breakout. VAC formed an extended and solid base from April to November. As a result the stock was a coiled spring just looking for an excuse to pop.
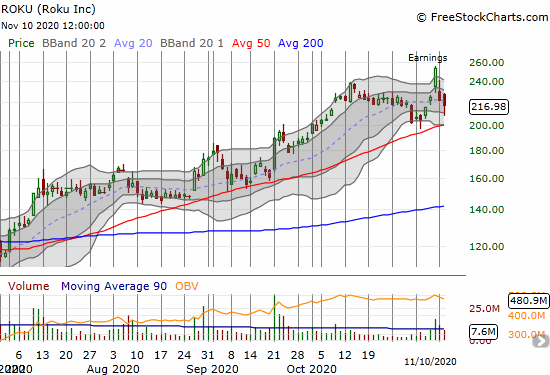
Roku (ROKU)
Roku (ROKU) jumped 12.6% post-earnings last week to a new all-time high. All those gains evaporated in Monday’s selling. Assuming the dust will settle soon, I moved into a calendar call spread. If the the fundamental thesis was real on Friday, I fully expect it to remain just as valid in a reopening economy.
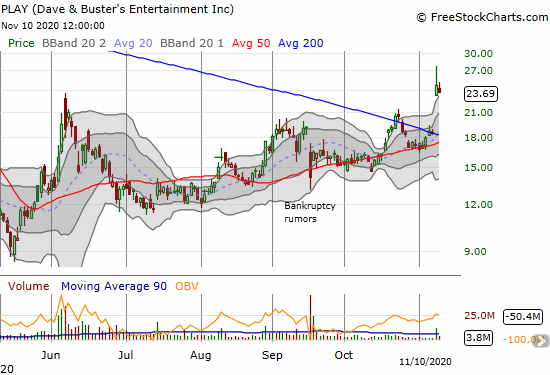
Dave & Busters Entertainment (PLAY)
I wrote about Dave & Busters Entertainment (PLAY) after the stock started a rebound from bankruptcy rumors in September. After a month of consolidation, PLAY made a run for 200DMA resistance. Monday’s trading definitively cleared the hurdle. PLAY also made a bullish breakout from a wedge or triangle pattern with a pivot around the 50DMA. PLAY also managed to clear the June highs. As a result, I am ready to buy the dips.
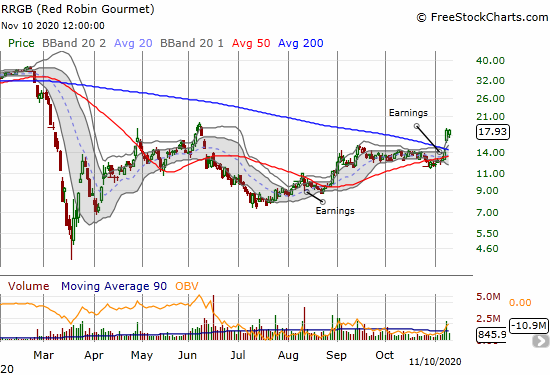
Red Robin Gourmet (RRGB)
Some reopening plays failed to clear the June highs despite soaring on Monday. Red Robin Gourmet (RRGB) is one of those stocks. Still, the 200DMA breakout is bullish, especially combined with the positive response to the last earnings report. I traded in and out of RRBG since March. I am now ready to accumulate shares on dips.
— – —
FOLLOW Dr. Duru’s commentary on financial markets via email, StockTwits, Twitter, and even Instagram!
“Above the 40” uses the percentage of stocks trading above their respective 40-day moving averages (DMAs) to assess the technical health of the stock market and to identify extremes in market sentiment that are likely to reverse. Abbreviated as AT40, Above the 40 is an alternative label for “T2108” which was created by Worden. Learn more about T2108 on my T2108 Resource Page. AT200, or T2107, measures the percentage of stocks trading above their respective 200DMAs.
Active AT40 (T2108) periods: Day #21 over 20%, Day #5 above 30%, Day #4 over 40%, Day #3 over 50%, Day #2 over 60%, Day #1 over 70% (first overbought day ending 47 days under 70%)
Daily AT40 (T2108)
")
Black line: AT40 (T2108) (% measured on the right)
Red line: Overbought threshold (70%); Blue line: Oversold threshold (20%)
Weekly AT40 (T2108)

*All charts created using FreeStockCharts unless otherwise stated
The T2108 charts above are my LATEST updates independent of the date of this given AT40 post. For my latest AT40 post click here.
Be careful out there!
Full disclosure: long UVXY, long AAPL calls, long ROKU calendar call spread, long PZZA calls
*Charting notes: FreeStockCharts stock prices are not adjusted for dividends. TradingView.com charts for currencies use Tokyo time as the start of the forex trading day. FreeStockCharts currency charts are based on Eastern U.S. time to define the trading day.