
Stock Market Statistics
- AT40 = 52.4% of stocks are trading above their respective 40-day moving averages (DMAs)
- AT200 = 53.3% of stocks are trading above their respective 200DMAs (8-month high)
- VIX = 24.9
- Short-term Trading Call: neutral
Stock Market Commentary
Based on AP results, Joe Biden and Kamala Harris declared victory in the U.S. Presidential race. Apparently anticipating this result, the stock market voted to rally the entire week – or at least the stock market seemed to anticipate certainty to unfold in short order. After a weak second-half of October that dragged the stock market close to oversold trading conditions, both the S&P 500 (SPY) and the NASDAQ (COMPQX) recorded strong performances on the week. Going into the election and coming out of the election, the stock market barely missed a beat. Just about every precinct clearly declared a vote to rally. Only Friday delivered a pause of sorts.
The Stock Market Indices
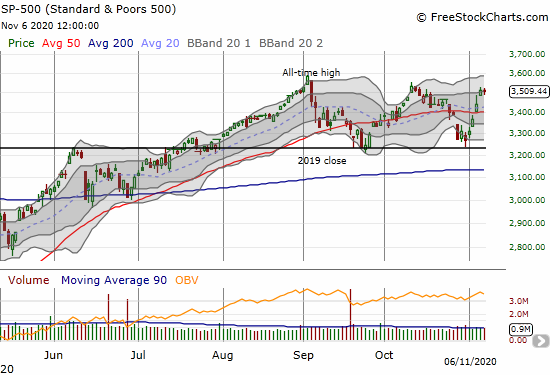
After a picture perfect test of support at the 2019 close, the S&P 500 (SPY) leapt and sliced right through its 50-day moving average (DMA). The 7.3% gain for the week quickly erased the loss from October and stopped just short of challenging October’s high.
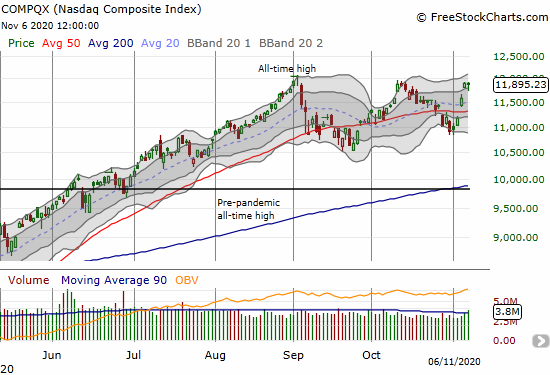
The NASDAQ (COMPQX) did not test a “natural” support line, but it soared alongside the S&P 500 all week. The tech-laden index out-performed with a 9.0% gain for the week. The NASDAQ even managed to (marginally) close above October’s closing high. The index looks positioned for another vote to rally and a run at a fresh all-time high.
Stock Market Volatility
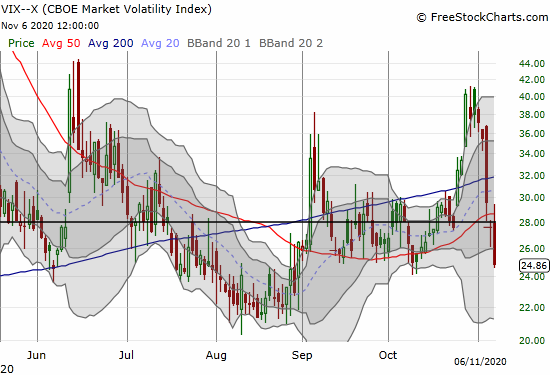
The volatility index (VIX) took a major hit for the week. All the preparations for a contentious election outcome started to melt away the day before the election. The day after the election the VIX plunged 16.8%. Next, the VIX fell 6.7%. Even with the S&P 500 and the NASDAQ closing flat on the day, the VIX plunged anew by 9.9% on Friday. Just like that, the VIX is right back to the October lows. All the presumed uncertainty from October vaporized in a voting frenzy to start the month of November.
The Short-Term Trading Call After the Vote to Rally
The day after the election I decided to flip from cautiously bullish to neutral given the failure of the AT40 (T2108), the percentage of stocks trading above their respective 40DMAs, to confirm the day’s rally and 50DMA breakouts. Even as I recognized the potential upside ahead, I wanted to be ready for considering the bearish implications of a run-up into overbought conditions. AT40 proceeded to jump to 57.8% the next day. However, AT40’s drop back to 52.4% on Friday made me even more wary about the underlying quality of the rally.
My early downshift in the trading call made me too ready to continue accumulating shares in UVXY. In retrospect, I could have and should have waited before adding to the shares I bought ahead of the election “just in case.” Moreover, October’s 2.8% loss on the S&P 500 fell right between the median and average maximum historical drawdown for October. Thus, protecting against a quick rebound in volatility was a hedge against a low probability continuation of October’s selling (taking out the potential catalyst of the election).
Going forward, I have more UVXY shares than I need. As a result, while I have a neutral rating for the short-term trading action, I will be more willing to buy dips than chase breakdowns in individual stocks.
Stock Chart Reviews – Below the 50DMA
Twitter (TWTR)
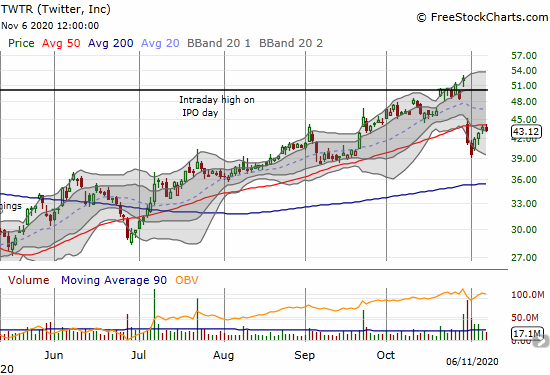
The intraday high on IPO day turned into a hard ceiling for Twitter (TWTR). A breakout ahead of earnings turned into a fakeout as TWTR lost a whopping 21.1%. Despite the 50DMA breakdown, I jumped into the fray by selling a November $43 put option. I remain as big a fan of Twitter as ever and treat big pullbacks as buying opportunities whether for swing trades or longer-term investments.
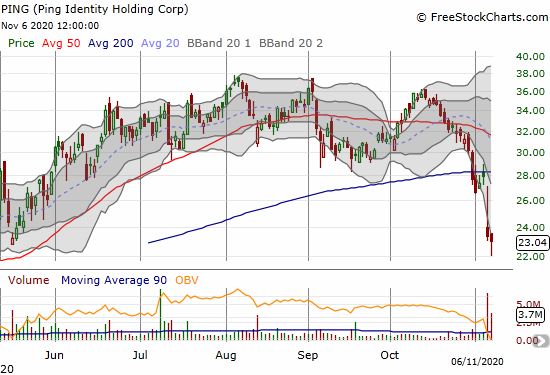
Ping Identity Holding Corp (PING)
Enterprise identity solutions company Ping Identity Holding Corp (PING) suffered a bearish 200DMA breakdown following earnings. The 16.5% loss drove PING to a 7-month low. Technically, PING is a short, but I suspect that the stock will soon stabilize and make a run first for its 200DMA. I will be watching for buyers to make a definitive move, like a close above $24.
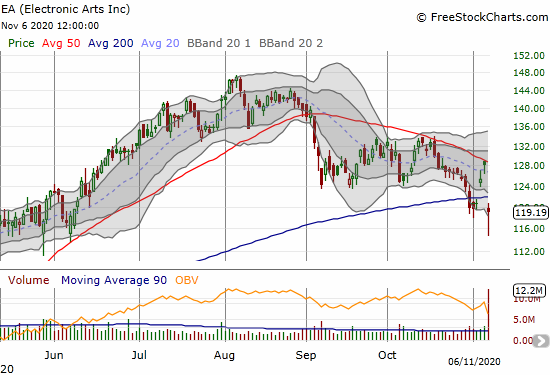
Electronic Arts (EA)
Video game company Electronic Arts (EA) suffered a bearish 200DMA breakdown with a 7.1% post-earnings loss. EA topped out in August and twice confirmed 50DMA resistance first in October and then this month. With the stock just under its 200DMA, I consider EA a short with a tight stop above the 200DMA.
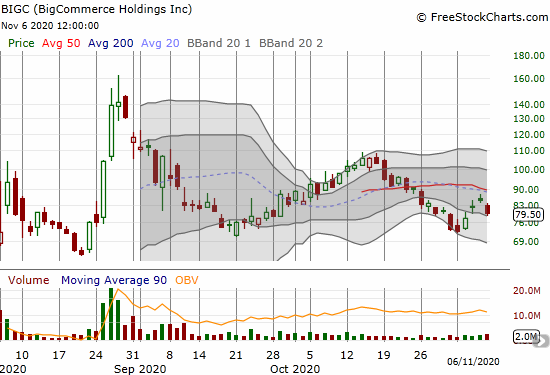
BigCommerce Holding Inc (BIGC)
BigCommerce Holding Inc (BIGC) lost 6.8% post-earnings. Resistance looks locked-in overhead at the 50DMA. A 50DMA breakout from here would be very bullish.
Stock Chart Reviews – Above the 50DMA
Zoom Video Communications Inc (ZM)
Zoom Video Communications Inc (ZM) stalled in October after a soaring September. ZM’s 50DMA stood firm as support and created the next buying opportunity. However, ZM’s valuation is so stratospheric – 109 times sales and 154 times earnings – that I cannot get interested in even risking a swing trade here.

United Rentals Inc (URI)
As I mentioned in the last Above the 40 post, United Rentals Inc (URI) was one of many industrial names that suffered a big swoon the day after the U.S. Presidential election. URI lost 11.1% that day and punctured its 50DMA. The stock rebounded over the following two days. I am looking to buy into URI this week. I like how URI rebounded from a confirmed 50DMA breakdown post-earnings.

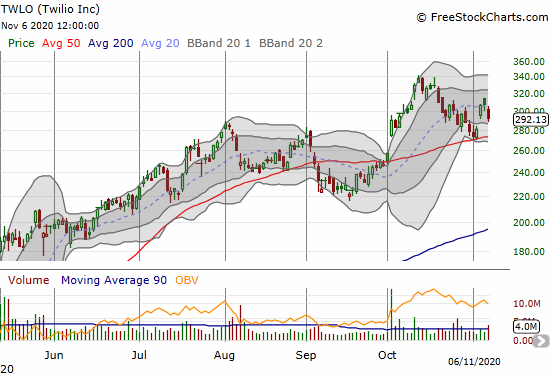
Twilio Inc (TWLO)
Twilio Inc (TWLO) announced a massive insider sale of 9,522,489 shares “from time to time.” As of Friday’s close those shares are worth $2.8B and 5.9% of the market cap. Given TWLO trades about 2.8M shares a day, this kind of sale represents a significant amount of overhang. Friday’s drop of 5.0% makes sense in the wake of this news, but I have to assume more downside is coming. I will be watching closely to see whether TWLO can hold 50DMA support again.
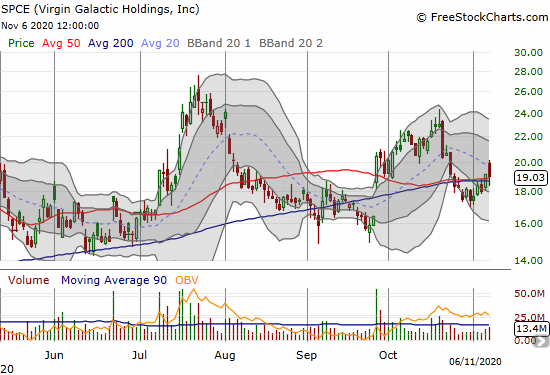
Virgin Galactic Holding, Inc. (SPCE)
With earnings out of the way, I jumped back into space tourism company Virgin Galactic Holding, Inc. (SPCE) as it faded on Friday back to converged support at its 50 and 200DMA. SPCE is a very speculative play, but I am looking for the stock to eventually retest its July highs.
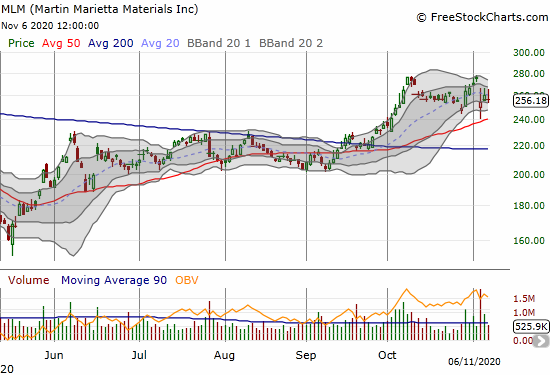
Martin Marietta Materials Inc (MLM)
Martin Marietta Materials Inc (MLM) plunged 8.1% in the wake of the election as part of a blue wave “letdown.” I was not fast enough to buy back into MLM as it tested 50DMA. Given the churn to end the week, I am expecting to get another chance soon.
SPDR Gold Trust (GLD)
SPDR Gold Trust (GLD) broke out on Thursday with a 2.3% gain and a close above its 50DMA. GLD looks ready to regain the momentum that led to August’s peak.

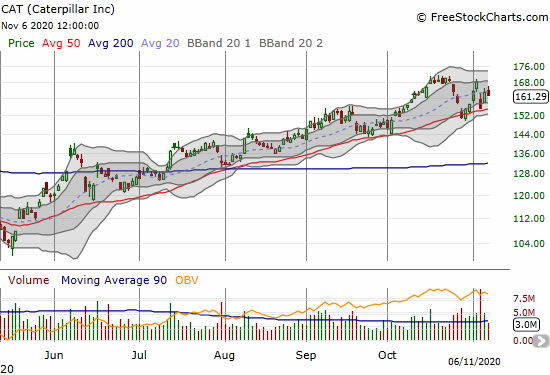
Caterpillar (CAT)
I returned to Caterpillar (CAT) on Friday with a fresh weekly $167.50 call spread and $165 call option. Like similar industrial plays, I am expecting upward momentum to resume as early as the coming week.
Alibaba Group Holding Ltd (BABA)
Alibaba Group Holding Ltd (BABA) has experienced a lot of drama around its financial arm called Ant Group. The company was forced to suspend an IPO for Ant after the Chinese government took umbrage with disparaging comments made by founder Jack Ma. BABA fell 8.1% and broke down below its 50DMA. Interestingly, the stock closed the week with a convincing rebound above its 50DMA. Singles day is coming to China on November, 11th so perhaps opportunistic traders jumped into the breach to catch some fresh stock momentum from the big Chinese sales event. BABA looks like a buy to play a potential gap fill with a very tight stop below the 50DMA.

— – —
FOLLOW Dr. Duru’s commentary on financial markets via email, StockTwits, Twitter, and even Instagram!
“Above the 40” uses the percentage of stocks trading above their respective 40-day moving averages (DMAs) to assess the technical health of the stock market and to identify extremes in market sentiment that are likely to reverse. Abbreviated as AT40, Above the 40 is an alternative label for “T2108” which was created by Worden. Learn more about T2108 on my T2108 Resource Page. AT200, or T2107, measures the percentage of stocks trading above their respective 200DMAs.
Active AT40 (T2108) periods: Day #28 over 20%, Day #3 above 30%, Day #2 over 40% (overperiod), Day #8 under 50%, Day #17 under 60%, Day #46 under 70%
Daily AT40 (T2108)
")
Black line: AT40 (T2108) (% measured on the right)
Red line: Overbought threshold (70%); Blue line: Oversold threshold (20%)
Weekly AT40 (T2108)

*All charts created using FreeStockCharts unless otherwise stated
The T2108 charts above are my LATEST updates independent of the date of this given AT40 post. For my latest AT40 post click here.
Be careful out there!
Full disclosure: long UVXY, short TWTR put, long SPCE, long GLD shares and call options, long CAT calendar call spread and call
*Charting notes: FreeStockCharts stock prices are not adjusted for dividends. TradingView.com charts for currencies use Tokyo time as the start of the forex trading day. FreeStockCharts currency charts are based on Eastern U.S. time to define the trading day.