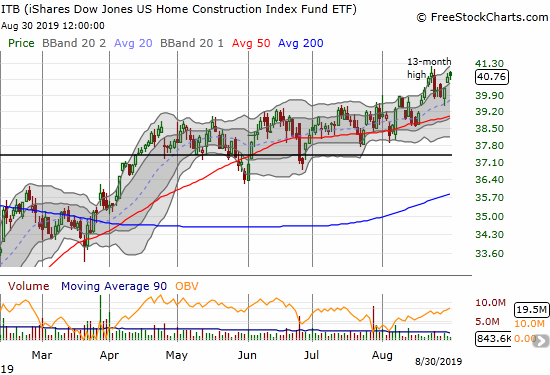
Housing Market Review (August, 2019) – The Rally Is Real But the Data Still Lag

Housing Market Intro/Summary In the last Housing Market Review, I discussed my slow and reluctant acceptance of a stock market that was effectively front-running the seasonally strong period for the stocks of home builders (starting in October/November). I also showed the near consistent dichotomy between builders excelling at selling lower-priced homes to buyers trying to … Read more

A Banner Month for Home Builders Even As the Stock Market Churned

The iShares Dow Jones Home Construction ETF (ITB) closed out August just under its 13-year high. August delivered a healthy 4.8% gain.

While the month of August was full of sharp trading action which left the S&P 500 (SPY) trapped in a trading range, home builders emerged stronger. The 4.8% August gain for iShares Dow Jones Home Construction ETF (ITB) far out-performed the S&P 500 (SPY) which languished with a 1.8% loss. Ironically, the stock market’s small … Read more

A Stock Market Stuck In An Obvious Trading Range Still Produces A Rich Set of Expectations – Above the 40 (August 29, 2019)

AT40 = 38.3% of stocks are trading above their respective 40-day moving averages (DMAs) AT200 = 44.1% of stocks are trading above their respective 200DMAs (2-month low)VIX = 19.0Short-term Trading Call: neutral Stock Market Commentary The Trigger Finger On Tuesday (August 27), I saw enough hints of a flip from a bullish to bearish divergence … Read more

The 401K Stock Market Loses Some Faith As Divergence Flips – Above the 40 (August 27, 2019)

AT40 (T2108) closed below Friday's precipitous low, making my favorite technical indicator look finally ready to drop to oversold trading conditions.

AT40 = 28.6% of stocks are trading above their respective 40-day moving averages (DMAs) AT200 = 39.5% of stocks are trading above their respective 200DMAs (2-month low)VIX = 20.3Short-term Trading Call: neutral (from cautiously bullish) Stock Market Commentary The 401K stock market’s ugly sandwich just got a bit soggy. My premise for clinging to a … Read more

Forex Critical: A Bad Turn for the Turkish Lira

The U.S. Dollar vs the Turkish lira (USD/TRY) confirmed its 50DMA breakout with a second higher close.

The honeymoon seems already over for the new governor of the Central Bank of the Republic of Turkey (CBRT). After the promotion of Murat Uysal to governor of the CBRT, I concluded the Turkish lira would weaken. That weakness lasted all of one day, and the lira proceeded to bounce around in a range. Next … Read more

Home Builder Breakouts: KB Home and Catch-Up Time for Lennar

The grind played out for about 5 months – including a sell-off in June ahead of earnings. Now, KB Home (KBH) finally managed to break out to a new high for the year. KB Home (KBH) finally joined the growing list of home builders breaking to prices last seen last year and earlier. KBH is … Read more

The Google Trend Momentum Check Points to Next Launchpad for Bitcoin

This weekly view of Google Trends for Bitcoin shows a steady uptrend featuring higher highs and higher lows since Bitcoin broke out in April.

Bitcoin (BTC/USD) made a major peak on June 26th. Since then, the cryptocurrency has pivoted around its 50-day moving average (DMA). Three breakdowns of that line of support have been met with buyers which suggests to me that Bitcoin is consolidating a launchpad for imminently higher prices. The Google Trend Momentum Check (GTMC) supports my … Read more

Christmas In August Fails to Prevent A Test of the Month’s Extremes – Above the 40 (August 14, 2019)

The S&P 500 (SPY) printed a marginally new low for the month after a 2.9% loss.

AT40 = 26.1% of stocks are trading above their respective 40-day moving averages (DMAs) AT200 = 40.3% of stocks are trading above their respective 200DMAs (2-month low)VIX = 22.1Short-term Trading Call: neutral (caveats below!) Stock Market Commentary When the S&P 500 (SPY) bounced away from the oversold threshold last week, it left behind an extreme … Read more

Tesla: New Trading Strategies for A Fresh Breakdown and New Price Range

The monthly chart of Tesla (TSLA) suggests the stock has entered a lower trading range. If this range fails, there are likely two more lines of firm support before the stock hits an air pocket that would threaten all the steep gains from 2013.

The Short-Term Breakdown The technical conditions for Tesla (TSLA) have greatly deteriorated since I wrote about short-term and long-term trading strategies on the stock. I focused on two main trading strategies: 1) a longer-term covered call strategy for bullish investors fortunate enough to own 100+ shares of stock and 2) what I considered at the … Read more

Real Estate Pairs Trade Refresh: Long Redfin, Short Zillow Group

The ratio of Redfin (RDFN) vs Zillow Group (Z) (ZG) is bouncing off its well-supported historic lows.

My last pairs trade going long Redfin (RDFN) calls versus long Zillow Group (Z) (ZG) put options did not work out as I over-extended my stay on RDFN. A fresh opportunity for a pairs trade has arrived with RDFN neatly testing key support after reversing most of its post-earnings gains and with Zillow Group in … Read more