
AT40 = 38.3% of stocks are trading above their respective 40-day moving averages (DMAs)
AT200 = 44.1% of stocks are trading above their respective 200DMAs (2-month low)
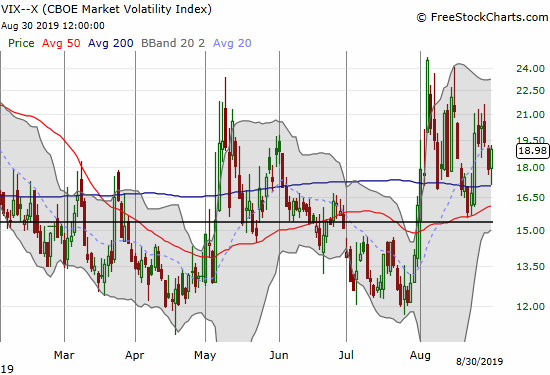
VIX = 19.0
Short-term Trading Call: neutral
Stock Market Commentary
The Trigger Finger
On Tuesday (August 27), I saw enough hints of a flip from a bullish to bearish divergence that I backed off my short-term cautiously bullish positioning. I also did not like the way the market faded after a nice gap up, and I quickly took a loss on my core short-term trade in S&P 500 (SPY) call options. The index closed with a fractional loss that day, but the buyers went right back to work for the rest of the week. My original thesis of a rechallenge of resistance at the 50-day moving average (DMA) turned out to be a prescient call after all as the S&P 500 closed out a volatile August with one more fade from 50DMA resistance.
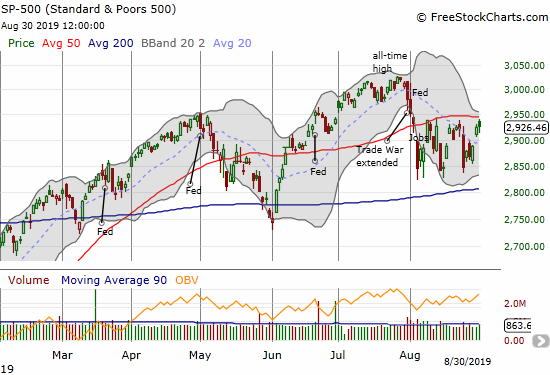
With a bit of hindsight, I reviewed the trading action and realized that I should have waited to see whether the last low broke instead of prematurely scratching the itchy trigger finger. The market had not yet invalidated my main thesis of a succession of higher lows…and it still has not done so. My pressure to act came from an options expiration in 3 days. Buying calls with another week of expiration, or even replacing my shorter-dated call options, would have allowed me to wait out my thesis more comfortably.
The rest of the picture
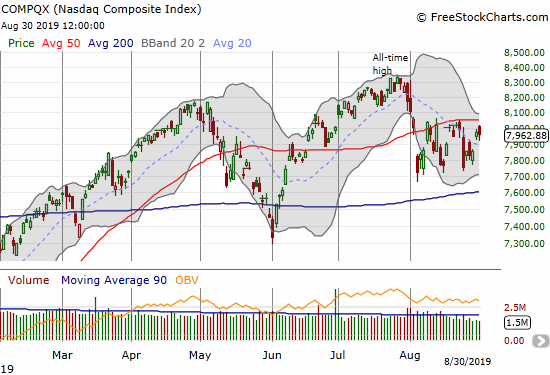
The NASDAQ (COMPQX) also faded from its intraday high but did not quite challenge overhead 50DMA resistance.
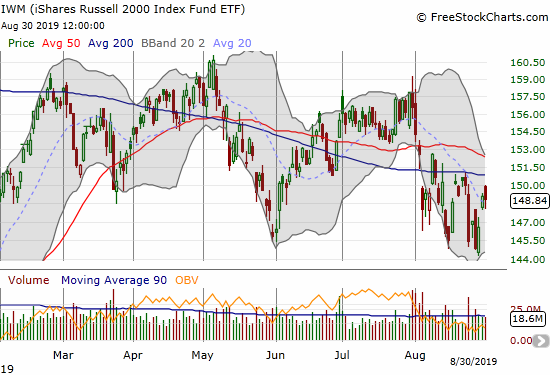
The iShares Russell 2000 Index Fund ETF (IWM) made the most dramatic turnaround as it reversed course from setting a 7-month low. Still, with a declining 50 AND 200DMA serving as overhead resistance, this small-cap index remains in the trouble zone.
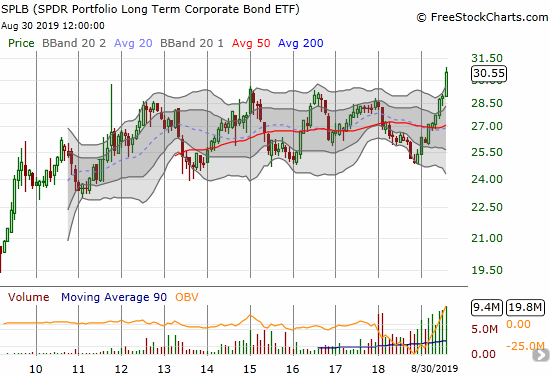
Investors are clearly very confident in the long-term health of U.S. corporates. The SPDR Portfolio Long Term Corporate Bond (SPLB) used the month of August to breakout from a post-recession trading range to make all-time highs. SPLB still pays a juicy yield of 4.0% so there must be some yield-chasing here. SPY pays 1.8%.
The volatility index (VIX) ended the week with a strong gain as a reminder that traders are still on edge.
AT40 (T2108), the percentage of stocks trading above their respective 40DMAs, returned to mirroring the churn and chop of the S&P 500. At 38.3%, my favorite technical indicator returned to the top of the recent range. There is no more bullish or bearish divergence – just a wait to see which way traders and investors want to break through the current logjam.
A Rorschach Test
The technical setup in the S&P 500 (SPY) has become a very obvious pattern with churn between 200DMA support and 50DMA resistance (poor execution not withstanding). A breakout or a breakdown should produce a sustained move in the direction of the break. The contest may come down to a matter of attrition or exhaustion: will buyers or sellers give up first?
Such an obvious technical pattern can still attract a multitude of interpretations that could reflect the inherent biases of the observer. I was fascinated by three differing assessments on the S&P 500 at this juncture.
True to form, CNBC’s Jim Cramer leads the bullish case. Cramer used the work of a technician named “William.” On Wednesday he presented the technical case for a major September rally based on an advance/decline oscillator, a projection of the VIX, and pattern-matching with the S&P 500 e-minis. The regularity of the buy/sell pattern in the oscillator is eye-popping. The VIX forecast is a bit on the edge as my eyes tell me the next surge in the VIX is yet to come not already passed.
Charts show investors should be ready for a big September market rally from CNBC.
The trendless case, aka be bullish but cautious, comes from MKM Partner’s J.C. O’Hara. On Bloomberg, O’Hara latched on to the obvious resistance and support levels on the S&P 500 to identify a “death zone” where risks are increasing. He wants to stay bullish as long as the S&P 500 holds 200DMA support; this is of course the obvious choice given the meaning of 200DMA support.
Interestingly, money managers have rushed the exits for money market funds at a rate last seen during the financial crisis. That action could be a sign of a peak in fear…or another red flag of what is to come. Distinguishing between the two interpretations is not easy because the exit of money could starve the stock market of fuel AND/OR it could set up the next surge when that money floods back into the market to chase some positive catalyst like an upside surprise from the Fed or some truly good news from the front of the Trade War.
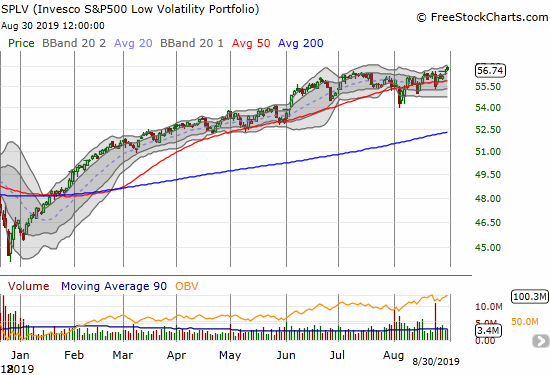
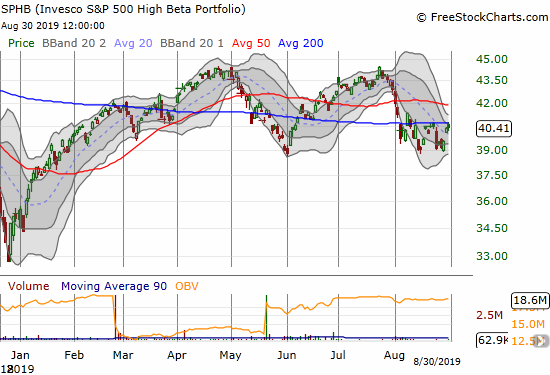
O’Hara closed out his discussion with an interesting presentation of the recent out-performance of a risk-neutral investment that goes long low beta stocks and short high beta stocks. I approximated this view with the Invesco S&P 500 Low Volatility Portfolio (SPLV), up a healthy 21.6% year-to-date, versus the Invesco S&P 500 High Beta Portfolio (SPHB), up 14.5% year-to-date. SPLV ended August with a breakout to a new all-time high.
CNBC resident technician Carter Worth rounds out the Rorschach test with the bearish case. Carter sees a September sell-off ahead. He used the S&P 500’s obvious trading range to estimate the extent of the sell-off back to the June low…and below.
Bracing for more drawdowns
After my trigger finger exit from my last core trade, I will be keen to execute and enforce more discipline in my trades. With the China versus U.S. Trade War weighing more and more heavily on the global economy, the fundamental bias is to the downside. The seasonal drag of August to October also implies that traders will grease the skids of bad news. Yet this downside bias also contains the catalyst for sharp upward rallies if peace and good news break out. Chasing moves could get particularly treacherous, so I will be looking to AT40 to flag tradeable extremes. The obvious trading range on the S&P 500 should provide good context…but its obviousness makes me ponder what big surprises are ahead (like a big fakeout breakout or a plunge into a false breakdown..
An Extreme in the U.S. Dollar
When President Trump complained on Friday about a U.S. dollar at an all-time high, I thought he was writhing in more hyperbole. The U.S. dollar index after all is not even above its 2016/2017 high.
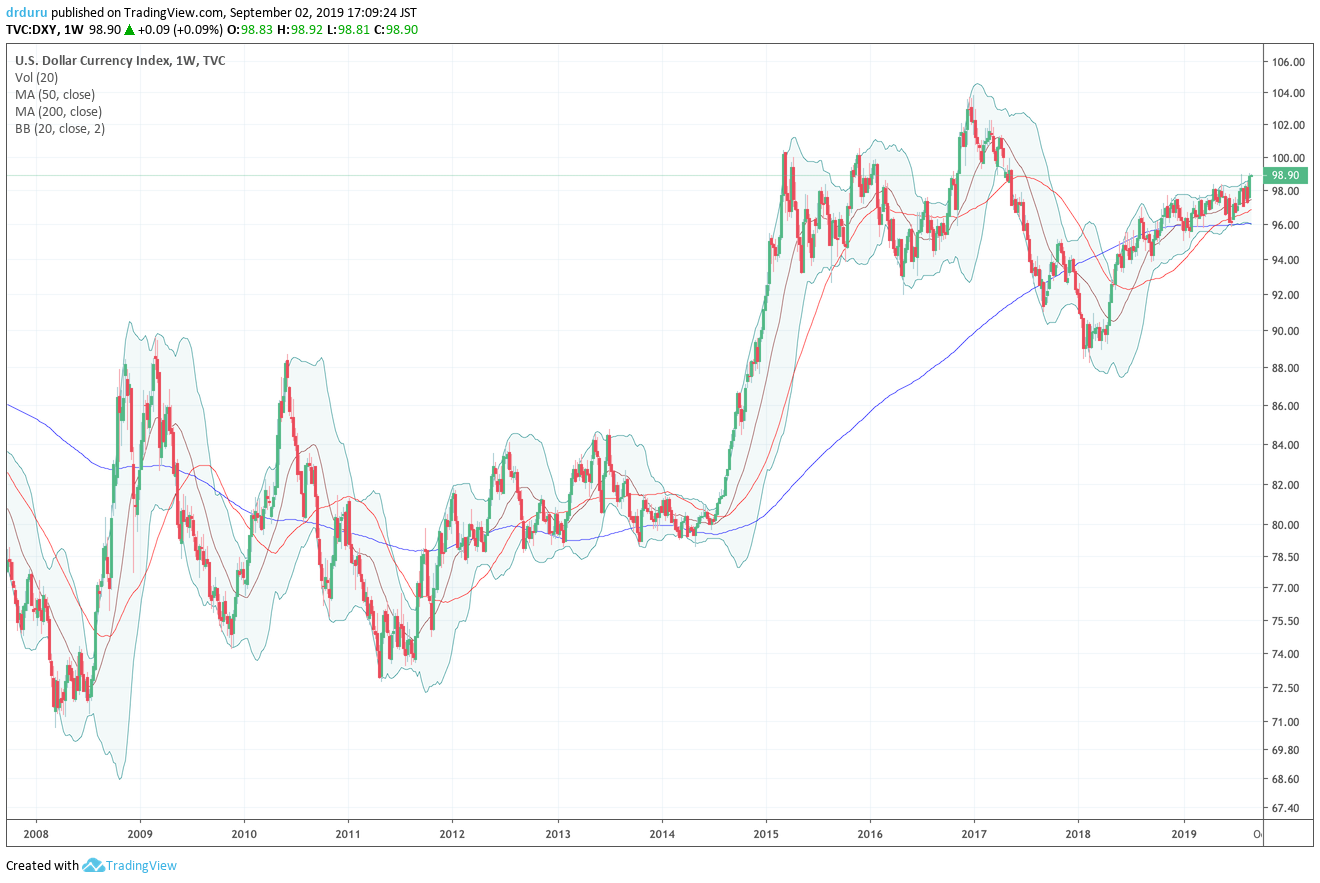
Source: TradingView.com
But then I thought to look at broader measures of the dollar’s value. The U.S. dollar index is dominated by the euro (51%) and includes just a few additional currencies. ONE measure of the dollars value did just crack an all-time high as of the end of August: Trade Weighted U.S. Dollar Index: Broad, Goods. The daily data are updated through August 23rd and the monthly data through the July, so I have to post both charts to show the lofty heights of the dollar by this one measure.
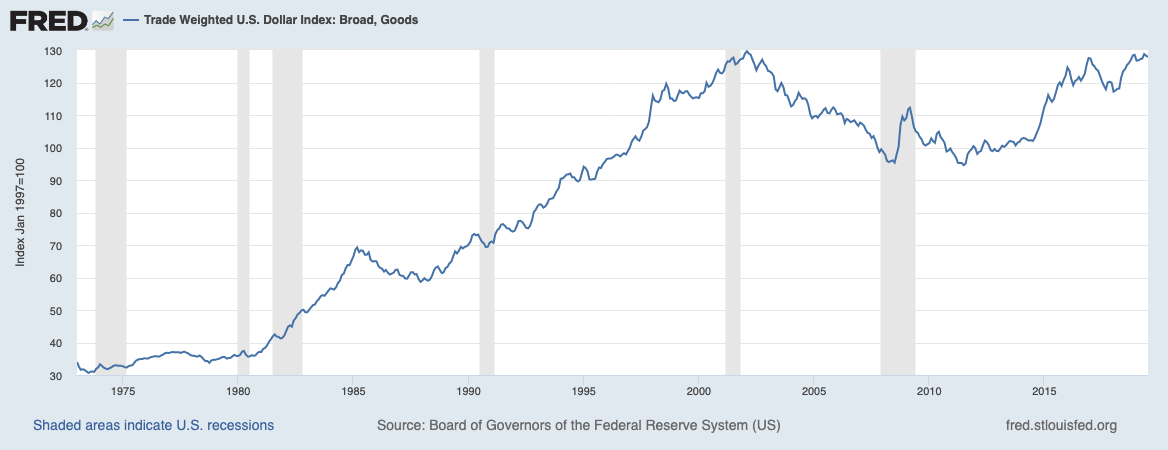
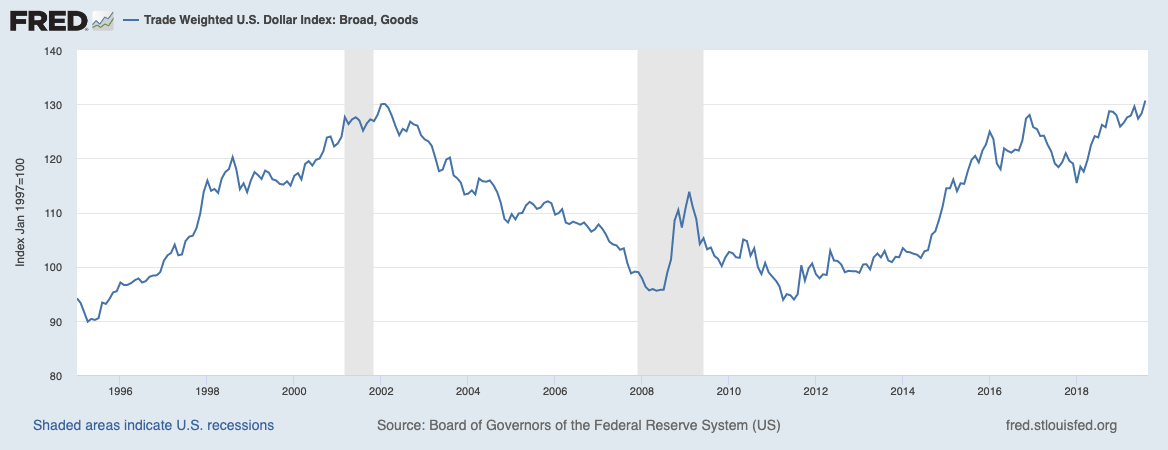
Source for charts: Board of Governors of the Federal Reserve System (US), Trade Weighted U.S. Dollar Index: Broad, Goods [TWEXBMTH], retrieved from FRED, Federal Reserve Bank of St. Louis, August 30, 2019.
These views make the dollar’s extreme strength crystal clear and gives me better perspective on the claims of companies which cite strength in the dollar as drags on their international results. Obviously the dollar’s strength in the 1990s was associated with America’s booming economy at the time, so it is not at all clear that this latest show of strength is a bad outcome. However, I think it makes sense to watch as pressure builds from the Trump administration to bring the dollar’s value down for gaining advantages in international trade.
Stock Chart Reviews – Bearish
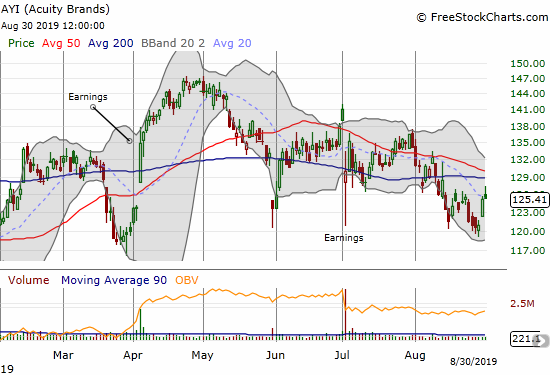
Acuity Brands (AYI)
Acuity Brands (AYI) cannot break through its declining 50DMA and in August sustained a 200DMA breakdown. With a focus on industrial lighting, AYI can be an indicator on the health of commercial real estate…
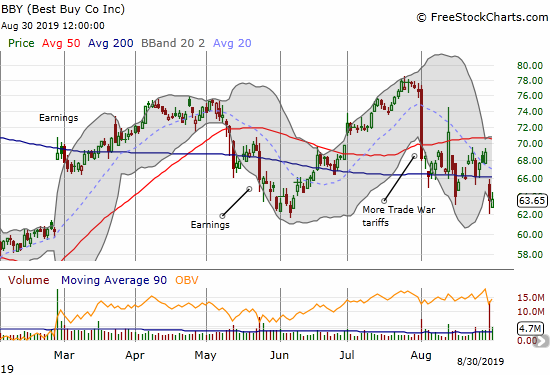
Best Buy (BBY)
Best Buy (BBY) sold off post-earnings for a fresh 200DMA breakdown. The company joined a chorus of retailers complaining about the latest round of tariffs on Chinese imports. My initial foray into BBY as a trade war pairs trade worked initially. Now I have uncoupled BBY from my put spread position on iShares MSCI Emerging Markets ETF (EEM). I think of BBY as a stock that will go to its own extremes. So I bought a hedged trade of Oct $67.50 calls versus a Nov/Dec $57.50 calendar put spread. My expectation is that I may profit on BOTH sides of this trade as BBY first drifts downward toward $57.50 before rebounding in a relief rally by October. If the relief rally starts right away, I will be looking to sell the call options around 50DMA resistance.
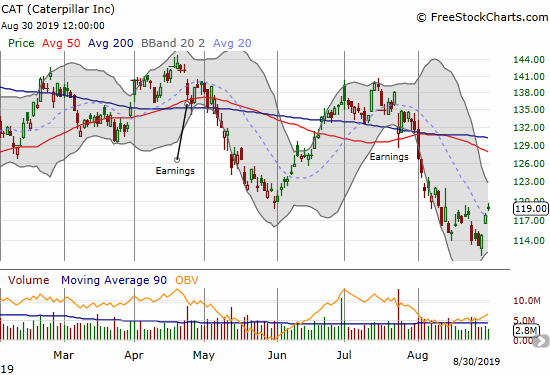
Caterpillar (CAT)
I had a chance to take profits on my Sep $115/$100 put spread but decided to keep holding. The stock rebounded sharply from the intraday low on Wednesday. Given the extreme in the U.S. dollar, I am wondering whether the market is starting to bet that the odds are high for a dollar pullback which in turn helps international industrial companies like CAT.
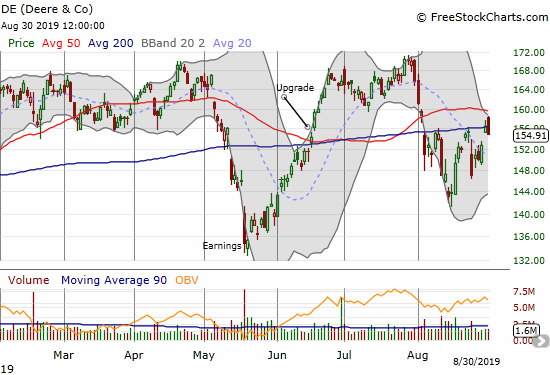
Deere & Co. (DE)
The resilience continues for Deere & Co. (DE). The previous week’s plunge is starting to look like another flush of sellers given the stock gapped up the very next day and has yet to look back. I will stay in my put spread as a hedge against bullishness.
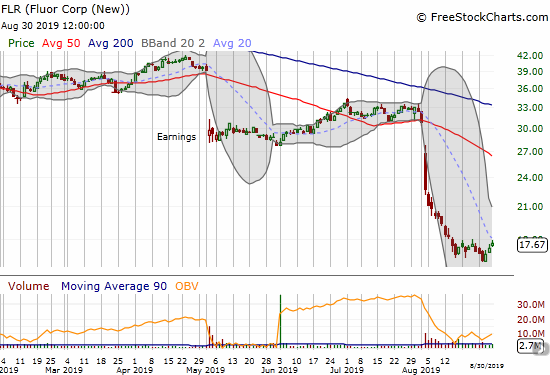
Fluor (FLR)
For a brief moment I held a profit in my stubborn Fluor (FLR) position. The post-earnings plunge in August took care of that relief. The on-going collapse in FLR continues to astound me, and I cannot help thinking that several years from now these prices will look like obvious bargains. Otherwise, I am betting on a company that is heading into some kind of complete economic/business calamity.
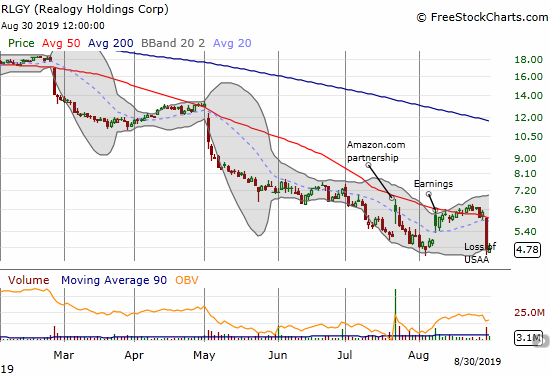
Realogy (RLGY)
It is telling that Realogy (RLGY) chose not to post its latest bad news on its website. I had to go to an SEC 8K filing to get the dirty details (emphasis mine):
“The Cartus program, expected to become effective on September 7, 2019, will seek to provide access to benefits similar to those offered under the USAA Real Estate Rewards Network program, an affinity program between Cartus and the United Services Automobile Association (“USAA”). USAA is discontinuing the USAA Real Estate Rewards Network in order to shift focus to its core mortgage, banking and insurance businesses at this time.”
Realogy started the 8K filing announcing the launch of Cartus, but the real news was USAA ending its relationship with RLGY. The stock lost 22.8% that day. Shortly after the 50DMA breakdown, and a 10%+ loss, I dumped my recent speculative trade in RLGY. It was a case where a quick and speedy exit saved a lot of money. I will NOT buy this stock ever again without an exceptionally compelling reason. I would have done well to stick to my original skepticism about this company.
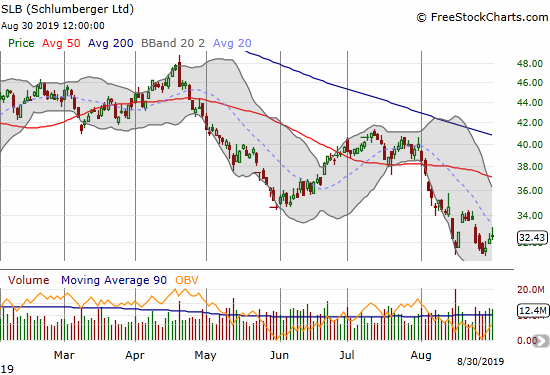
Schlumberger (SLB)
Schlumberger (SLB) is another infrastructure company whose performance is astounding me. SLB may have made a double-bottom in August but a near 15-year low makes me doubt the bottom will ultimately hold.
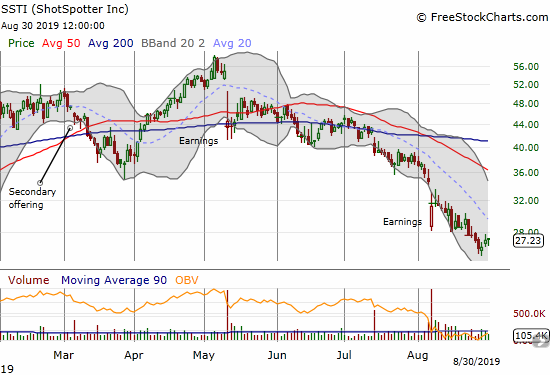
ShotSpotter (SSTI)
ShotSpotter (SSTI) continues to disappoint. The stock is back to its December, 2018 low. All I can do at this point is just keep on waiting. I took some profits after buying the December low, so I am getting ready to buy fresh SSTI shares at these levels. I am long overdue a write-up on SSTI earnings…
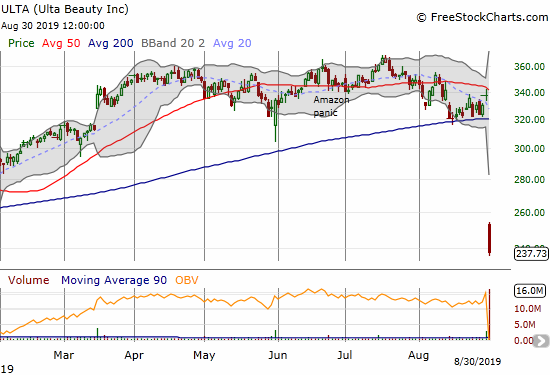
Ulta Beauty (ULTA)
When expensive, high-flying, cult-like stocks fall, they really fall. Ulta Beauty (ULTA) is the rare case of a stock that ended up a big loser after an Amazon panic. In this case, the catalyst was a poorly received earnings report. ULTA is so over-extended to the downside below its lower Bollinger Band (BB) that a relief rally of some kind is nearly a lock, but I would look to fade a rally.
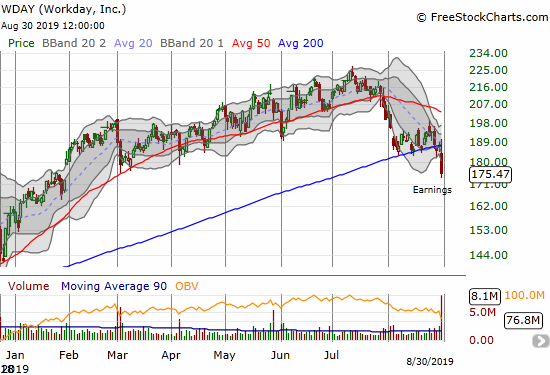
Workday (WDAY)
I did not even notice the breakdown in Workday (WDAY) until well after the close. The stock opened with a small loss and then bounced to a small gain. I was surprised by the initially tepid response to earnings, and I moved on. WDAY looks like a shortable stock from here on up to 200DMA resistance. The stock looks like it is rolling over.
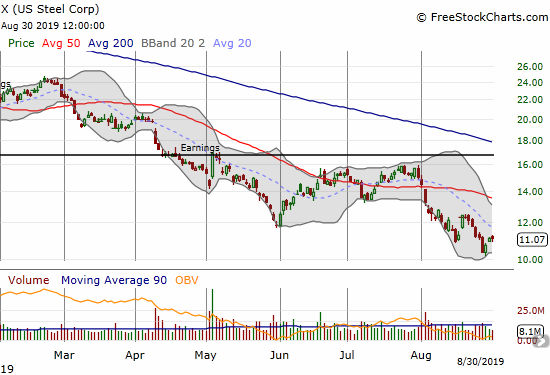
U.S. Steel (X)
U.S. Steel (X) is looking like a post-policy tragedy rather than a winner. The stock last traded this low back in March, 2016. It traded as high as $46 or so in early 2018.
Stock Chart Reviews – Bullish
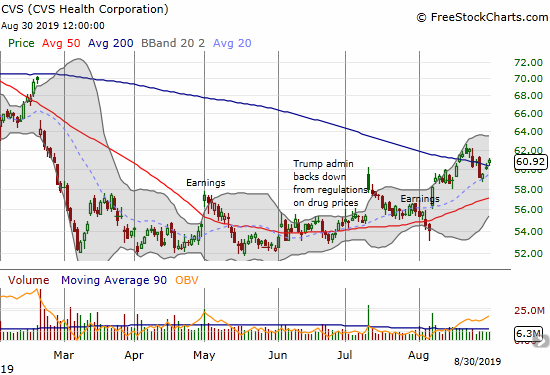
CVS Health Corporation (CVS)
CVS Health Corporation (CVS) is at the top of my buy list in the coming week. CVS looks like it is ready to confirm a 200DMA breakout. The stop-loss point is easy and just below last week’s intraday low.
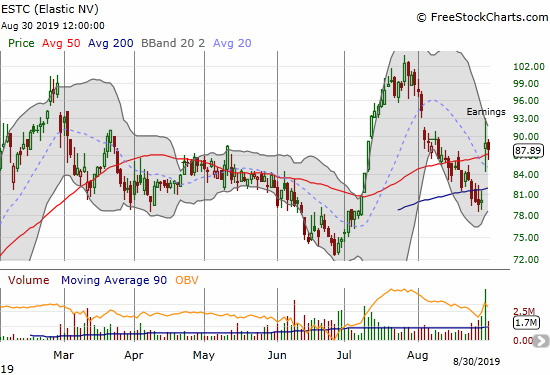
Elastic (ESTC)
Elastic (ESTC) gapped over 50DMA resistance post-earnings but failed to make much progress from there. I am looking to buy ESTC here with a stop below the intraday post-earnings low.
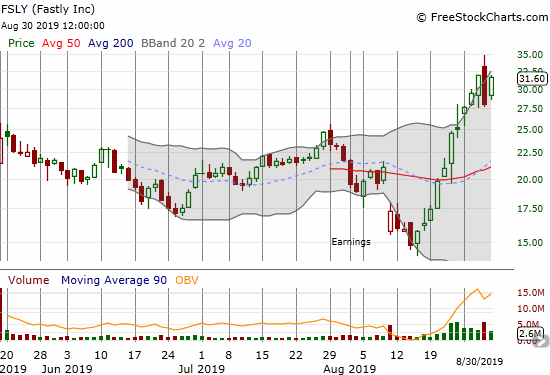
Fastly (FSLY)
All I can do is watch Fastly (FSLY) at this point. The run-up continued nearly unabated last week. A potential bearish engulfing top flared up on Thursday. Buyers stepped right back in on Friday and almost printed a new closing all-time high.
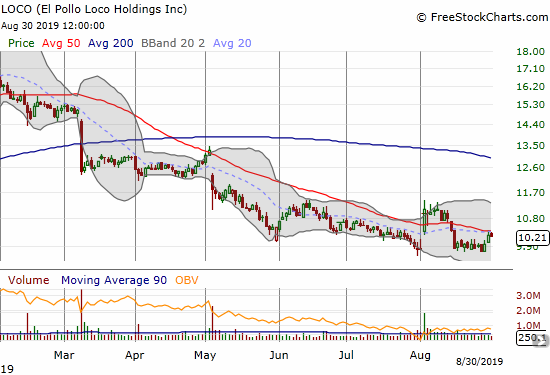
El Pollo Loco (LOCO)
I still watch El Pollo Loco (LOCO) as the “last chicken standing” from a competition between it and Popeyes Louisiana Chicken to garner the favor of acquirer Restaurant Brands International (QSR). The recent craze over Popeyes’s chicken sandwich reminded to check in on LOCO. I was quite surprised to see how “cheap” LOCO is now.
I am going out on a bit of a limb calling El Pollo Loco (LOCO) bullish. The stock is down 32.6% for the year. LOCO is also trading well below its 200DMA and continues to struggle to trade above its 50DMA. After a nice post-earnings pop and 50DMA breakout in early August, sellers went right back to work and fully reversed the post-earnings gains. Still, LOCO held its low for the year as support. This is important because the stock set its all-time low back in early 2018 around $9.20. So I like the stock as a buy with a tight stop below the 2019 low or definitely below the all-time low. Note that shorts are all over LOCO at 21.2% of the float (according to Yahoo Finance).
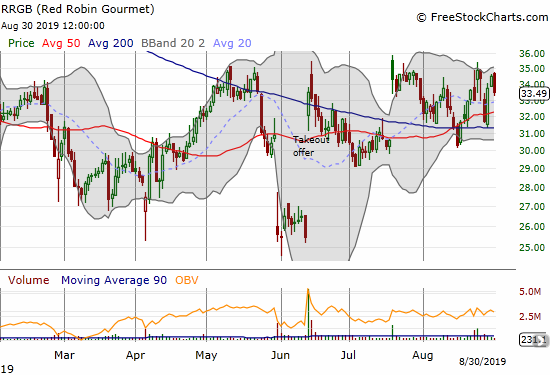
Red Robin Gourmet (RRGB)
Both analyst chatter and earnings have failed to break Red Robin Gourmet (RRGB) away from its recent churn above 50 and 200DMA support. I am still holding shares in anticipation of a positive and upside resolution to the takeout offer extended to RRGB in June.
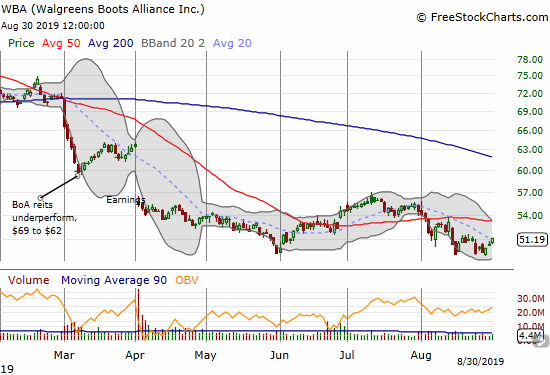
Walgreens Boots Alliance (WBA)
Walgreens Boots Alliance (WBA) barely qualifies as bullish anymore. I might as well as have stuck to my longer-standing bearish posture on the stock and the company. WBA held its June and 5-year low with a double challenge in August. This lagging performance validates my concern about trying the CNBC Options Action trade which included selling a put (a risk reversal trade).
— – —
FOLLOW Dr. Duru’s commentary on financial markets via email, StockTwits, Twitter, and even Instagram!
“Above the 40” uses the percentage of stocks trading above their respective 40-day moving averages (DMAs) to assess the technical health of the stock market and to identify extremes in market sentiment that are likely to reverse. Abbreviated as AT40, Above the 40 is an alternative label for “T2108” which was created by Worden. Learn more about T2108 on my T2108 Resource Page. AT200, or T2107, measures the percentage of stocks trading above their respective 200DMAs.
Active AT40 (T2108) periods: Day #165 over 20%, Day #4 over 30% (overperiod), Day #16 under 40%, Day #23 under 50%, Day #32 under 60%, Day #122 under 70%
Daily AT40 (T2108)
")
Black line: AT40 (T2108) (% measured on the right)
Red line: Overbought threshold (70%); Blue line: Oversold threshold (20%)
Weekly AT40 (T2108)

*All charts created using FreeStockCharts unless otherwise stated
The T2108 charts above are my LATEST updates independent of the date of this given AT40 post. For my latest AT40 post click here.
Be careful out there!
Full disclosure: long VIXY calls, long RRGB, long DE put spread, long CAT put spread and puts, long SSTI, long EEM put spread, net long the U.S. dollar, long BBY calendar put spread and calls, long WBA calls
*Charting notes: FreeStockCharts stock prices are not adjusted for dividends. TradingView.com charts for currencies use Tokyo time as the start of the forex trading day. FreeStockCharts currency charts are based on Eastern U.S. time to define the trading day.