
Housing Market Intro/Summary
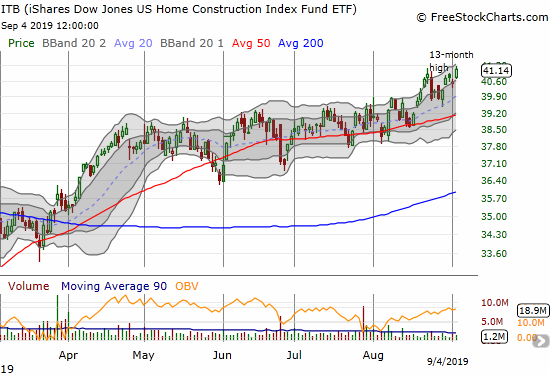
In the last Housing Market Review, I discussed my slow and reluctant acceptance of a stock market that was effectively front-running the seasonally strong period for the stocks of home builders (starting in October/November). I also showed the near consistent dichotomy between builders excelling at selling lower-priced homes to buyers trying to find affordability in the market and builders with broader and less concentrated portfolios. I have deep dives on the earnings reports of these builders to examine the sustainability of these dynamics. The strong performance of home builders was really on display in August when the iShares Dow Jones Home Construction ETF (ITB) ended with a gain and more home builders broke out to new highs even as the stock market struggled.
Despite this performance, I cannot shake an overall wariness that the bulk of these gains are coming from front-loading what would have been gains from the last 2 or 3 months of the year. The housing data are chugging along but are still inconsistent enough to feed my wariness. The big drop in consumer sentiment (confidence) in August gave me a fresh reason for caution.
New Residential Construction (Single-Family Housing Starts) – July, 2019
After a sudden burst of activity to start the year, housing starts have cooled.
Single-family housing starts for June were revised upward from 847,000 to 865,000. July starts increased month-over-month by 1.8% to 876,000. On an annual basis, single-family housing starts increased by 1.9%. This level of activity is still behind what I would expect given the on-going optimism of home builders. The line of support in 2019 for starts still sits at 800,000.
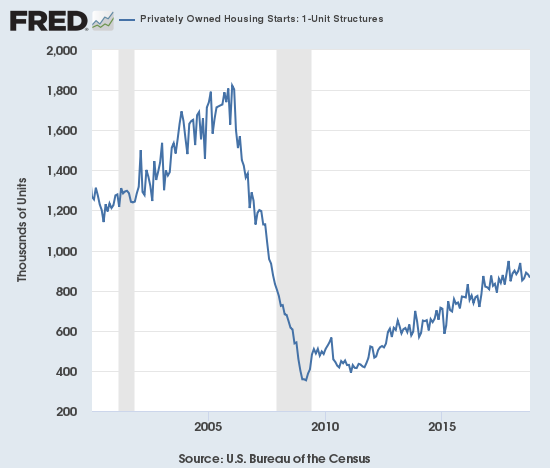
Source: US. Bureau of the Census, Privately Owned Housing Starts: 1-Unit Structures [HOUST1F], retrieved from FRED, Federal Reserve Bank of St. Louis, August 18, 2019.
The West’s on-going declines in starts took a brief break in April and resumed in May along with all other regions. July turned in a better showing. For July, the regions were split with the Northeast as a big loser for the third month in a row. The Northeast, Midwest, South, and West each changed -10.6%, -6.7%, +1.3%, and +12.9% respectively. I continue to expect fresh weakness in new home sales later in the year although the sudden jump for starts in the West provides a “green shoot” for optimism.
Existing Home Sales – July, 2019
The 16-month streak of year-over-year declines for existing home sales came to an end, just barely, in July. While July’s gains do not end what I think is the salient feature of an overall downtrend, I will become convinced once/if existing home sales jump over the highs of 2019 set in February.
The seasonally adjusted annualized sales in July of 5.42M were up 2.5% month-over-month from the marginally upwardly revised 5.29M in sales for June. Year-over-year sales nudged higher by 0.6%. Continue to note that January’s 4.93M in sales were the lowest since November, 2015.

(As of the March, 2018 data, the NAR further reduced historical data to just 13 months. For historical data from 1999 to 2014, click here. For historical data from 2014 to 2018, click here) Source for chart: National Association of Realtors, Existing Home Sales© [EXHOSLUSM495S], retrieved from FRED, Federal Reserve Bank of St. Louis, September 2, 2019.
The National Association of Realtors (NAR) celebrated May sales as delivering the numbers it “expected.” For June, the NAR admitted to a bit of astonishment (or bewilderment?) at the current market dynamics. Although sales finally broke the 16-month losing streak, I am guessing the margin was not nearly enough to garner focus for the July report. Instead, the NAR chose to once again raise an alarm bell on poor affordability metrics. The NAR divided the market in half and delivered a startling statistic (emphasis mine):
“Of the same homes that were sold in 2018 that were purchased in 2012 in 13 large metro areas (repeat sales transactions), the lower half of the market had increased by more than 100% in 2018 in metro areas like Atlanta-Sandy-Springs-Roswell, Ga. (165%), Denver-Aurora-Lakewood, Colo. (103%), Miami-Fort-Lauderdale, Fla. (119%) and Tampa-St. Petersburg-Clearwater, Fla. (125%). The median home price for homes purchased in the upper half of the market in these same metro areas in 2012 increased at a much slower pace when sold in 2018.”
I wish the NAR had posted specific numbers on the upper half, but the doubling in price over 6 years easily explains why buyers surprised industry insiders with their extreme sensitivity to the level of mortgage rates. The slight increase in demand for existing home sales is already coming at a high price as existing home prices are generally hurtling ever higher.
The median price of an existing home hit $280,800, a jump of 4.3% and the 89th straight year-over-year gain. Recall that in March, price growth increased to a year-over-year gain of 3.8%, which included the largest nominal increase for a March in history. This relentless climb has not changed much whether inventories happen to drop or gain in any given month.
Absolute inventory levels of 1.89M homes declined 1.6% from the 1.92M homes for sale in both June of 2019 and 2018. Based on months of supply, inventory also declined: “Unsold inventory is at a 4.2-month supply at the current sales pace, down from the 4.4 month-supply recorded in June and down from the 4.3-month supply recorded in July of 2018.” The NAR lamented the “inadequate” inventory of “moderately priced homes.” The (relative) scramble for lower-priced homes confirms the well-known affordability issues in the market. A downshift in price tiers is one of the last options available to households who are struggling to figure out how to become home owners.
After impressive year-over-year share gains in March and June, July’s share of first-time home buyers fell back to 32% from June’s 35%. This share was flat year-over-year. I expected a much better showing given the consistent message from home builders that entry-level homes are out-performing other home sales. The average share for first-time homebuyers for 2016 was 35%. The NAR’s 2017 Profile of Home Buyers and Sellers reported an average of 34% for 2017 and 33% for 2018.
Investors purchased 11% of homes in July, up from June’s lowly 10%. Investors purchased 12% of homes a year ago. Investor sales averaged a share of 15% in 2017 and 14% in 2016. The NAR has yet to release the average for 2018.
February just barely ended a 4-month streak of annual sales declines across all four regions. The broad-based declines resumed in March and continued in April. In May, only the South managed a year-over-year increase. In June, all regions declined again. July’s results were mixed with the West suffering its 13th consecutive month with a year-over-year decline (despite an 8.3% jump from June’s sales trough). Here are the regional changes: Northeast -4.3%, Midwest +0.8%, South +2.7%, West -0.8%.
The regional year-over-year changes in median prices finally delivered a surprise. The Northeast stood out as suffering an actual decline while the other regions experienced price jumps even greater than June’s robust results: Northeast -1.0%, Midwest 8.1%, South 5.2%, West 3.7%.
Single-family sales increased 2.8% from June and increased on a yearly basis by 1.0%. The median price of $284,000 was up a healthy 4.5% year-over-year, the same as June’s 4.5% year-over-year gain (May featured a 4.6% annual increase).
California Existing Home Sales – July, 2019
The California Association of Realtors (CAR) reported sales of existing Californian homes at a 10-year low in January. February’s month-over-month surge of 11.8% was enough for a 6-month high; the gain was also the largest monthly gain since January, 2011. July sales were the highest in 15 months and the 1.1% year-over-year gain ended a 14-month losing streak and of course outpaced the West which overall decline year-over-year.
Unlike June when sales declines were stark and region-wide, July delivered sales gains in all regions except the San Francisco Bay Area (just a 0.6% year-over-year decline). A 2.7% drop in active listings ended a 15-month streak of year-over-year declines; this data point also signaled a small respite from the on-going sales declines in California.
February’s median price was the lowest in 12 months. Poor sales numbers did not prevent June’s median price from hitting a new record for the third month in a row. The median price declined slightly in July by 0.4% to $607,990, a 2.8% year-over-year gain. Like the NAR, the CAR lamented the affordability issues caused by the high prices. CAR gave a lot of credit to falling mortgage rates for propping up sales in California.
New Residential Sales (Single-Family) – July 2019
The Census Bureau further revised May sales of new single-family homes downward from 604,000 to 602,000. May’s successive revisions exaggerated the gains for June, but June’s astonishing upward revision from 646,000 to 728,000 produced an even larger impact. Altogether, June produced a 20.9% sequential gain and a 17.8% year-over-year surge. This gain was the first in the double digits since the 17.1% year-over-year jump in December, 2017. Suddenly new home sales hit a new post-recession high in June and look a lot more consistent with the bullish reports from so many home builders. July cooled off from June’s torrid pace to the tune of a 12.8% decline, but July sales were still up 4.3% year-over-year. I am now on alert for the pull-forward effect I have claimed is helping new home sales stay so robust even as existing home sales perform so tepidly.
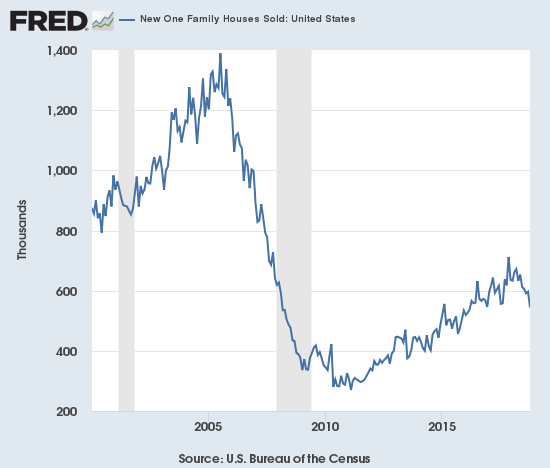
Source: US. Bureau of the Census, New One Family Houses Sold: United States [HSN1F], retrieved from FRED, Federal Reserve Bank of St. Louis, September 2, 2019.
The story from the median sales price is volatile; I strongly suspect regional and economic shifts are at work. Last November, the median sales price hit a near 2-year low. By April of this year, the median price stopped just short of the last peak in March, 2018. With the Spring selling season coming to a close, the June median sales price dropped close to last November’s level: $310,400 vs $308,500. July’s median price increased sequentially to $312,800, a 4.5% year-over-year drop. This price performance remains consistent with reports from home builders that lower-priced homes are selling better than higher-priced ones.
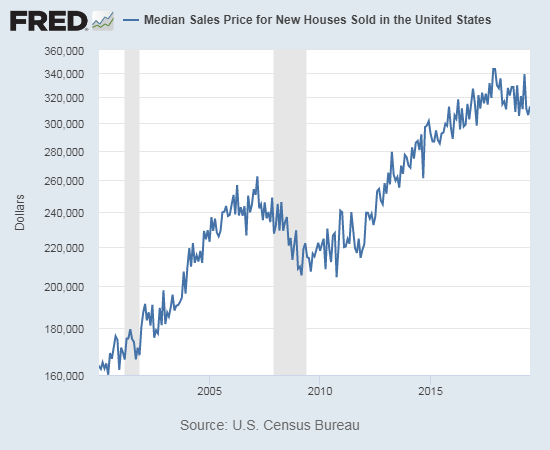
Source: U.S. Census Bureau and U.S. Department of Housing and Urban Development, Median Sales Price for New Houses Sold in the United States [MSPNHSUS], retrieved from FRED, Federal Reserve Bank of St. Louis; September 2, 2019
Ever since the inventory of new homes for sale jumped to 6.0 months of sales in June, 2018, inventory has pivoted around the 6.0 level. June’s inventory sat at 6.3 days of sales. July increased ever so slightly to 6.4.
The Northeast numbers have suddenly become extremely volatile. After a 43.5% drop in June (revised), sales soared 56.0% year-over-year in July. This surge brought a sudden and abrupt end to persistent declines in the region. In the last Housing Market Review I guessed June’s large drop could represent a bottom in the rate of decline, but I certainly could not have expected July’s kind of rebound. The Midwest fell double digits again, this time 18.8%. The South gained 3.2%. The West increased a healthy 8.2%.
Home Builder Confidence: The Housing Market Index – August, 2019
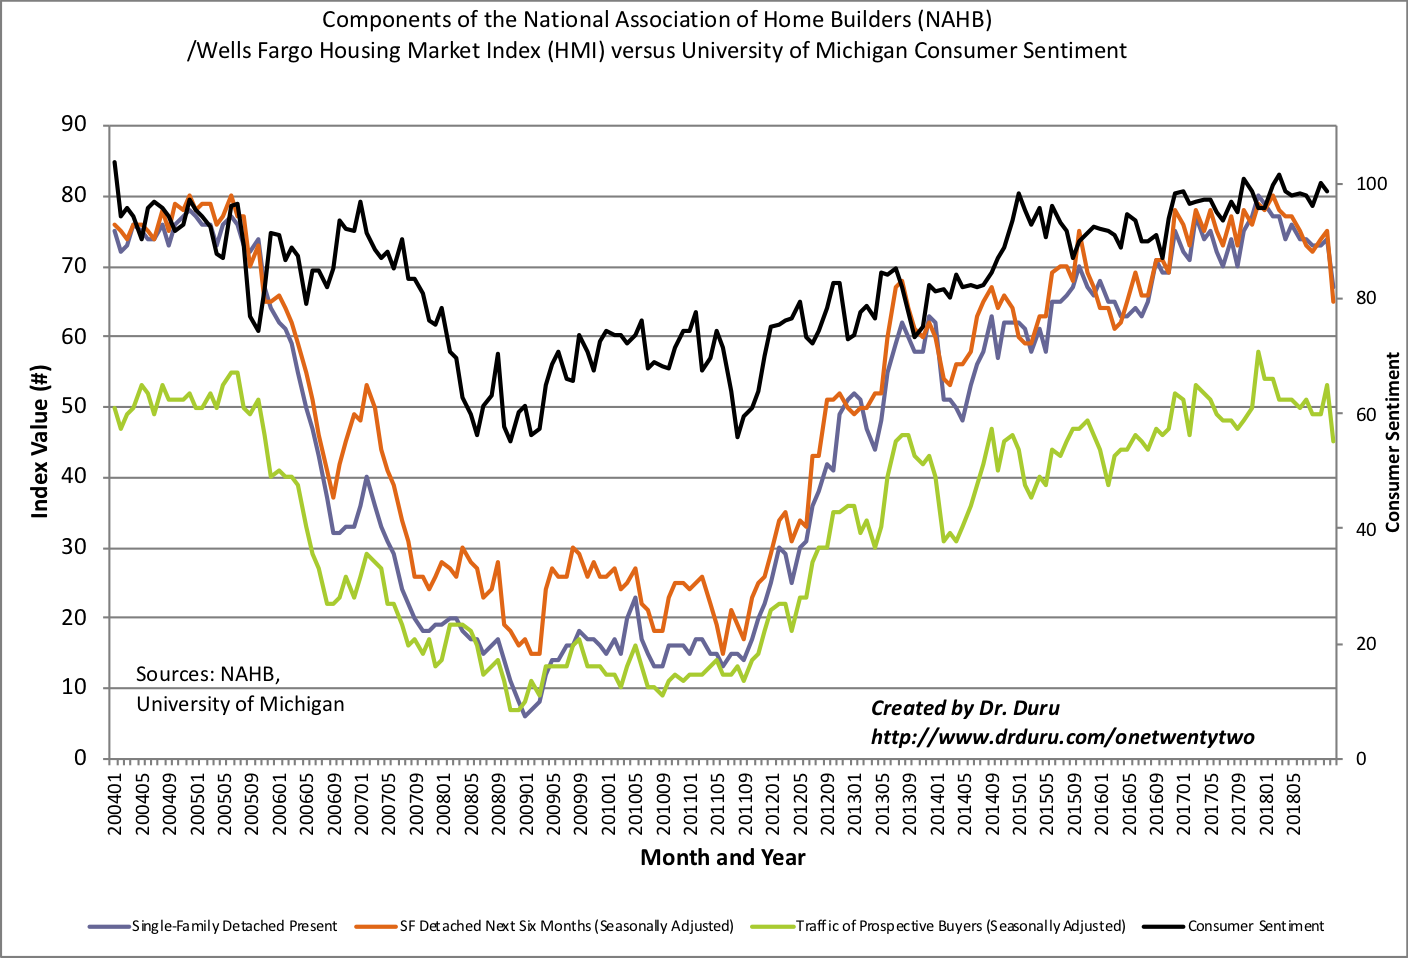
The Housing Market Index (HMI) has drifted along for much of the year. Yet, the National Association of Home Builders (NAHB) declared that the HMI is “trending higher” in the title of its news release. Ironically, the content of the press release does not speak to an upward trend. Instead, the NAHB noted “sentiment levels have held at a solid 64-to-66 level for the past four months.”
The high of this year was set in May at 66, still 8 points down from the post-recession high set on December, 2017. The August HMI gained 1 point from July to get back to 66. In the May Housing Market Review, I concluded that given HMI stalled at 68 after the 2018 Spring selling season, I did not expect any further gains for 2019. The current drift is challenging that notion but a plunge in consumer confidence will likely transmit into pressure on home builder confidence in due time. Most telling was a NAHB warning that thr favorable interest rate environment is not boosting construction as much as it should because of the on-going Trade War – I have repeated this while marveling at the out-performance of home builder stocks during a period of typical seasonal weakness.
“While 30-year mortgage rates have dropped from 4.1 percent down to 3.6 percent during the past four months, we have not seen an equivalent higher pace of building activity because the rate declines occurred due to economic uncertainty stemming largely from growing trade concerns.”
Source: NAHB
The NAHB also confirmed the market dynamic many home builders have described in their earnings reports: “Although affordability headwinds remain a challenge, demand is good and growing at lower price points and for smaller homes.”
The regional results were strong. Only the South failed to make progress from July’s regional HMI. The Northeast nudged up 2 points. The Midwest surged 5 points. The South was flat and the West nudged up another point to a new 13-month high after jumping 5 points in July (revised).
Parting thoughts
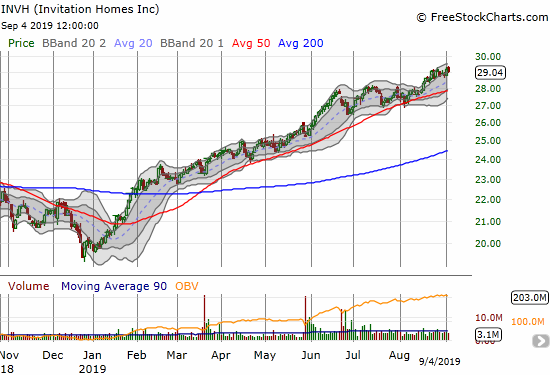
I have not mentioned Invitation Homes (INVH) in a long time. INVH is up an astounding 44.6% year-to-date to an all-time high as one of the best plays on a housing market with challenging affordability characteristics. INVH invests in and runs rental housing.
On the flip side, my attempt to invest in Californian housing through Five Point Holdings (FPH) continues to flounder. FPH sits just above its all-time lows. I am watching very carefully how a near year-long trading range gets resolved…to the upside or to the downside. I am also due to take a deep dive in the company’s earnings results to reassess my original investment thesis.
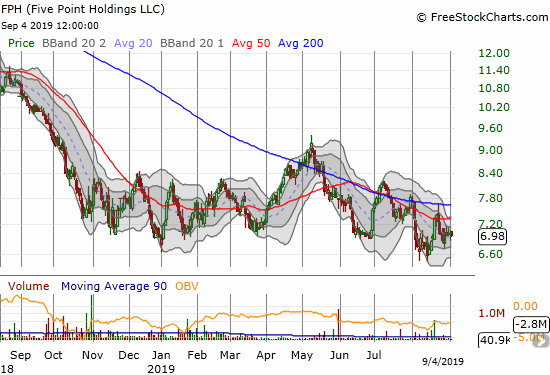
Source: FreeStockCharts
Be careful out there!
Full disclosure: long ITB calendar call spread, long INVH, long FPH