
AT40 = 28.6% of stocks are trading above their respective 40-day moving averages (DMAs)
AT200 = 39.5% of stocks are trading above their respective 200DMAs (2-month low)
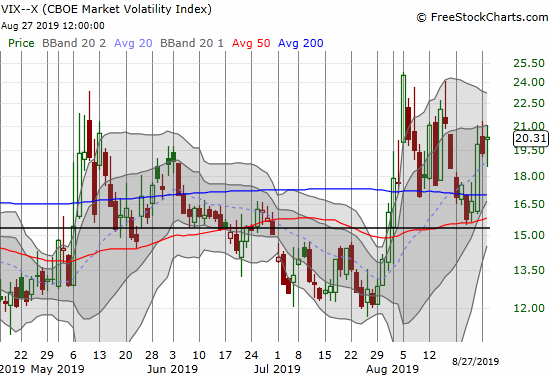
VIX = 20.3
Short-term Trading Call: neutral (from cautiously bullish)
Stock Market Commentary
The 401K stock market’s ugly sandwich just got a bit soggy.
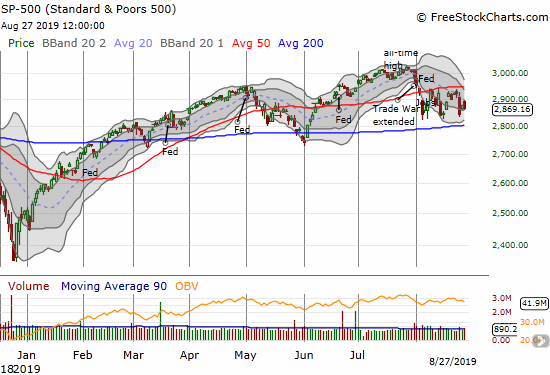
My premise for clinging to a cautiously bullish short-term trading call has depended on an expectation for an imminent breakout for the S&P 500 (SPY). This move above the 50-day moving average (DMA) would then lead to the next marginal all-time high (and next topping pattern). After two subsequent tests of the August extreme and some hints of a bullish divergence, the stock market flipped into hints of bearish divergence.
The Bearish Divergence
The S&P 500 (SPY) only lost 0.3% on the day, but the index faded hard from a 1% gain at the intraday high. The start of the fade forced me to take a loss on my SPY call options as I saw the premium falling fast ahead of the bulk of the index’s pullback.
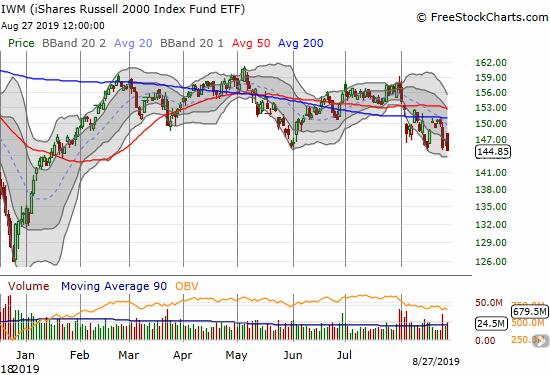
The iShares Russell 2000 Index Fund ETF (IWM) really woke me up as its slow-motion sell-off took another turn for the worse. The index of small-cap stocks under-performed with a notable 1.5% loss and a 7-month low. A retest of the December low is back in play with little to no “natural” support between here and there.
While IWM belies the S&P 500’s surface resilience, my favorite technical indicators demonstrate the hints of bearish divergence best. AT40 (T2108), the percentage of stocks trading above their respective 40DMAs, sank all the way back to 28.6%. AT40 closed just a fraction below the previous low, but this move was enough to send warning bells.
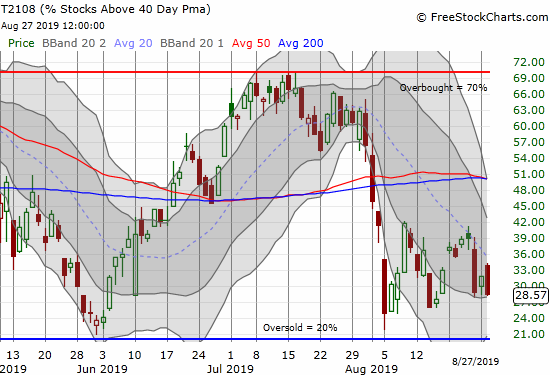
The prior script for August was a hopeful bounce following a pullback to the August extremes. Now, oversold conditions – AT40 below 20% – seem ready to great the end of summer.
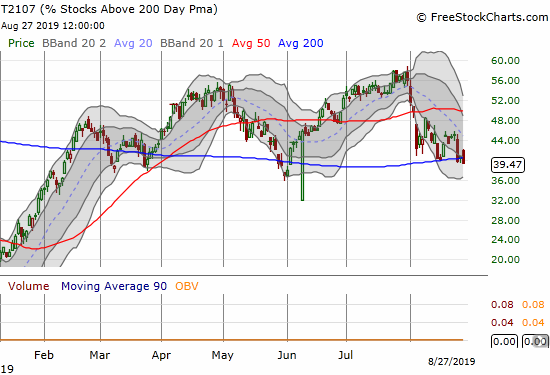
AT200 (T2107), the percentage of stocks trading above their respective 200DMAs, also took a turn for the worse. This longer-term indicator dropped ever closer to the May low and a confirmation of the deteriorating underlying health of the stock market.
Still Residual Resilience?
The volatility index (VIX) still looks very reulctant to respond to the increasing risks in the stock market. Now that I have flipped from cautiously bullish to neutral, I see this behavior less as a sign of bullish resilience and more of a hint that the stock market will not solidly bottom until the VIX is forced above the highs of this latest selling cycle, perhaps WELL above.
Despite my growing wariness, I am not turning bearish on the stock market. I want to stay mentally ready to jump on buying opportunities if (when?) the market sells off into oversold territory. Assuming the August extreme holds this week, I am looking to September, to live up to its reputation as a “dangerous” month with an average maximum drawdown of 2.8% (on a closing basis).
Stock Chart Reviews – Bearish
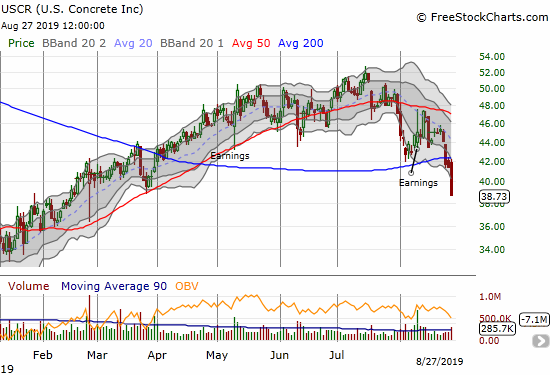
U.S. Concrete (USCR)
In a little over a month, U.S. Concrete (USCR) erased 5 months of hard fought gains. While I am holding my shares as a long-term investment, I fully recognize that today’s 6.9% loss and 200DMA breakdown is a very bearish sign for the stock. This is the kind of bad turn that is signalling more trouble ahead for the general market.
Stock Chart Reviews – Bullish
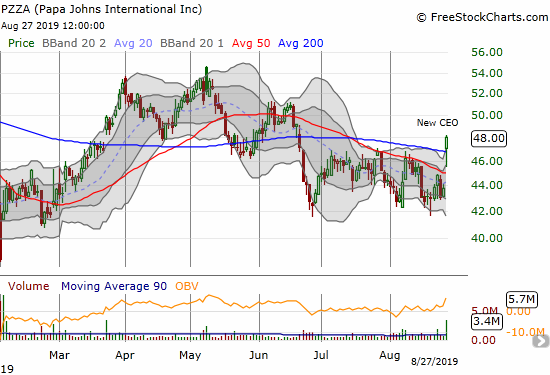
Papa Johns International (PZZA)
Papa Johns International (PZZA) was a sight for sore eyes. The company announced Rob Lynch as its new President and CEO, and the stock responded with a bullish 200DMA breakout. The breakout looks even better with a successful intraday test of 50DMA as support and a close above a 2-month consolidation period. The stock is a buy on the dips up to 200DMA support.
— – —
FOLLOW Dr. Duru’s commentary on financial markets via email, StockTwits, Twitter, and even Instagram!
“Above the 40” uses the percentage of stocks trading above their respective 40-day moving averages (DMAs) to assess the technical health of the stock market and to identify extremes in market sentiment that are likely to reverse. Abbreviated as AT40, Above the 40 is an alternative label for “T2108” which was created by Worden. Learn more about T2108 on my T2108 Resource Page. AT200, or T2107, measures the percentage of stocks trading above their respective 200DMAs.
Active AT40 (T2108) periods: Day #162 over 20%, Day #1 under 30% (underperiod ending 1 day over 30%), Day #13 under 40%, Day #20 under 50%, Day #29 under 60%, Day #119 under 70%
Daily AT40 (T2108)
")
Black line: AT40 (T2108) (% measured on the right)
Red line: Overbought threshold (70%); Blue line: Oversold threshold (20%)
Weekly AT40 (T2108)

*All charts created using FreeStockCharts unless otherwise stated
The T2108 charts above are my LATEST updates independent of the date of this given AT40 post. For my latest AT40 post click here.
Be careful out there!
Full disclosure: long UVXY calls, long USCR
*Charting notes: FreeStockCharts stock prices are not adjusted for dividends. TradingView.com charts for currencies use Tokyo time as the start of the forex trading day. FreeStockCharts currency charts are based on Eastern U.S. time to define the trading day.