
The Short-Term Breakdown
The technical conditions for Tesla (TSLA) have greatly deteriorated since I wrote about short-term and long-term trading strategies on the stock. I focused on two main trading strategies: 1) a longer-term covered call strategy for bullish investors fortunate enough to own 100+ shares of stock and 2) what I considered at the time necessary short-term protection primarily using a calendar put spread. The longer-term strategy was jeopardized by the breakdown below the $250 bottom of the trading range. Last month’s post-earnings end to the relief rally from the June lows confirmed a need for a reset. The close below support at the 50-day moving average (DMA) support underlined the need for a reset.
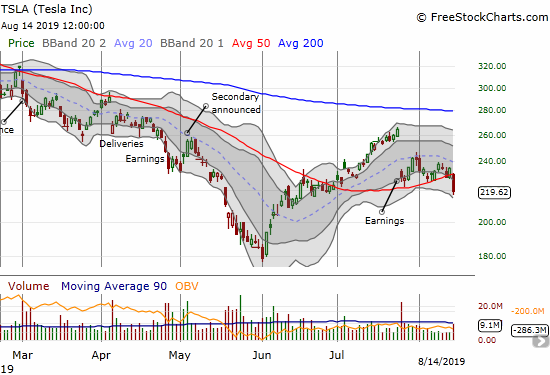
Source: FreeStockCharts
The $250 support level was critical. That support held one last time in April, allowing the short side of the put spread to expire worthless. When the support gave way in May, the remaining long June $250 put generated tremendous profits through the month.
The Longer-Term
If I had zoomed out to re-examine the longer-term, monthly chart, I would have seen the importance of the June 3rd low. That price level lined up perfectly with the lows from November, 2017. Sure enough, TSLA bounced sharply from that level (a rebound in the stock market certainly helped!).
Now given the stock’s failure under declining 200DMA resistance from earnings followed by a 50DMA breakdown, TSLA looks like it is entering a new and lower trading range between (roughly) $178 and $248. The next question is how low will support drop for the new trading range.
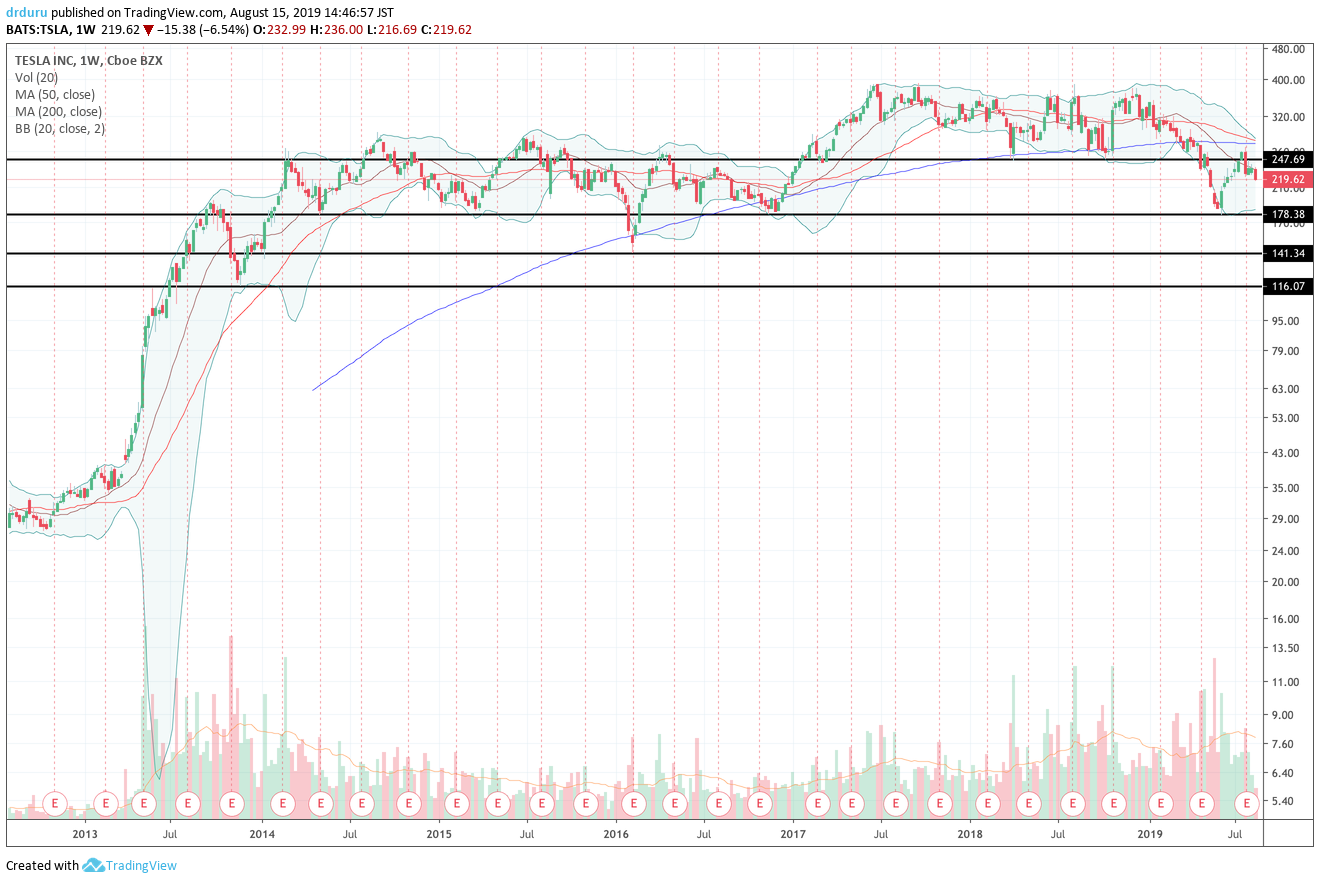
These trading range lines look very obvious, but their clarity make them very useful. The line certainly worked for the bounce from the May/June lows.
The Trades
Just like the earlier post, I think investors and traders should consider the covered call strategy if they are fortunate enough to own 100+ shares. The 50DMA breakdown increases the importance of downside protection.
Option premiums are high for TSLA, especially with the market in a very volatile period. For example, at the close, the options market priced in the following approximate changes in stock price by various expirations:
- Aug 16 (2 days away): +/- 7 points or +/- 3%
- Aug 23: +/- 14 points or +/-6%
- Sep 20: +/- 27 points or +/- 12%
- Dec 20: +/- 55 points or +/-25%
(Recall that the cost of the straddle, the call and put, nearest the current strike pice determines the market’s approximate estimation of the likely price range by expiration.)
Assuming $247.69 is the new top of TSLA’s trading range then the stock is currently a 13% gain away from that top. This means selling a September $250 call could make sense. However, that call is currently worth just $3.15 or so. That premium is hardly worth the cap in gains on the stock. If I owned stock, I would wait for the next rally before selling a call.
The presumed bottom of the new trading range is a 19% loss away. A put calendar spread once again makes sense using the bottom of the trading range as a pivot. The September/November $180 calendar put spread currently costs about $6.75. With earnings on October 23, this should provide coverage for earnings assuming TSLA behaves according to market pricing and fails to close below the $180 strike in the 5 weeks. The September $180 put costs about $2.80. While the price looks “cheap”, I am not as interested given I think the August lows for the stock market are around current levels.
I am looking to open the calendar put spread this week. If TSLA manages to reverse its 50DMA breakdown, I will add a call spread to my positioning. The month of expiration will depend on the timing of the reversal. I will peg the short side of the call spread to $245 or $250, the top of the presumed trading range.
Be careful out there!
Full disclosure: no positions