
AT40 = 26.1% of stocks are trading above their respective 40-day moving averages (DMAs)
AT200 = 40.3% of stocks are trading above their respective 200DMAs (2-month low)
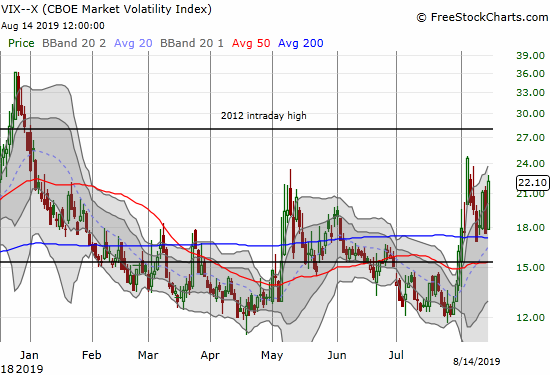
VIX = 22.1
Short-term Trading Call: neutral (caveats below!)
Stock Market Commentary
When the S&P 500 (SPY) bounced away from the oversold threshold last week, it left behind an extreme drawdown for the month of August. At the time, I concluded August hit its low for the month, but I was not ready to sound the all clear. I was similarly unimpressed even after President Trump reversed a lot of his latest Trade War threats in order to save Christmas (video below should start at the 2:00 mark).
The resulting jump in the S&P 500 stalled conveniently at resistance from the 50-day moving average (DMA). The very next day the 10-year Treasury bond fell under the 2-year and caused fresh concerns in the stock market. (See my piece “How to Understand Yield Inversion and Its Relationship to Recessions” for more info on why and how yield inversion matters).
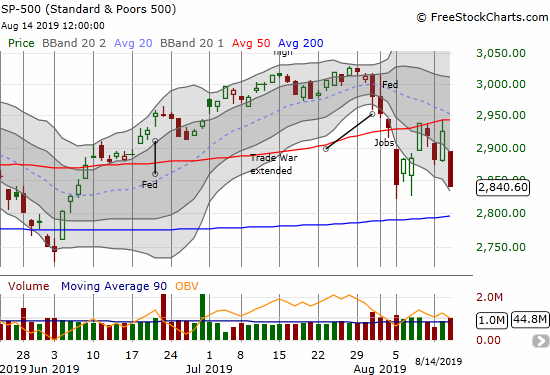
So the S&P 500 is right back at an August extreme. The GOOD news is that my favorite technical indicator, AT40 (T2108), the percentage of stocks trading above their respective 40DMAs, did NOT make a new low for August. AT40 closed at 26.1%, just short of the August closing low of 24.9% and well short of the intraday low of 21.7%.
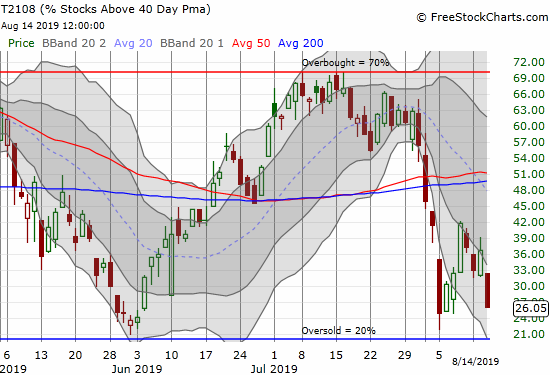
I cannot quite call this a tradeable bullish divergence given the broad carnage in the stock market. More importantly, AT200 (T2107), the percentage of stocks trading above their respective 200DMAs, failed to confirm the bullish divergence. That longer-term indicator closed at a 2-month low.
So I looked to the currency market as a final arbiter. At the time of writing, the Australian dollar (FXA) versus the Japanese yen (FXY) is bouncing away from the edge of despair. AUD/JPY continues to leave the flash crash low from January, 2019 as support.
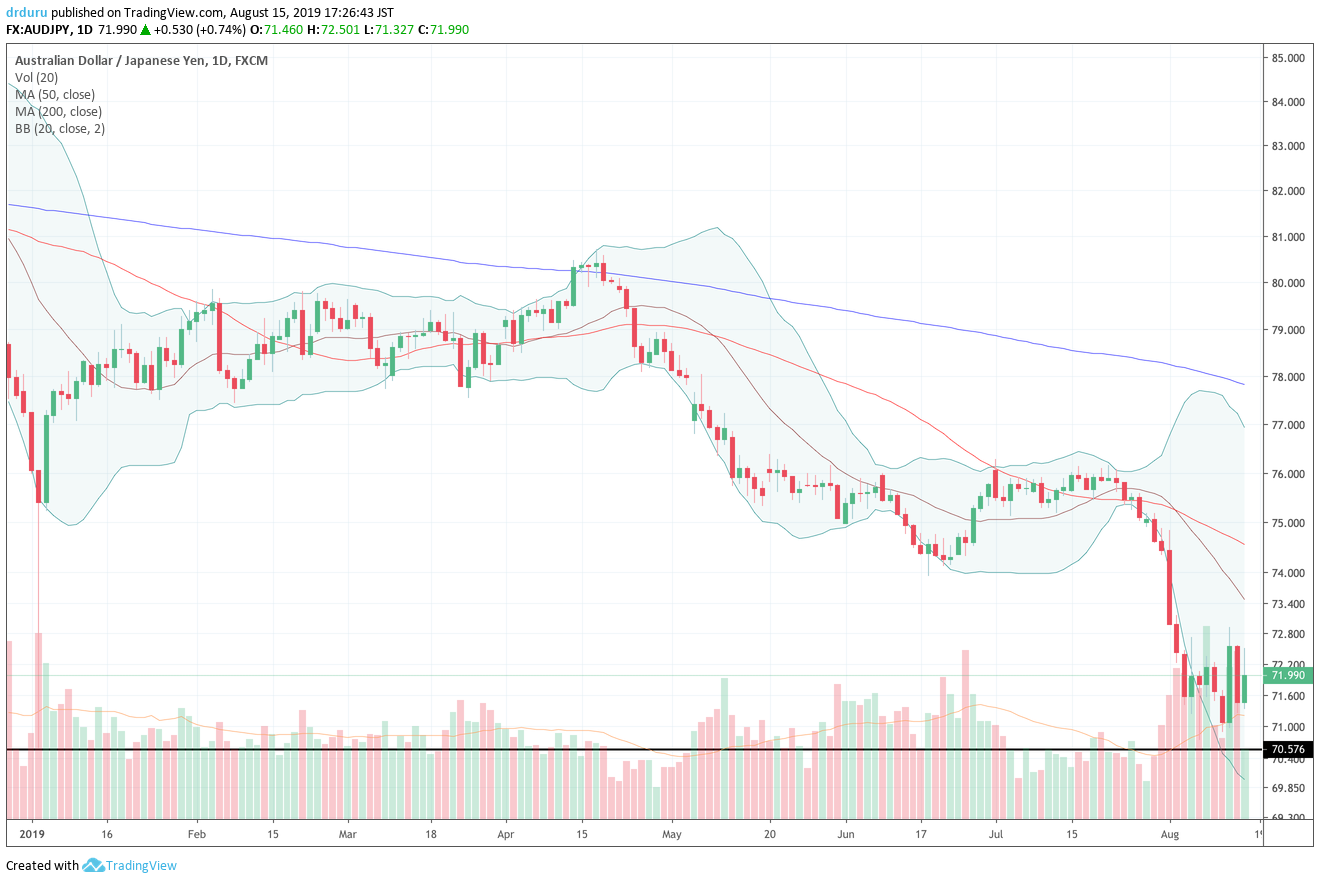
Source: TradingView.com
Volatility Chop
Finally the volatility index (VIX) somehow failed to surge past its high for the month. This is another small sign that the trend in fear and panic is ever so slightly subsiding.
The Trade
I want to be an aggressive buyer if the VIX manages to set a high for the month alongside a drop to oversold conditions for AT40. My degree of aggressiveness increases the further away AUD/JPY trades away from the 2019 flash crash low. In the meantime, I have been quickly flipping new positions on a daily basis under the assumption that sellers will fail to follow-through and the buyers lack the strength to punch through overhead resistance. I will provide a full review of key trades and positioning over the weekend.
Is It Different This Time?
Yield inversion and recessions are all the rage in headlines right now. I found this Marketplace segment interesting as a source for alternative interpretations of the inversion. I am just fascinated that the market found reason for fresh angst given yield inversion already hit in May with the 3 and the 10-years.
— – —
FOLLOW Dr. Duru’s commentary on financial markets via email, StockTwits, Twitter, and even Instagram!
“Above the 40” uses the percentage of stocks trading above their respective 40-day moving averages (DMAs) to assess the technical health of the stock market and to identify extremes in market sentiment that are likely to reverse. Abbreviated as AT40, Above the 40 is an alternative label for “T2108” which was created by Worden. Learn more about T2108 on my T2108 Resource Page. AT200, or T2107, measures the percentage of stocks trading above their respective 200DMAs.
Active AT40 (T2108) periods: Day #153 over 20% (overperiod), Day #1 under 30% (underperiod ending 6 days over 30%), Day #4 under 40%, Day #11 under 50%, Day #20 under 60%, Day #110 under 70%
Daily AT40 (T2108)
")
Black line: AT40 (T2108) (% measured on the right)
Red line: Overbought threshold (70%); Blue line: Oversold threshold (20%)
Weekly AT40 (T2108)

*All charts created using FreeStockCharts unless otherwise stated
The T2108 charts above are my LATEST updates independent of the date of this given AT40 post. For my latest AT40 post click here.
Be careful out there!
Full disclosure: long UVXY calls and puts, short AUD/JPY
*Charting notes: FreeStockCharts stock prices are not adjusted for dividends. TradingView.com charts for currencies use Tokyo time as the start of the forex trading day. FreeStockCharts currency charts are based on Eastern U.S. time to define the trading day.