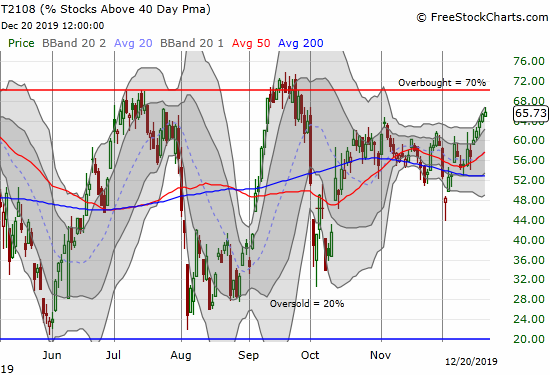
A Bearish Divergence Now Behind, Overbought Awaits for Stocks – Above the 40 (December 20, 2019)

AT40 (T2108) finally broke out of an extended 2-month trading range and looks ready to challenge the overbought threshold.

AT40 = 65.7% of stocks are trading above their respective 40-day moving averages (DMAs)AT200 = 59.8% of stocks are trading above their respective 200DMAs (just under high for 2019 of 60.2%)VIX = 12.5Short-term Trading Call: neutral Stock Market Commentary The bearish divergence finally ended between a range-bound AT40 (T2108) and an S&P 500 (SPY) steadily … Read more

Stock Market Rides Out A Trade War Anti-Climax – Above the 40 (December 13, 2019)

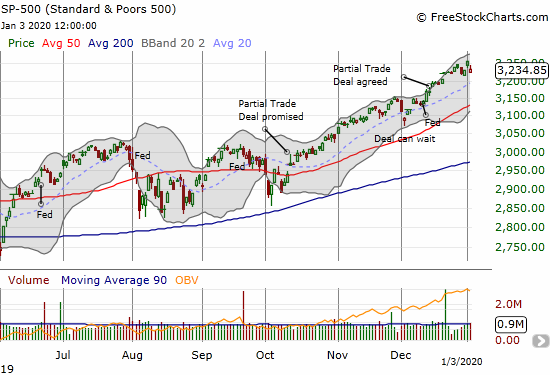
AT40 = 56.9% of stocks are trading above their respective 40-day moving averages (DMAs)AT200 = 55.7% of stocks are trading above their respective 200DMAsVIX = 12.6Short-term Trading Call: neutral Stock Market Commentary It appears China and the U.S. finally agreed on a Partial, Phase One Trade Deal. The bare bones basics on the deal consist … Read more

Lessons from the 2019 Seasonal Trade on Home Builders

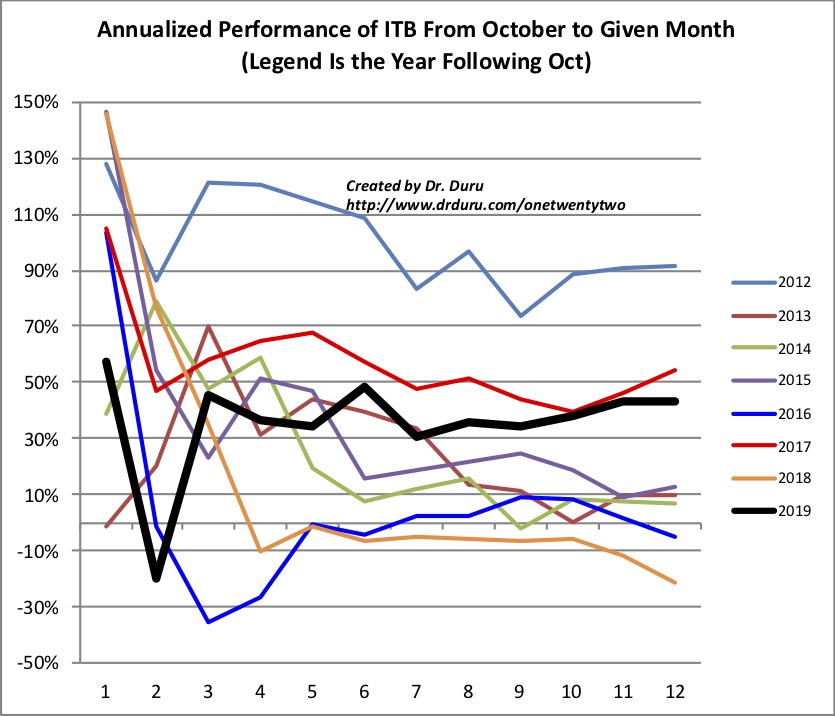
The iShares US Home Construction (ITB) annualized performance was very steady for 2019.

The ETF Performance The 2019 seasonal trade for home builders was a dramatic one that departed from the typical script. The iShares US Home Construction (ITB) suffered greatly in the late 2018 sell-off. The housing market softened as one of the most notable features of the sell-off in the stock market. Several home builders made … Read more

Part Optimism, Part Skepticism from A Partial Trade Deal – Above the 40 (October 11, 2019)

AT40 = 52.4% of stocks are trading above their respective 40-day moving averages (DMAs)AT200 = 48.1% of stocks are trading above their respective 200DMAsVIX = 15.6Short-term Trading Call: cautiously bearish Stock Market Commentary A Broad-Based Re-Entry Two Fridays ago, buyers took the S&P 500 (SPY) back above its 50-day moving average (DMA). It was yet … Read more

Stock Market Slams Into October’s Average Drawdown In Two Days Flat – Above the 40 (October 2, 2019)

The S&P 500 (SPY) confirmed its 50DMA breakdown with a 1.8% loss, but also closed well below its lower Bollinger Band.

AT40 = 39.0% of stocks are trading above their respective 40-day moving averages (DMAs) (intraday low at 34.5%)AT200 = 45.3% of stocks are trading above their respective 200DMAsVIX = 20.6Short-term Trading Call: cautiously bearish (caveats below) Stock Market Commentary A Broad-Based Exit The selling today was so broad that even Invesco S&P 500 Low Volatility … Read more

Stock Market Stalls At Overbought Threshold As Momentum Stocks Retreat – Above the 40 (September 13, 2019)

AT40 (T2108) has stalled perfectly at the overbought threshold of 70%.

AT40 = 67.8% of stocks are trading above their respective 40-day moving averages (DMAs) AT200 = 58.8% of stocks are trading above their respective 200DMAs (13-month high)VIX = 13.7Short-term Trading Call: neutral Stock Market Commentary Overbought Overrules Times like these remind me of the significance of the overbought line. AT40 (T2108), the percentage of stocks … Read more

Small Caps Answer the Call: Overbought Trading Conditions Now Approach – Above the 40 (September 10, 2019)

The iShares Russell 2000 Index Fund ETF (IWM) has surged through 200 and 50DMA resistance in a high-volume breakout move.

AT40 = 62.1% of stocks are trading above their respective 40-day moving averages (DMAs) AT200 = 55.2% of stocks are trading above their respective 200DMAs (finished reversing all of August’s decline)VIX = 15.2Short-term Trading Call: neutral Stock Market Commentary Role reversal While the S&P 500 (SPY) and the NASDAQ (COMPQX) continue to fail at confirming … Read more

A Stock Market Stuck In An Obvious Trading Range Still Produces A Rich Set of Expectations – Above the 40 (August 29, 2019)

AT40 = 38.3% of stocks are trading above their respective 40-day moving averages (DMAs) AT200 = 44.1% of stocks are trading above their respective 200DMAs (2-month low)VIX = 19.0Short-term Trading Call: neutral Stock Market Commentary The Trigger Finger On Tuesday (August 27), I saw enough hints of a flip from a bullish to bearish divergence … Read more

Tesla: New Trading Strategies for A Fresh Breakdown and New Price Range

The monthly chart of Tesla (TSLA) suggests the stock has entered a lower trading range. If this range fails, there are likely two more lines of firm support before the stock hits an air pocket that would threaten all the steep gains from 2013.

The Short-Term Breakdown The technical conditions for Tesla (TSLA) have greatly deteriorated since I wrote about short-term and long-term trading strategies on the stock. I focused on two main trading strategies: 1) a longer-term covered call strategy for bullish investors fortunate enough to own 100+ shares of stock and 2) what I considered at the … Read more

A Manic Stock Market Leaves Behind An Extreme August Drawdown – Above the 40 (August 9, 2019)

Much ado about nothing? The 15-minute chart of the S&P 500 (SPY) shows the gory details of a manic swoon to a near flat close for the week.

AT40 = 37.3% of stocks are trading above their respective 40-day moving averages (DMAs) AT200 = 46.5% of stocks are trading above their respective 200DMAs VIX = 18.0Short-term Trading Call: neutral (caveats below!) Stock Market Commentary The S&P 500 (SPY) ended the week almost where it started. In between the bookends, the market gyrated wildly … Read more