
AT40 = 3.0% of stocks are trading above their respective 40-day moving averages (DMAs) (13th oversold day)
AT200 = 6.5% of stocks are trading above their respective 200DMAs
VIX = 57.8 (down 23.4%)
Short-term Trading Call: bullish
Stock Market Commentary
The stock market experienced another historic day as the bear market takes on more twists and turns. The superlatives should be exhausted, but the stock market keeps finding them.
Oversold
AT40 (T2108), the percentage of stocks trading above their respective 40-day moving averages (DMAs), extended oversold trading conditions to a 13th day. Despite a monster rally in the stock market, most of the gains in the final 30 minutes, AT40 only closed at 3.0%. My favorite technical indicator was 1.7% the previous day. Such a small gain in AT40 on such a big market day is a result of the extreme oversold conditions, so many stocks are extremely far below their respective 40DMAs!
AT200 (T2107), the percentage of stocks trading above their respective 200DMAs, also made little progress. This longer-term indicator reluctantly budged from 4.1% to 6.5%. The stock market has a LOT of work to do, but at least that work represents tremendous potential upside when the oversold period ends.
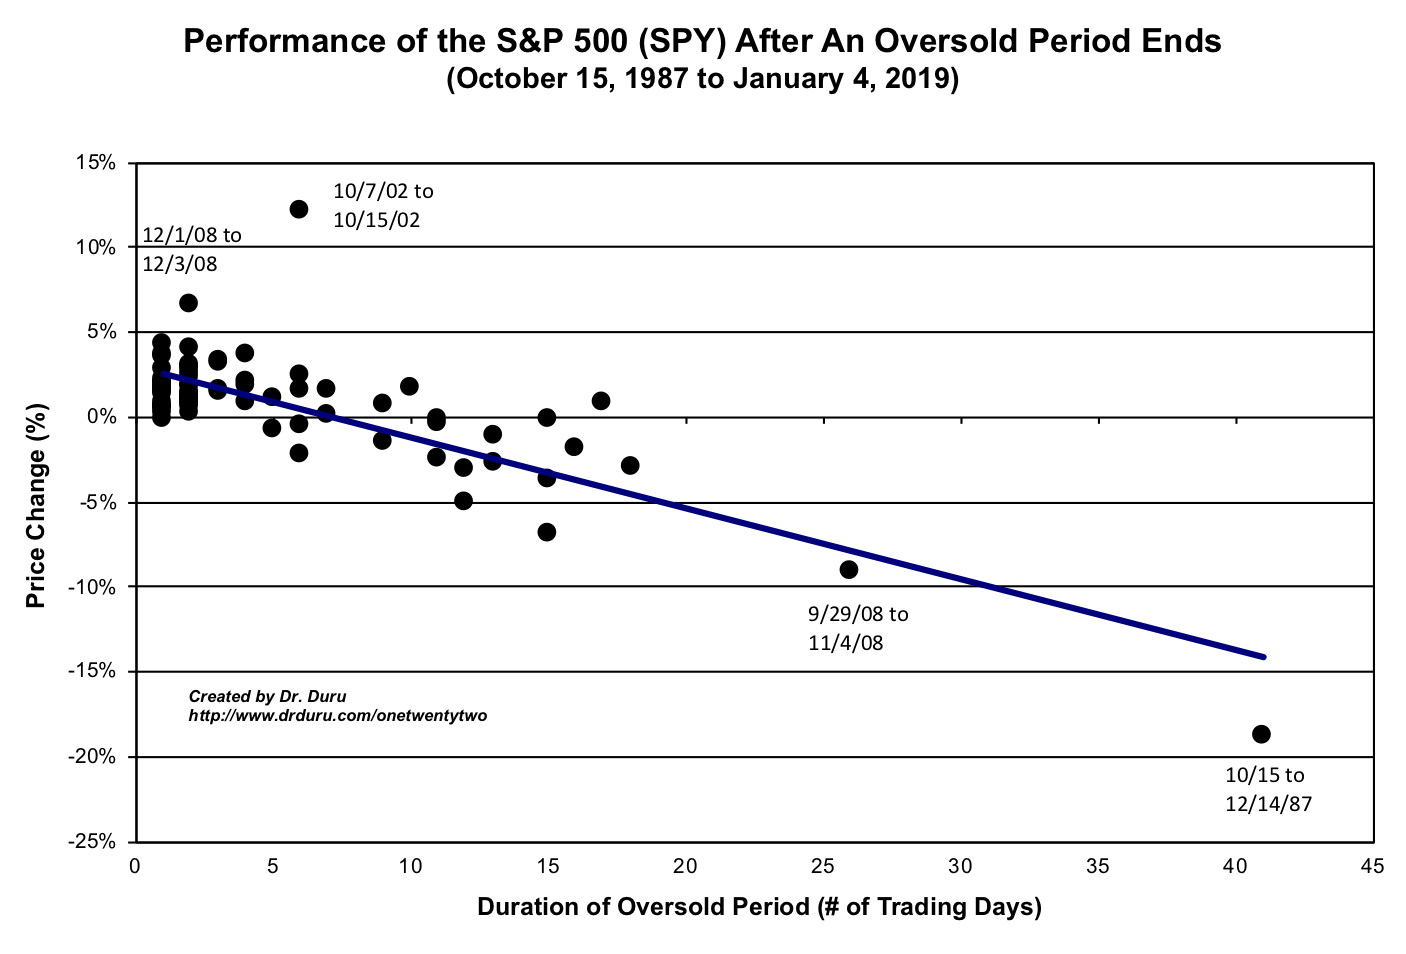
At these depths of market pessimism, I am now much more interested in the duration of the oversold period than its level. This oversold period sits at historic levels. Only 8 other oversold episodes since 1987 have lasted longer than this oversold period. The S&P 500 is now down 13.0% since going oversold on February 26th, a huge improvement of course from the previous day where the index was weighed down with a 20.4% loss for the oversold period. History indicates that if the index can escape from oversold conditions in the next week, the index could gain another 8% or so percentage points or more. Note that the range of possibilities is wide.
I added some labels to the performance versus duration chart below for historical context; all 4 extremes on the chart happened during bear markets. The y-axis describes the gain of the S&P 500 measured from the first day AT40 closed below 20% to the first day AT40 closed above 20% upon exit from the oversold period.
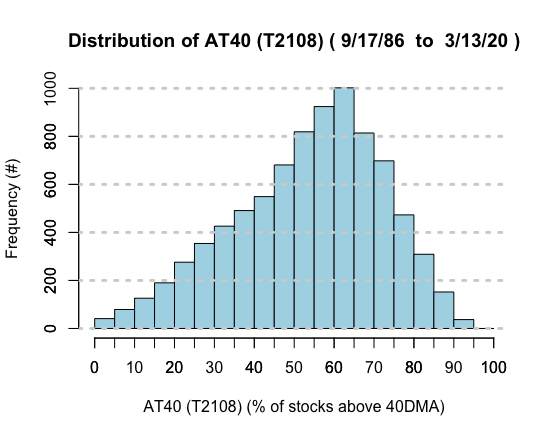
The distribution chart below shows the market’s skew for AT40. The y-axis counts the number of days AT40 spends in the 5% range of values described on the x-axis. So, for example, since 1986, AT40 has closed between 15% (inclusive) and 20% (exclusive) just 191 days. AT40 has spent just 436 days in oversold territory (below 20%) and just 41 days below 5%. The stock market spends far more time in overbought conditions (above 70%): 1,669 days. The rarity and short relative duration are large drivers of the bullish trading strategy I take for any and all oversold periods.
The Stock Market Indices
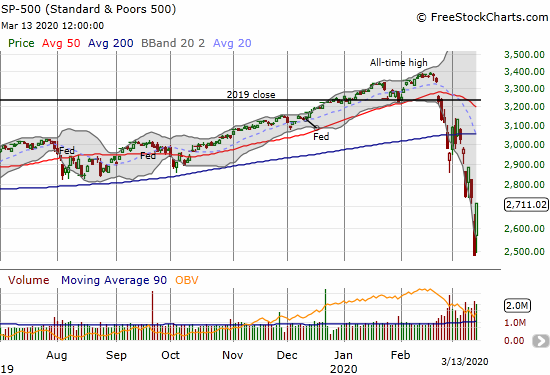
The S&P 500 (SPY) put on a startling show with a 9.3% gain. The index almost reversed the previous day’s equally remarkable 9.5% loss that surely left many in despair. Even more incredible, the index gained 4.0% in just the last 15 minutes as President Trump’s coronavirus press conference rolled out. I am now going to use the launchpad for this burst as a line in the sand for a bottoming for the oversold period. In other words down to 2600, I am planning a shopping spree.
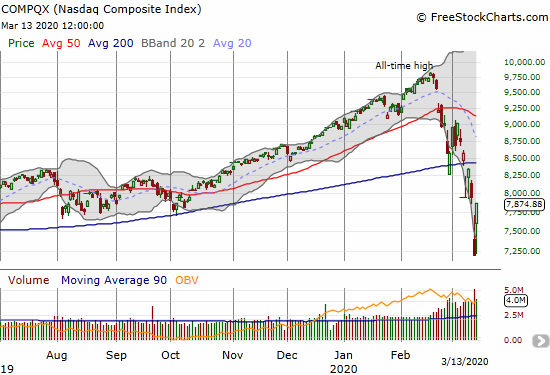
The NASDAQ (COMPQX) put on a parallel show with a 9.4% gain that also nearly reversed the previous day’s stomach churning loss.
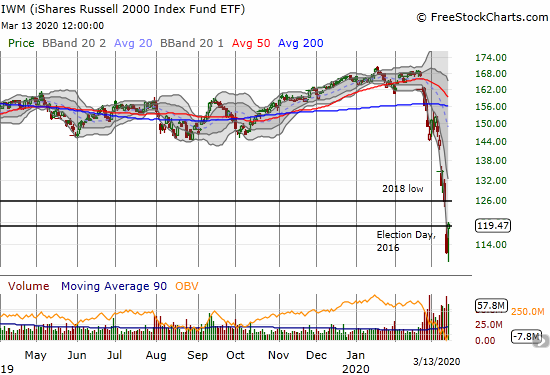
The iShares Russell 2000 Index Fund ETF (IWM) gained 7.0% but it did not even come close to reversing the previous day’s loss. The index of small cap companies just barely recovered to its closing level the day of the U.S. Presidential election on Tuesday, Nov 8, 2016.
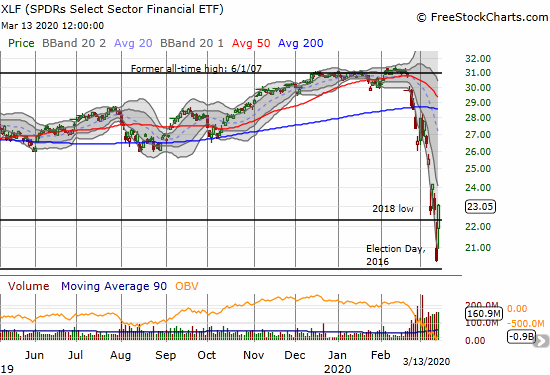
The SPDRS Select Sector Financial ETF (XLF) was perhaps one of the most remarkable indices on the day. XLF gained an eye-popping 13.3%. The index of financial companies DID recover the previous day’s loss and then some! XLF looks like it will hold onto its support formed by the 2016 Presidential election as it managed to even close above its 2018 low.
Consistent with a major risk on day, both the Invesco S&P 500 High Beta ETF (SPHB) far outpaced the gains of the Invesco S&P 500 Low Volatility ETF (SPLV) 10.2% to 7.1%.
Volatility
The volatility index (VIX) dropped hard but is still well within its stair-stepping pattern in its upper Bollinger Band (BB). The VIX lost 23.4% and closed at a very elevated 57.8.

The Short-Term Trading Call
Just like the coronavirus news, the trade conditions for the oversold period change quickly. In the aftermath of Thursday’s big plunge, I decided to slow down my buying going forward. I was anticipating further losses. Friday’s surge has all the makings of a (bear market) bottom, so I am immediately returning to my regularly scheduled program of buying in anticipation of the upside that comes with the end of an oversold period. The 2600 level on the S&P 500 gives me a definitive target for a new dividing line between bull and “slow your roll.” To support a more aggressive stance, I am making sure to have more “backstop” put options in place on select hedges (see below).
In a sea of bad news, South Korea is providing a beacon of hope that the coronavirus contagion can and will at some point get under control and then end. This news gives me one more reminder that I need to stick to a bullish bias during this oversold period no matter how uncomfortable it feels….and even with a global recession waiting in the wings.
Stock Chart Reviews – Below the 200DMA
JPMorgan Chase (JPM)
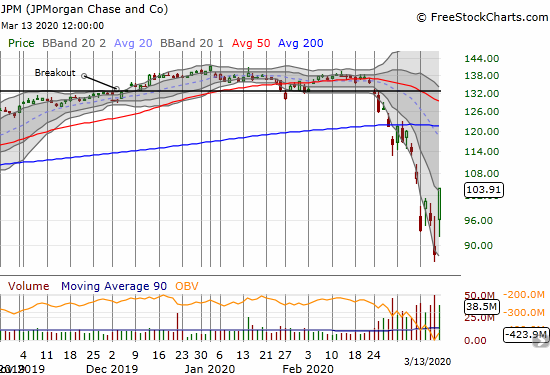
JPMorgan Chase (JPM) soared 18.0%. I of course wish I added to my position the previous trading day! While many traders and investors do not like huge up days, I love these kind because the market sets a firm line in the sand at the previous low. JPM is buyable on dips with a clear stop below Thursday’s multi-year low. I even like accumulating shares of JPM here. Recall that financials have already experienced a kind of grand wipe-out by collapsing all the way back to the day of President Trump’s election (and in some cases further).
iShares Silver Trust ETF (SLV)
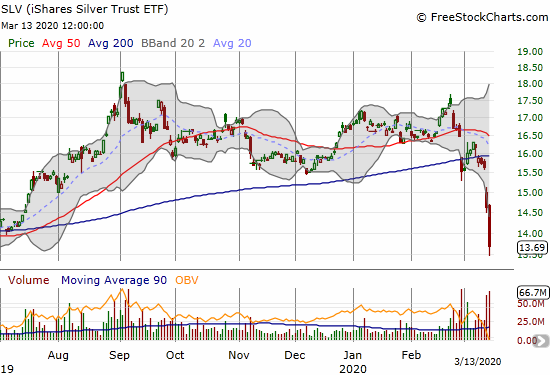
The iShares Silver Trust ETF (SLV) plunged 6.4% in a major confirmation of its 200DMA breakdown. My SLV call options are down for the count, but I cannot help taking one more swing in the coming week. The gold/silver ratio is at a record high which makes silver relatively cheap. Of course gold could start selling even faster than silver, but my longer-term bet rests with precious metals, especially with yet more easy money and debt about to wash over the planet. I suspect silver (and gold) plunged as a result of banks only taking 10% of the funds the Federal Reserve made available through its repo actions. That reluctance to draw down money and lend is akin to a tightening of conditions considering the rising need of businesses to access lifelines to get through the coming economic storm.
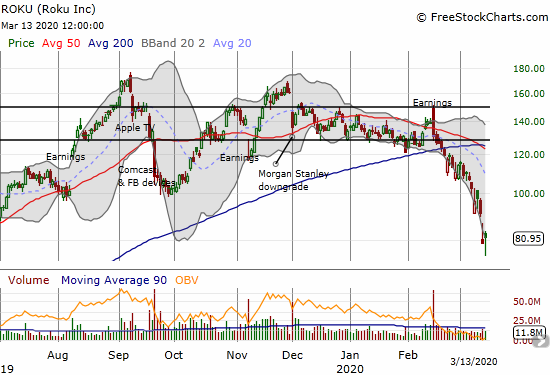
Roku (ROKU)
With its streaming services, Roku (ROKU) seems like an “obvious” stay-at-home, work-from-home trade. Yet, ROKU has steadily declined since it reported earnings last month. Even more telling is the “mere” 2.7% gain on a big rally day. At the intraday low, ROKU hit a 10-month low. I am watching this stock for any signs of sustainable, and buyable, life. A second straight up day would be a good sign.
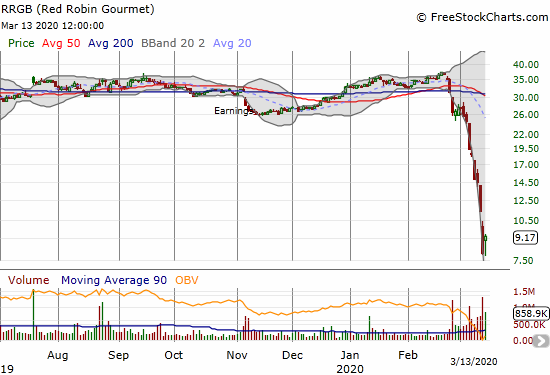
Red Robin Gourmet (RRGB)
Red Robin Gourmet (RRGB) has utterly collapsed. I bought perhaps my last tranche toward the end of another day of blood-letting. Red Robin Gourmet had the misfortune of reporting a big earnings miss the day before the stock market flipped oversold. The selling pressure has yet to relent. The reasons for owning RRGB have not changed, but the specter of forced store closures and patrons sheltering at home, makes RRGB unpalatable beyond the fans like me. Now I just wait to see whether RRGB can manage its way through this crisis to benefit from tremendous future upside. RRGB now trades under book value and a paltry 0.3 price/sales – a perfect acquisition target although the large short interest of 34% of float means that plenty of people are betting against this good outcome!
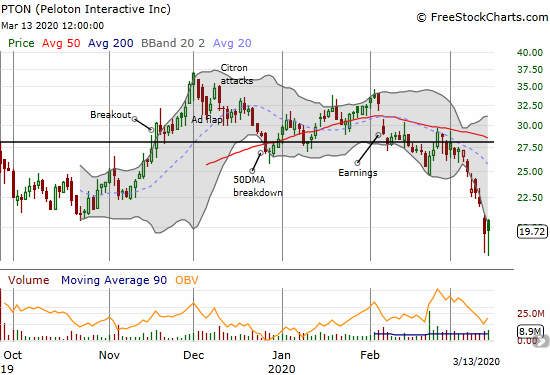
Peloton (PTON)
My bearish change in strategy in Peloton (PTON) was a bit early, but it worked out eventually as the market sell-off took its toll on the stock. I took profits just ahead of the final plunge in the stock. The stock’s initial strength in the face of the early and massive insider selling was impressive given the overall pressures in the stock market. Even if some of the shorts decided to run for cover, the rally made little since and was built for fading. PTON stopped cold right at converged 20/50DMA resistance
The stock has been a broken IPO for most of its existence as it opened and immediately dropped below the $29 IPO price. Still, the stock pulled off a double hammer bottom the last two trading days which prints a firm line in the sand at $18. I am looking to get back on the bullish bandwagon this week if the stock can climb above the intraday highs of the last two days. My stop will be below $18. My upside target will be $24-25, the initial low after insiders dumped shares.
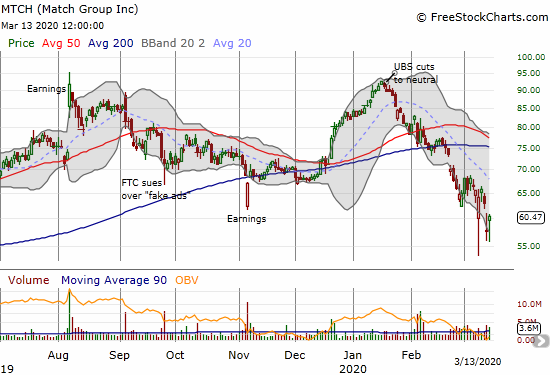
Match Group (MTCH)
Match Group (MTCH) is an anti social distancing stock. I am surprised the stock is not trading a lot lower, but maybe dating and love are undeterred by a virus. Still, I bought put options on Friday as part of an overdue small hedge against my load of longs I have accumulated during this oversold period.
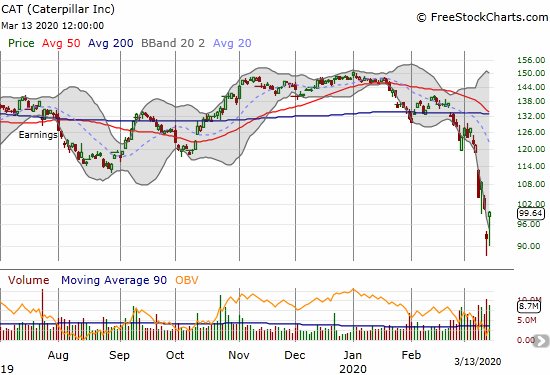
Caterpillar (CAT)
Caterpillar (CAT) finally experienced significant buying on Friday to the tune of an 8.0% gain. I used this jump to get put options as a small hedge on my bullish positions. If I had managed to somehow hold onto my earlier put options, I would have had a significant significant cushion going into Thursday’s bear market calamity.
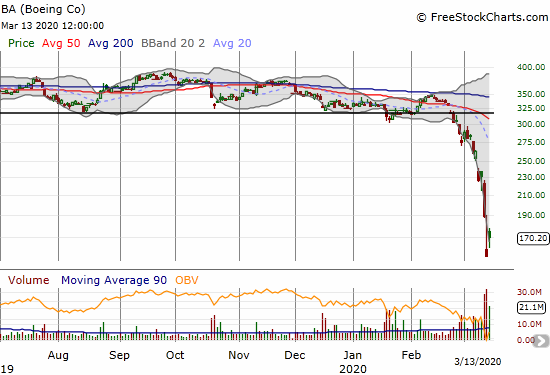
Boeing (BA)
Boeing was stuck in a trading range for over two years starting in January, 2018. The stock levitated through a global trade war and a grounding of its 737 Max plane after two fatal crashes within 5 months. Even growing scandals around the details of the plane’s development barely dinged the stock and BA even enjoyed periodic buying spurts. Investors stuck by the stock and pundits supported the relative bullishness by constantly touting an untouchable backlog, a robust balance sheet, and then hopes in new leadership.
In the end, it took a virus to expose the risks in the stock as global travel itself has come under pressure. Massive capacity cuts by the airlines will translate into greatly reduced needs for planes. BA is now down 38.2% for the month even after a 9.9% jump on Friday. Pent-up selling pressure no doubt ravaged BA. This episode is yet one more example of how blithely climbing the proverbial wall of worry can blind investors to very real risks and vulnerabilities.
Stock Chart Reviews – Above the 200DMA
Apple (AAPL)
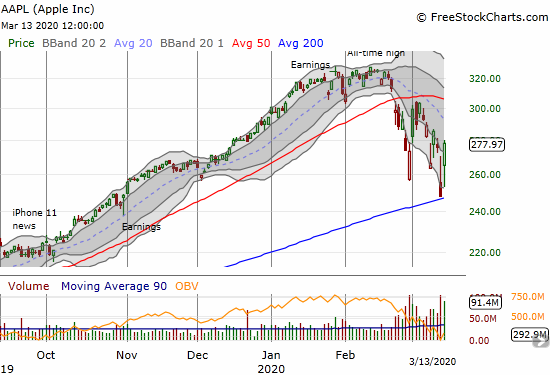
Apple (AAPL) survived its test of 200DMA support. This was an important achievement for the stock market in general. As long as AAPL is holding up, the bottoming process is underway for the market as a whole. On Friday, I bought a call option after the option as a fresh weekly call play for next week’s expiration. However, AAPL rose so much, a whopping 12.0%, that my call option easily hit its profit target for the day. If only I could plan for a 12% up day on a mega cap stock!
SPDR Gold Trust (GLD)
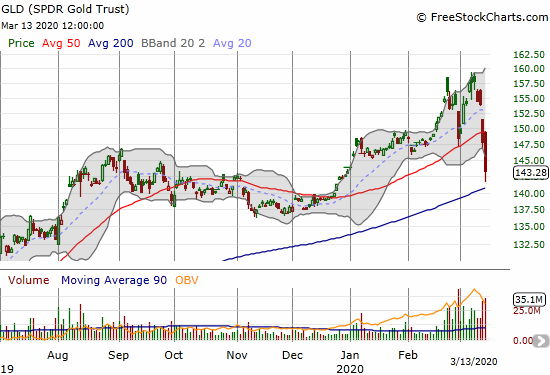
SPDR Gold Trust (GLD) fell 3.0% and confirmed both a double-top and a 50DMA breakdown. I saw Friday as a great buying opportunity but my limit order on call options never triggered. I will try again this week. The options are very expensive, but I am still looking to buy a single option as well as a spread if prices drop further. I am looking to GLD to resume its upward momentum as further global easing takes hold. However, the $160 level will be tough to crack.
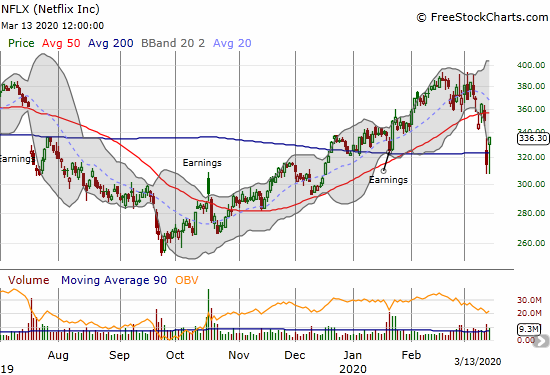
Netflix (NFLX)
Netflix (NFLX) is down “just” 13.4% from its last high in February. NFLX ended the week successfully defending its 200DMA. NFLX seems like the perfect stay-at-home play given its near infinite options for entertainment. However, the business model comes at a high cost. Subscribers pay a flat fee and cocooning households will consume extra bandwidth without paying more. NFLX also remains extremely expensive: 62 forward P/E, 8.4 P/S, and 21.6 price/book (Yahoo Finance). More importantly, NFLX holds 16B in debt versus 5B in cash. Operating cash flow is -$3B. The debt/equity ratio is a mind-boggling 216! The company has little flexibility to navigate a rough economy, especially as originals production has to slow down in the face of social distancing requirements. I remain short NFLX.
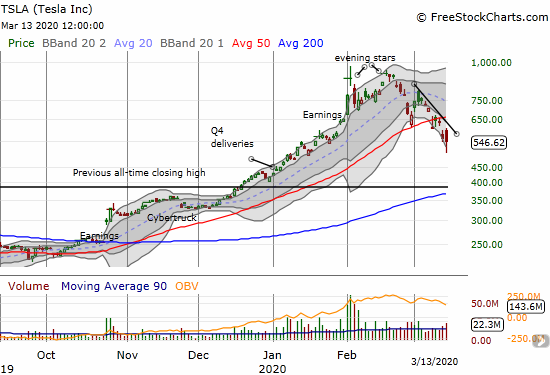
Tesla (TSLA)
Tesla (TSLA) remains one of the few stocks still trading above its 200DMA, but on Friday it stuck out like a sore thumb. TSLA had a rare day of under-performance with a 2.5% loss. While the stock managed a major rebound from its intraday low, this stark under-performance may signal a more bearish bias in the trading in TSLA. The stock is following an orderly decline from the the top its downward trending trading channel. I cannot get bullish again on the stock until it closes above that downtrend. The relentless rally that pushed TSLA to its topping pattern leaves little natural support levels, so continued selling will likely move to reverse the entire breakout from the previous all-time closing high. (And do not forget that bear markets are built to break support anyway!)
— – —
FOLLOW Dr. Duru’s commentary on financial markets via email, StockTwits, Twitter, and even Instagram!
“Above the 40” uses the percentage of stocks trading above their respective 40-day moving averages (DMAs) to assess the technical health of the stock market and to identify extremes in market sentiment that are likely to reverse. Abbreviated as AT40, Above the 40 is an alternative label for “T2108” which was created by Worden. Learn more about T2108 on my T2108 Resource Page. AT200, or T2107, measures the percentage of stocks trading above their respective 200DMAs.
Active AT40 (T2108) periods: Day #13 under 20% (oversold day #13), Day #14 under 30%, Day #25 under 40%, Day #16 under 50%, Day #35 under 60%, Day #39 under 70%
Daily AT40 (T2108)
")
Black line: AT40 (T2108) (% measured on the right)
Red line: Overbought threshold (70%); Blue line: Oversold threshold (20%)
Weekly AT40 (T2108)

*All charts created using FreeStockCharts unless otherwise stated
The T2108 charts above are my LATEST updates independent of the date of this given AT40 post. For my latest AT40 post click here.
Be careful out there!
Full disclosure: long IWM calls, long QQQ calls and shares, long SSO, short UVXY, long MTCH puts, long CAT puts, long GLD, long SLV shares and calls, short JPM put spread, short AAPL put spread
*Charting notes: FreeStockCharts stock prices are not adjusted for dividends. TradingView.com charts for currencies use Tokyo time as the start of the forex trading day. FreeStockCharts currency charts are based on Eastern U.S. time to define the trading day.
The FED just cut rates to zero and is starting a new QE program.
Tomorrow should be a very interesting day in the market…keep your seat belt buckled….
I have to post another addendum! Futures limit down as I type. This is one TRUE bear market. Wowza. At least this time I got some backstop shorts and puts in place.
The day is now over, and the Dow was down 3000 points. Would you care to revise your comment of “Wowsa” to at least something a little stronger? Like maybe WOWSA!!!! ?
We are in uncharted territory here. The VIX closed at about 83 today. I didn’t look, is this higher than 08/09?
There’s a lot(!) of fear here. As I said before, this is difficult even for me, and I’ve been through more than one of these. It’s not the drop, it’s the speed of the drop.
But I’m sticking to my plan, just as I did in 2008/2009. Still, it isn’t any easier… hopefully, in at least 2 years down the road, it will look right in retrospect….
Yes. I need to do a LOT of revising of a LOT of things. Soon after I published this post, the Fed rolled out its emergency policies, and it lit a fire under my feet to write an overdue review of all the major actions central banks have done.
We are basically looking into the abyss of a bottomless pit. The fear is so thick, and the uncertainty so vast, that very few people even want to think about investing in the future. After the last crashes, I too thought I was ready for *anything*. But THIS?!?! No way. There absolutely no tools for dealing with this on a trading basis. You can only pick spots and put faith in the future.
Last I saw, Futures were up about 5%. That may not translate into anything much by tomorrow (considering that any breaking news could easily torpedo it), but if it does, prepare for whiplash…
Regardless, I think the bias will be down over the near term. At least until some degree of normalcy returns to daily lives in most of the world, causing the extreme fear to recede. But after that, there will be earnings…
There’s nothing wrong with your trading model. We’ve seen it work before. But as you pointed out, it just cannot deal with or provide information about extremes that become even more extreme. Maybe we should call them ‘compressed extremes’.
But ultimately, this bug will go away, one way or another, and the economy and the market will rebound. Between now and then, it’s going to be wild, if not nasty.
I like that term, a “compressed extreme”, because it implies that coming out of it will be a potential huge rally. 🙂
I don’t mind the futures. I want to see a big OPEN. We need something that tips the balance of fear back in the court of the bears and sellers. But as you said, without some sense of normalcy or even the hope of normalcy, the stock market will reflect the angst of the real world. Not to mention we have the Fed desperately fighting to save the bond markets from falling apart!
A tepid open, but a strong finish. Up over 5% today. The roller coaster is far from over.
The president want to send money to people. In many communities, they won’t be able to go out and spend it to stimulate this pre-recession economy, because they are under virtual lockdown. Even if they could, it wouldn’t be enough. You can’t make up for multiple weeks of throttled-back, nearly dead business activity. As Paul Samuelson said, “there’s no free lunch”.
That fact aside, what does your crystal ball say the market will do tomorrow? 🙂
My crystal ball says we barely scratch out another gain to FINALLY make it two days in a row. And then the bear market just keeps grinding along with smaller swings.
I might change that tomorrow! 🙂
The idea of stimulating the economy while people can’t spend money on anything is truly bizarre. And we thought the big stimulus programs from the financial crisis were awesome to behold!
My crystal ball says it’s going down….again. But my crystal ball has been very foggy recently. I hope it’s wrong, and that yours is right. We’ll compare notes tomorrow.
In the meantime, a few headlines I came across:
“Marriott is beginning to furlough employees”
“Uber drivers say earnings are falling, and many have no other income”
“Corona Virus to cause global recession: S&P Global”
Boeing is looking for a bailout. As are the airline and gaming industries.
I hear you can book a cruise at dirt cheap prices these days, but you just can’t take it anytime soon.
None of this is surprising, as the domino effect is well under way. But based on the widespread magnitude of the impact, this thing could end up being something more like a depression than a recession, at least until it’s under control. That is to say, relatively short, but very deep.
At this pace, we are definitely headed for depression-like conditions. Definitely NOT a scenario I bothered to contemplate. Yikes!
Collapses are magnifying the currency market as well and so strange to see people prefer to liquidate gold and silver under these conditions. Today, it is the British pound’s turn. I am going to start a series called “Culture of Collapse”
I was really hoping you would win this one, Duru. Really I was.
This is either going to turn out to be the best buying opportunity of the next ten years, or the beginning of at least a mini-depression. Perhaps both. It’s looking to me to be worse than 08/09.
It’s very difficult to buy in this market, as things that are quite cheap keep getting a lot cheaper.
The only good news is that it closed off the lows of the day. If we aren’t getting at least close to the bottom, it’s going to be very ugly indeed. 🙁
I have honestly stepped almost completely aside. No point in buying when more selling seems nearly inevitable. I have accumulated enough to feel great whenever the real recovery begins. I won’t buy more until 1) a complete collapse, and/or 2) S&P 500 gets a confirmed close above 2500-2600 (still thinking through my levels). I am hoping to write a post tonight to describe my changing strategy.
I think it could be both a mini-depression and the best buying opportunity in a generation. At least this time around, it’s not the plumbing of the economy that’s broken, it’s the science that needs to catch up to a virus. Once it does, all this stimulus is going to light a rocket under asset prices.