
AT40 = 63.5% of stocks are trading above their respective 40-day moving averages (DMAs)
AT200 = 60.3% of stocks are trading above their respective 200DMAs
VIX = 14.0
Short-term Trading Call: neutral
Stock Market Commentary
The stock market started the new decade with wild swings.
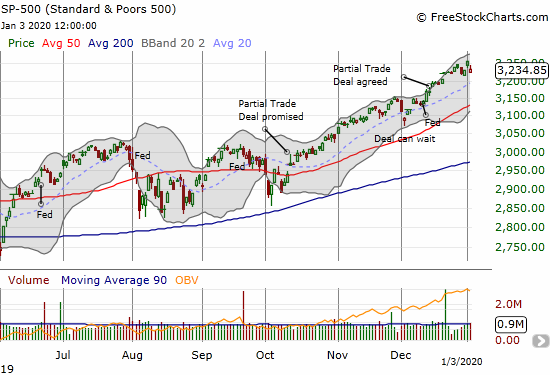
After starting the first trading day of the decade with a 0.8% gain and another all-time high, the S&P 500 (SPY) turned around and reversed all those gains the next day. The slight wariness came on the heels of a U.S. military strike at the Baghdad, Iraq airport that killed a top Iranian general. On the economic side, the Institute for Supply Management’s (ISM) purchasing managers’ index dropped to 47.2, its lowest level since 2009 and its 5th straight month in contraction territory.
The last three days of trading in the S&P 500 created a kind of bearish topping pattern called an island reversal: a gap up followed by little to no buying progress which is in turn followed by a gap down that reverses all the gains. The pattern leaves the latest buyers on an “island” of regret that quickly transforms them into motivated sellers. The topping potential is all the more ominous thanks to a bearish divergence which accompanied Thursday’s gain. AT40 (T2108), the percentage of stocks trading above their respective 40-day moving averages (DMAs), lost almost a point despite the gains in the stock market that day.
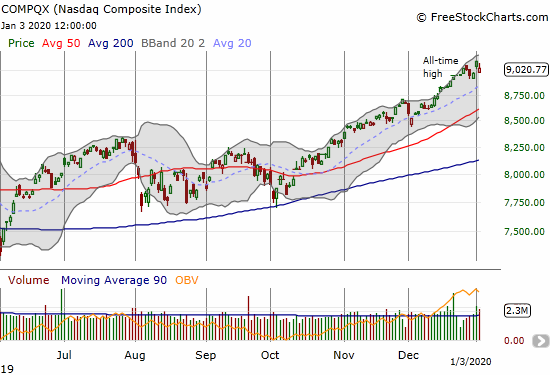
The NASDAQ (COMPQX) created its own island reversal chart pattern.
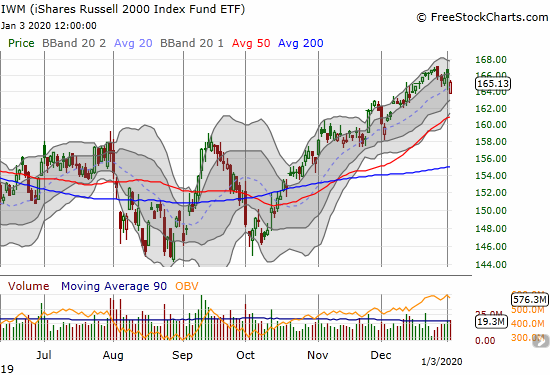
The iShares Russell 2000 Index Fund ETF (IWM) is under-performing again as it closed Friday with a 2-week low. The slow drift has the look of an upcoming test of 50DMA support.
In my last Above the 40 post, I pointed to the signs of topping action in the stock market and the conditions needed to push through those signals. While AT40 bounced from 58.3% on Friday to close the day at 63.5%, I do not think overbought conditions are imminent, especially given earnings season coming up. So short-term trading conditions are not positive, but sellers still have a lot to prove as Friday’s double-whammy of bad news should have been enough to cause a lot more damage on the heels of a bearish divergence.
Volatility
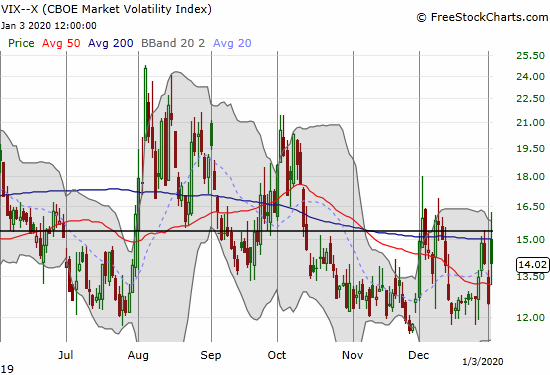
I daresay the volatility index (VIX) bottomed in December around 12. While the volatility faders have come out in force the last three days, I have to believe that the geo-political situation combined with weakening macro-economic numbers (Europe also produced some poor numbers) will encourage traders to reach for more protection than usual. As the faders took down the VIX on Friday, I decided to load up on cheaper January monthly call options on BOTH the ProShares VIX Short-Term Futures ETF (VIXY) and the ProShares Ultra VIX Short-Term Futures ETF (UVXY) to add to my existing February VIX call options.
The Short-Term Trading Call
As I noted in my last Above the 40 post, on a short-term basis, this is the exact wrong time to buy into the S&P 500 (SPY). Now it looks like the overbought threshold will hold and leave the index even more vulnerable to a pullback. Still, I do not expect the market’s resilience to melt away in 2020. There is not even a reason to get bearish until/unless the S&P 500 somehow manages to close below its 50DMA – and by then AT40 will likely be at or close to oversold levels. In other words, my short-term trading call is likely to remain neutral for quite some time.
Stock Chart Reviews – Below the 50DMA
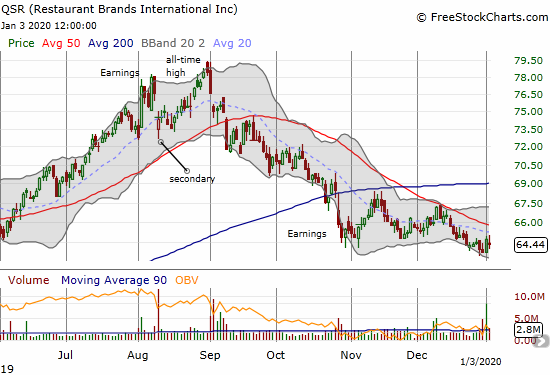
Restaurant Brands International (QSR)
Restaurant Brands International (QSR) continues to sink from the all-time high it set in August. This trade on Popeye’s Louisiana Kitchen is not working as I expected. Still I think these levels represent a tasty discount for the QSR franchise, so I plan to keep taking what the market gives me. I fully expect QSR to be much higher in another year or two.
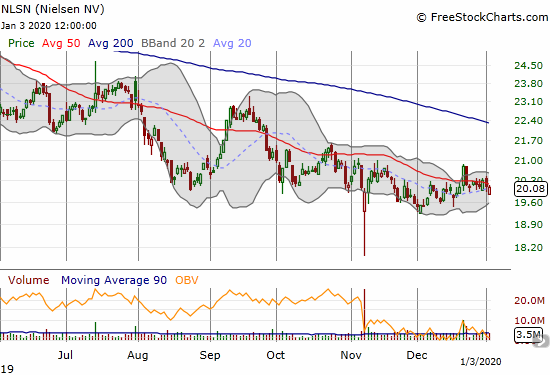
Nielsen (NLSN)
Speaking of trades not working as expected, Nielsen (NLSN) completely failed for me. In August of 2018, I confidently made the case for following Elliot Management in buying into this story of under-valuation. I bought January, 2020 calls fully expecting to reap large rewards. I am glad I just bought call options: NLSN has only drifted ever downward since then. The stock is now even more undervalued by around 23%. I plan to try again soon as I have to imagine Elliot will force the issue at some point in the next year or so.
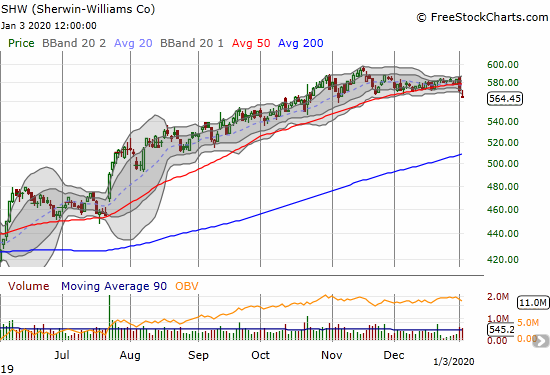
Sherwin-Williams (SHW)
As I watch the stocks of home builders slowly roll over, I am also watching housing-related stocks for signs of direction. The paint company Sherwin-Williams (SHW) just threw up its own sign of trouble with a confirmed 50DMA breakdown on Friday. The stock has little “natural” support from here until its 200DMA.
Stock Chart Reviews – Above the 50DMA
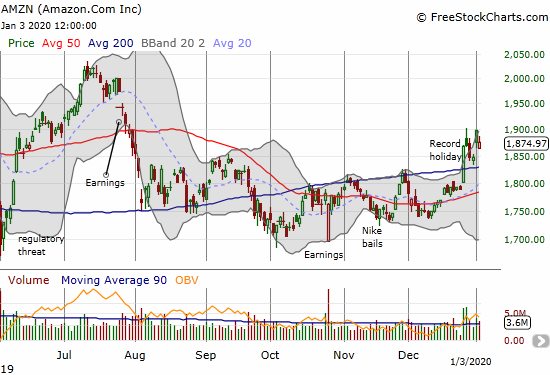
Amazon.com (AMZN)
In my last Above the 40 post I layered some caution on top of the breakout for Amazon.com (AMZN). Sure enough, AMZN quickly retested 200DMA support. That test created a perfect setup for buying, but I decided to wait for some confirming buying. The market gave me no time when 2020 launched with a rally. AMZN gapped up and ended the day with a 2.7% gain. Friday’s gap down and 1.2% loss should set up the next buying opportunity. I plan to get in on the next down move.
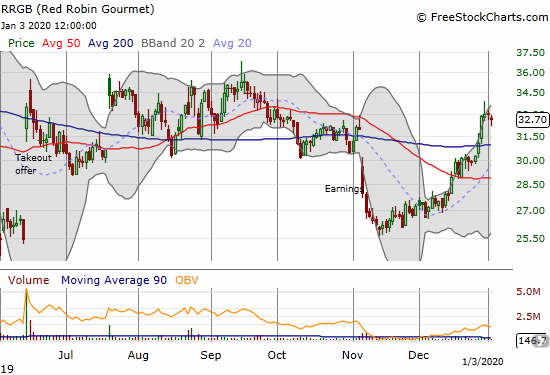
Red Robin Gourmet (RRGB)
In mid-June, I made the case to buy into Red Robin Gourmet (RRGB). I have been surprised since then that the take-out offer has done little to inspire the stock market. In November, RRGB even produced another poorly received earnings report and retested its 2019 lows shortly thereafter. I failed to buy into what now looks like a triple bottom for RRGB, but I am relieved that the stock is back to its post-offer price.
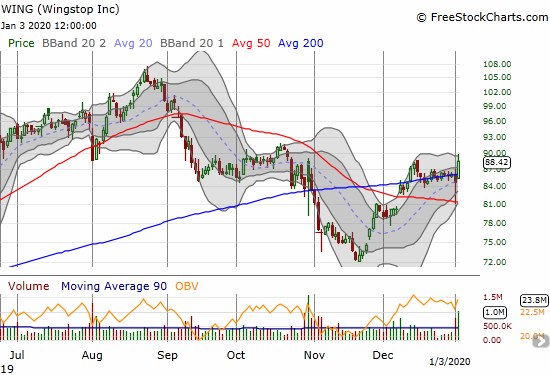
Wingstop (WING)
Wingstop (WING) is a chicken wing restaurant with a heavily shorted stock that looks ready to make a fresh launch higher. On Friday, the stock gained 4.3% with a big move off 200DMA support. I like buying into a confirmation move higher from here. On December 9, Goldman Sachs added WING to its conviction buy list with a $140 price target, so I assume this year could offer a LOT of upside. Note that on Thursday Wingstop’s COO submitted his letter of resignation. Wedbush followed that news with an upgrade from neutral to outperform and a $105 price target from $88.
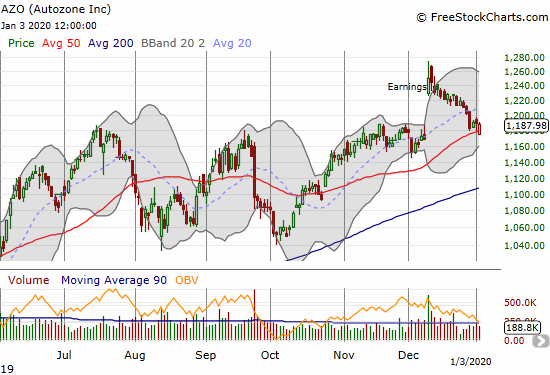
Autozone (AZO)
Auto parts retailer Autozone (AZO) gained 6.9% after its last earnings report. Surprisingly, the buyers pretty much disappeared after that all-time high. I wanted to buy at 50DMA support, but Friday’s gap down put those plans on hold. Now I will wait for AZO to close above Thursday’s intraday high.
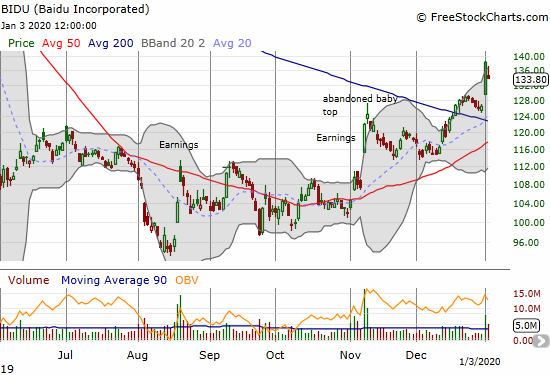
Baidu (BIDU)
I have been as patient as possible with Baidu (BIDU) as a discounted play on better times to come from China. BIDU barely benefited from the momentum building for some kind of resolution in the US vs China trade war. I made my last case for BIDU on the 200DMA breakout. Last week’s surge was a fantastic reminder of the importance of following the signal of the 200DMA breakout! I had a layered play with a call option expiring on January 3rd. I of course took profits on that into the 9.4% gain on the day. I am still holding a January monthly call spread. With Friday’s 3.2% pullback, I am looking to extend my positioning. (Jan 4, 2020 addendum: Chinese stocks rallied on the heels of more accommodative monetary policy from the People’s bank of China (PBOC)).
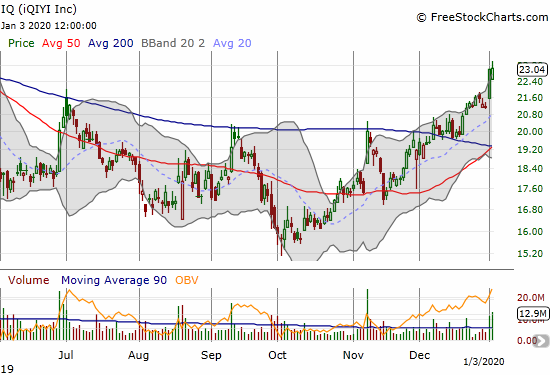
iQIYI (IQ)
I stubbornly held onto and accumulated iQIYI (IQ), the “Netflix of China”, through all the trade war drama. In October, the stock even came close to challenging its all-time low from December, 2018. For anyone not already in the stock, December’s 200DMA breakout was a confirming buy signal. IQ fought through Friday’s sell-off to notch a fractional gain after Thursday’s impressive 8.8% gain. As a reminder, I consider IQ a long-term play. The stock hit its all-time high in June, 2018 around $46. I think there is a lot of upside potential ahead.
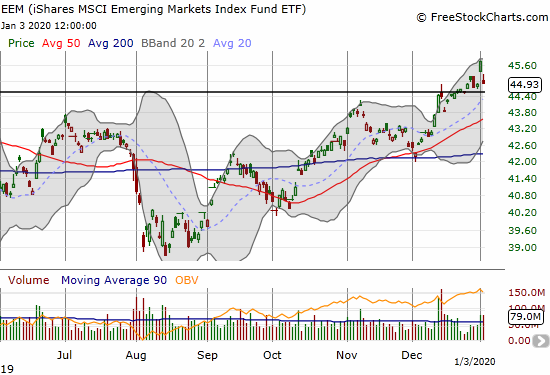
iShares MSCI Emerging Markets Index Fund ETF (EEM)
As good as the China-related stocks look, iShares MSCI Emerging Markets Index Fund ETF (EEM), which includes China plays, had a notable setback on Friday. The black horizontal line below represents the 2019 high set in April. The last time EEM hit that level prior to April was August, 2018. So December’s breakout above this level was significant. Normally, I would consider Friday’s 1.9% loss a buying opportunity even though it reversed Thursday’s surge. However, the island reversal makes me cautious. I now need to see EEM invalidate that bearish topping pattern.
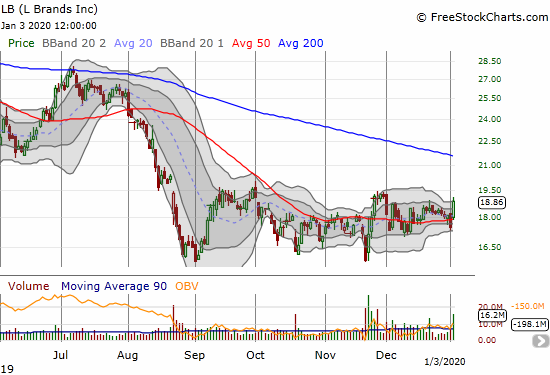
L Brands (LB)
L Brands (LB) had a rough 2019. In fact, the stock made an all-time high in late 2015 right around $100 (remember the power of $100!). So any inkling to buy LB has to be made for a short-term basis. LB has consolidated since August/September and is now pivoting around a flat 50DMA. This behavior has all the signature of a bottom in the making. While I prefer to bet on such a bottom after confirming a breakout, I think such a move will take the stock too close to its next challenge at the declining 200DMA. So instead, I am going to chase Friday’s 7.8% gain with a buy and stop-loss at a new 10+ year low.
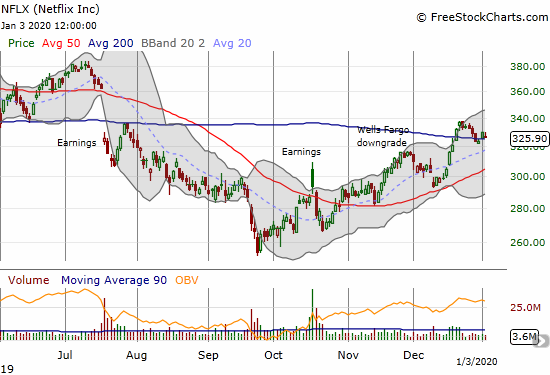
Netflix (NFLX)
Netflix (NFLX) lost 1.2% on Friday and closed at its 200DMA support. This small pullback is a chance to chase the growing upward momentum in NFLX for a cheaper price. I remain short with a small amount of shares, but I overloaded to the bullish side with call options.
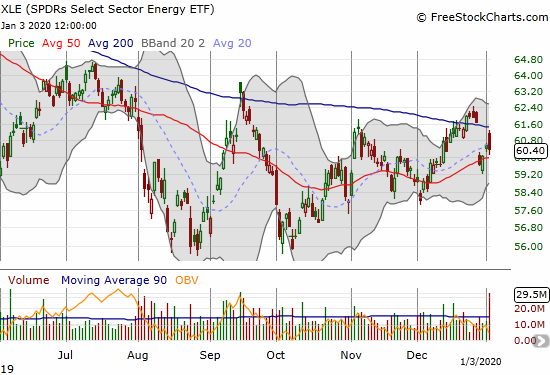
The SPDRS Select Energy ETF (XLE)
The energy sector keeps appearing in conversations about long-time underperformers. The lag represents a global glut in oil as the U.S. has become the world’s largest oil producer. XLE was only up 5.6% in 2019 and is well off 2019’s high of $68.50. XLE even opened the year with a gap down loss while the S&P 500 was in rally mode. XLE hit an all-time high in July, 2014 around $100 (there goes that power of $100 again!). I like being contrarian here and betting that the multi-year under-performance is overdue to produce some out-sized gains.
— – —
FOLLOW Dr. Duru’s commentary on financial markets via email, StockTwits, Twitter, and even Instagram!
“Above the 40” uses the percentage of stocks trading above their respective 40-day moving averages (DMAs) to assess the technical health of the stock market and to identify extremes in market sentiment that are likely to reverse. Abbreviated as AT40, Above the 40 is an alternative label for “T2108” which was created by Worden. Learn more about T2108 on my T2108 Resource Page. AT200, or T2107, measures the percentage of stocks trading above their respective 200DMAs.
Active AT40 (T2108) periods: Day #240 over 20%, Day #79 over 30%, Day #54 over 40%, Day #21 over 50%, Day #13 over 60% (overperiod), Day #67 under 70%
Daily AT40 (T2108)
")
Black line: AT40 (T2108) (% measured on the right)
Red line: Overbought threshold (70%); Blue line: Oversold threshold (20%)
Weekly AT40 (T2108)

*All charts created using FreeStockCharts unless otherwise stated
The T2108 charts above are my LATEST updates independent of the date of this given AT40 post. For my latest AT40 post click here.
Be careful out there!
Full disclosure: long VIXY calls, long UVXY calls, long RRGB, long QSR, long BIDU call spread, long IQ, short NFLX shares and long NFLX calls, long NLSN calls
*Charting notes: FreeStockCharts stock prices are not adjusted for dividends. TradingView.com charts for currencies use Tokyo time as the start of the forex trading day. FreeStockCharts currency charts are based on Eastern U.S. time to define the trading day.