
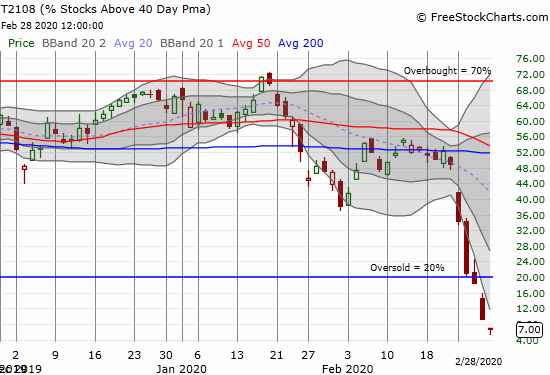
AT40 = 7.0% of stocks are trading above their respective 40-day moving averages (DMAs) (oversold day #3, dropped as low as 5.1%)
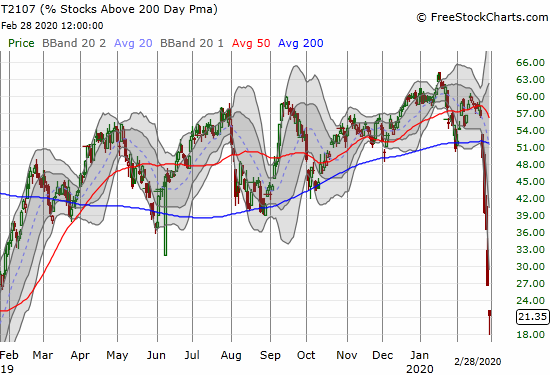
AT200 = 21.4% of stocks are trading above their respective 200DMAs (13-month low, dropped as low as 17.8%)
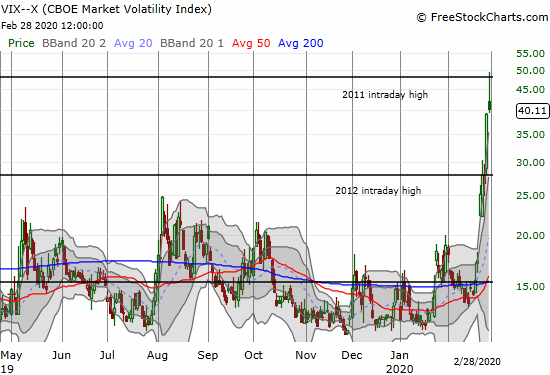
VIX = 40.1 (was as high as 49.5%)
Short-term Trading Call: bullish
Stock Market Commentary
Oversold
I had planned to sit on my hands for Friday’s trading, but even more extreme trading conditions motivated me to act. The market started with a gap down which meant that the extremes of the oversold period got yet more extreme. The volatility index (VIX) surged close to 50. The major indices and so many individual stocks were plunging even further below their lower Bollinger Bands (BBs). These moves are about as close as the stock market gets to a collapse without an outright economic calamity. The day ended up being a wild one, including a fortuitous love note from the Federal Reserve. At the end of the day, the S&P 500 (SPY) closed at its high of the day and formed a bottoming hammer pattern on the daily chart and a bottoming “shake and bake” on the intraday chart.
Before covering the charts of the indices, I will let AT40 (T2108), the percentage of stocks trading above their respective 40-day moving averages (DMAs), and AT200 (T2107), the percentage of stocks trading above their respective 200DMAs, set the stage.
The oversold period is only in day 3 and the relentless selling pressure rammed AT40 into single digits. AT40 actually got as low as 5.0% before closing at 7.0%. Recall that the sell-off in late 2018 also took AT40 to single digits before the stock market bottomed. AT40 closed at 3.6% on Christmas Eve in 2018.
AT200 put an exclamation point on the day’s damage by getting as low as 17.8% before closing at 21.4%. Note well that the late 2018 sell-off took T2107 down to a startling 8.0%. In other words, from a longer-term basis, this stock market is still healthier than it was in late 2018.
The Indices
On an intraday basis, the S&P 500 (SPY) created what I will call a “shake and bake” pattern. The metaphor is related to the old chicken meal prep that used seasonings in a bag for shaking the chicken before baking it. The metaphor refers to the shaking up and down on an intraday basis that encourages all the sellers to come out before their chicken gets popped into the oven for cooking. (The term is also used in sports to refer to someone getting faked out).
The gap down at the open followed up the previous day’s second derivative selling where an accelerating stampede rushed for the exits in the final 45 minutes. This awful open further heightened the sense of panic. Buyers finally stepped into the fray after an hour of selling. The index never traded lower. The Fed inserted itself between two bouts of fades and then buyers staked their claims in the last 15 minutes. The new line in the sand for maintaining support is now at 2860.
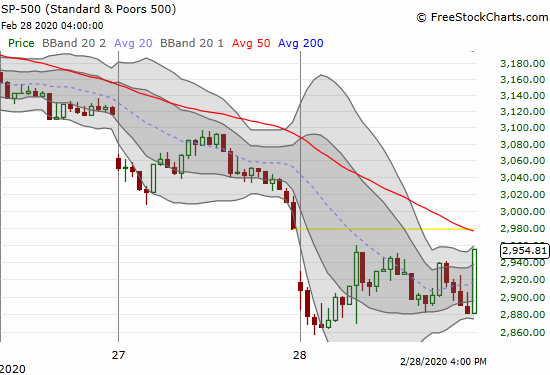
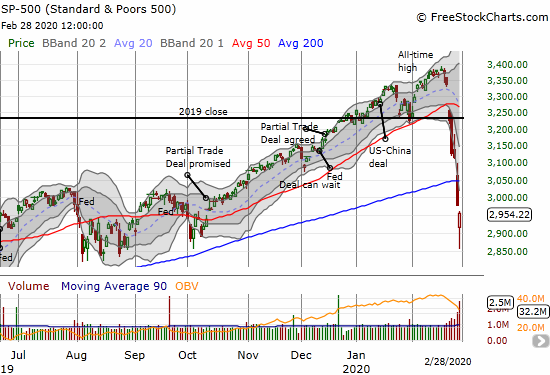
The shake and bake does a bottom make when combined with confirming factors. On the daily chart, the S&P 500 also made a hammer by leaving behind a tail at the lows and closing at its high. The counter argument is that the index also confirmed a 200DMA breakdown. However, I am not arguing for THE bottom; I am making the case for A bottom, albeit a significant one.
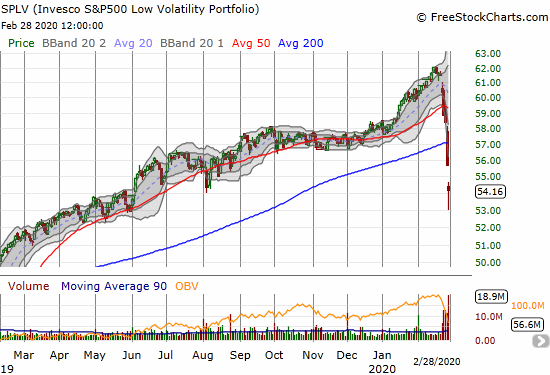
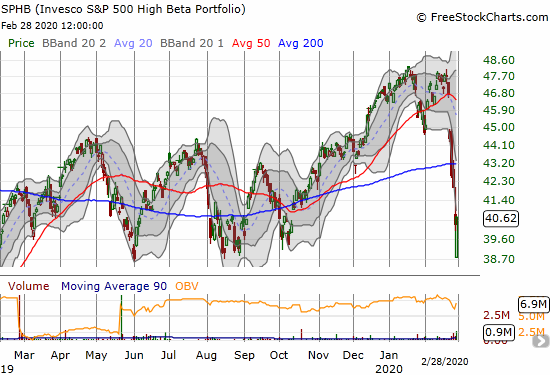
An interesting bullish divergence developed inside the S&P 500. The last time this happened it confirmed a fresh run-up in the index. The “safe” side of the index consisting of stocks in the Invesco S&P 500 Low Volatility ETF (SPLV) sold off 2.7% in a move that looks a lot like the overall index. Yet, the risky side of the S&P 500, the Invesco S&P 500 High Beta ETF (SPHB), managed to GAIN for the day. The combination very much looks like a rotation out of safer stocks and into the riskier stocks that were crushed in this sell-off. Both SPLV and SPHB bounced off critical support levels. Going into Friday’s trading, SPLV was down 9.5% and SPHB was down 13.8% for the week.
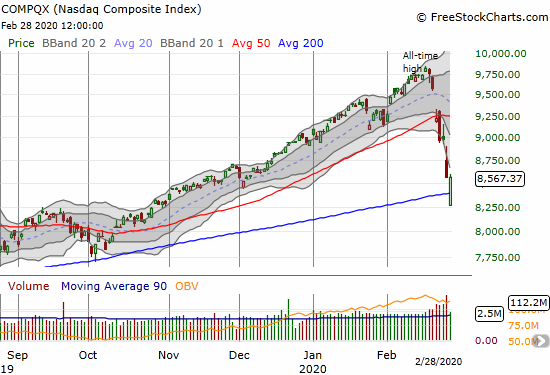
The NASDAQ (COMPQX) gapped down, rallied and never looked back. After the dust settled, the tech-laden index regained its 200DMA support. It could be the index that leads the charge upward in the coming days or weeks.
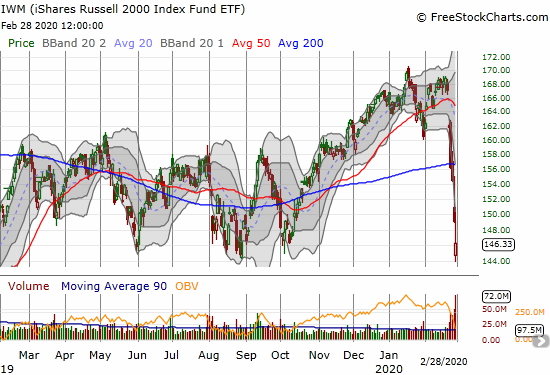
The iShares Russell 2000 Index Fund ETF (IWM) essentially hit the reset button last week. The index of small caps retested the bottom of last year’s trading range that found support at the May, August, and October lows.
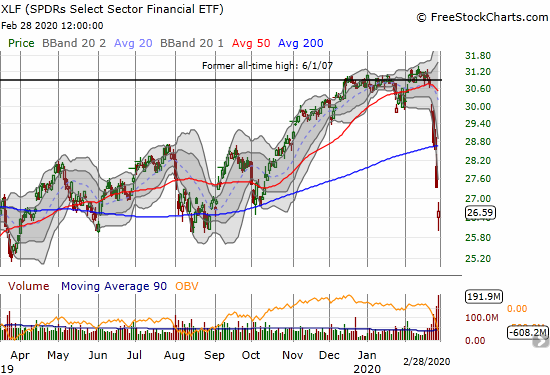
The SPDRS Select Sector Financial ETF (XLF) tested its low from last year’s May and August. The crescendo of selling looks like it cleared the way for a run at challenging 200DMA resistance.
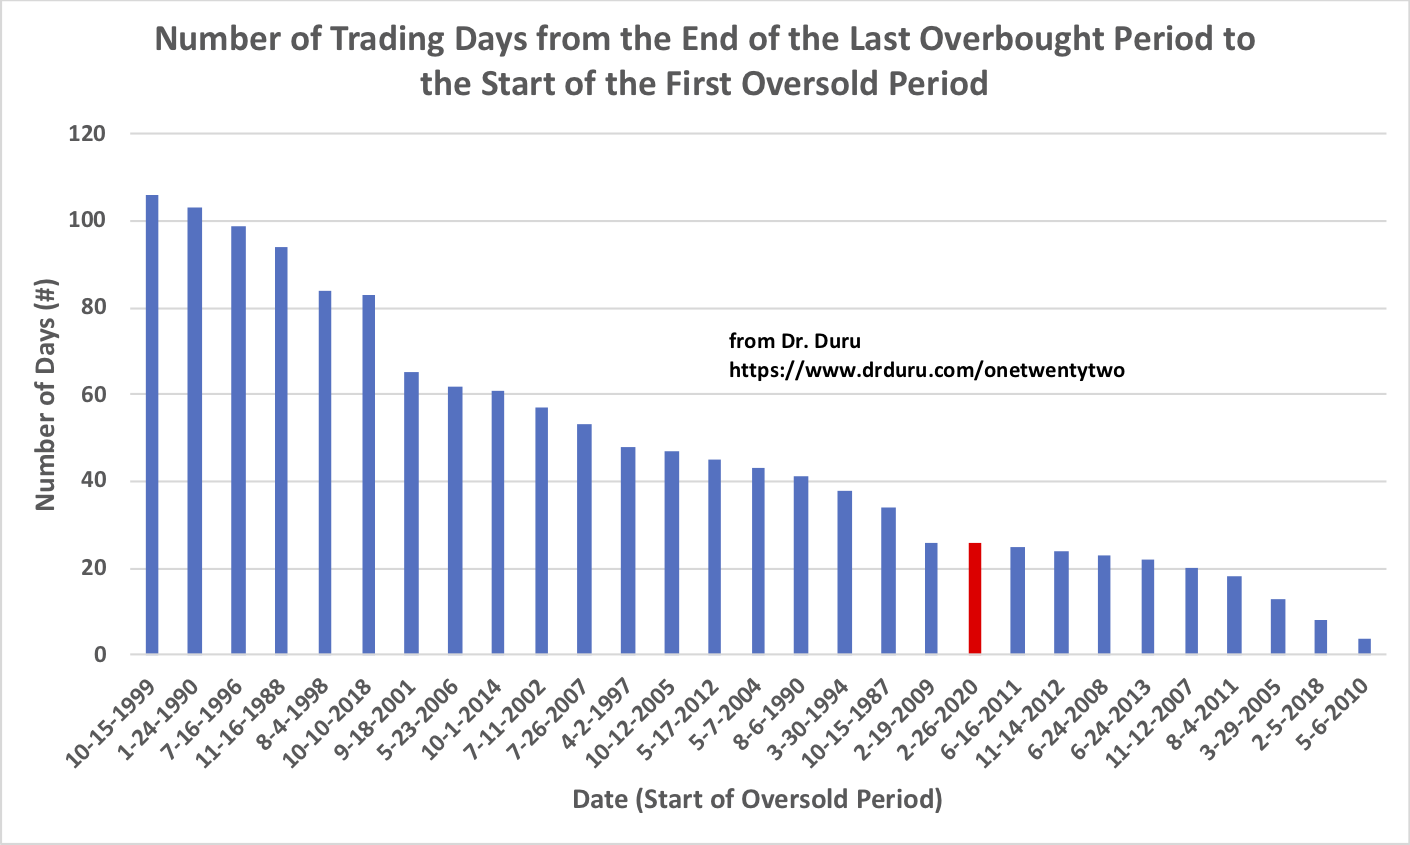
As fast as the market has fallen from overbought to deeply oversold, this is still not the fastest collapse. The chart below lays out the 29 times since 1986 (the extent of the data) where AT40 went straight from overbought to oversold and the number of trading days for the trip. The current sell-off is represented by the red bar. On the far right is the May, 2010 flash crash and the abrupt cool-down from the near parabolic run-up to start 2018.
Volatility
The volatility index (VIX) flared out in another sign of fear exhausting itself. The VIX almost got to 50 before fading to a near flat close.
The Short-Term Trading Call
In my previous Above the 40 post I planted my flag: “I changed my short-term trading call once again. I am now full out bullish even without the VIX dropping below 22…AT40 is in single-digits and the VIX is extremely extended to the upside. I have to stay focused on the bullish trading opportunities from here until at least after the stock market exits this extreme, second derivative oversold period.” I went into Friday’s trading prepared to do some opportunistic buying.
First of all with QQQ down to its 200DMA and down another 3.6%, I decided to take advantage of the soaring volatility to take profits on my “Armageddon” QQQ March 13 $190 put option. I left my other smattering of puts expiring this week alone. Still, I am “uncomfortably” bullish now and purposely so. I moved long-term money from cash and bonds into index funds. I loaded up on ProShares Ultra S&P 500 (SSO) shares. I made some trades on my seasonal strategy for home builder stocks. I added to my volatility fade with an SVXY call option. I even went back to the well on the Apple (AAPL) weekly call options strategy.
There is of course no guarantee what happened last week carved out THE bottom for this selling cycle. However, conditions got so extreme my AT40 trading strategy required leaning against fear and panic with buying. With a major wipe-out of months of gains in the indices, I had to put long-term money to work as well. Given fear is still very palpable and thick, I am bracing for sellers to retest Friday’s intraday low. If the low breaks, I will hit the “reset button” on the AT40 trading strategy…which essentially means waiting for the VIX to break through 50 and/or drop below a new support level.
An example of the prevailing fear is a Sunday evening article from Yahoo Finance that called a 1% decline in the futures a “plunge.” Given last week’s blood-letting, a 1% loss is practically a relief rally! I was joking with my trading mentor that the finance media had yet to produce stock photos of Wall Street traders in tears…which would be a good sign of a bottom. Well the Yahoo Finance article delivered (ok, close enough). If this combination is not A/THE bottom, it certainly rhymes!

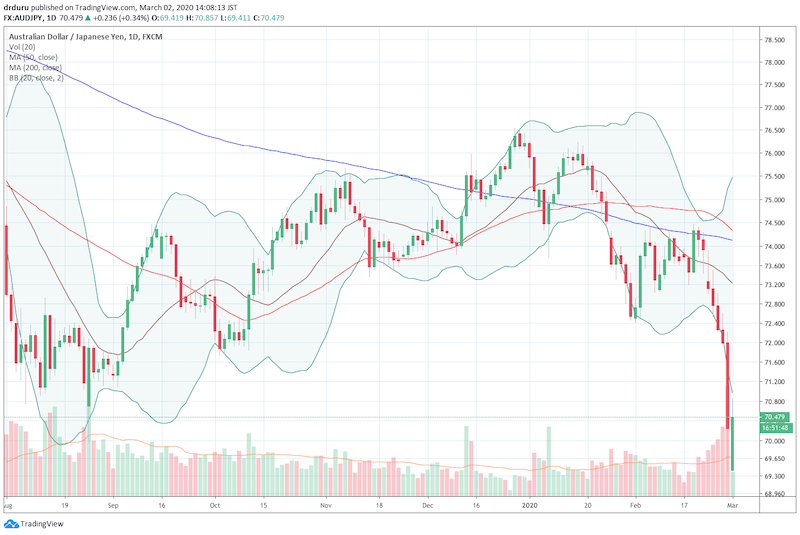
My eyes are closely watching the currency market instead of the headlines. I expect to see the Australian dollar (FXA) versus the Japanese yen (FXY) tell me everything I need to know about the changing risk attitudes in the market. At the time of writing AUD/JPY is trading sharply off a gap down open – one more ingredient for a shake and bake bottom. (For more details on the importance of AUD/JPY see Why the Australian Dollar and Japanese Yen Matter for Stock Traders).
Source: TradingView.com
Stock Chart Reviews – Below the 50DMA
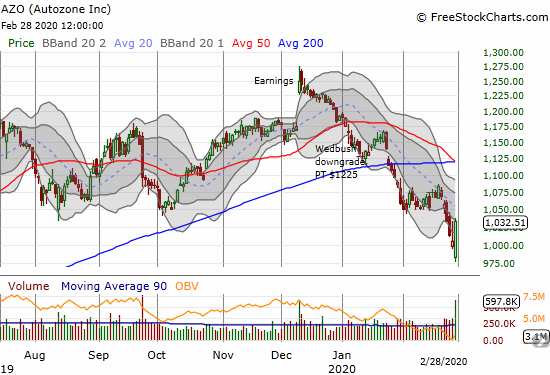
Autozone (AZO)
Just when I thought Autozone (AZO) was giving up the ghost to selling pressure, it surprised me with a nice reversal day on Friday. However, I am no hurry to rush to grow my position. This is a stock that has to prove its mettle to me with a confirmed 50 and 200DMA breakout. For a short-term trade, I would consider a call spread on a pullback toward Friday’s intraday low.
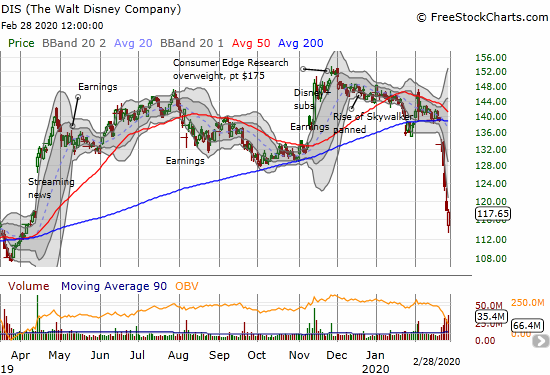
Disney (DIS)
I wrote earlier about using this opportunity to get into Disney (DIS) at prices I thought I would never see again. Every penny below $120 is a better bargain to me. I am accumulating shares and call options.
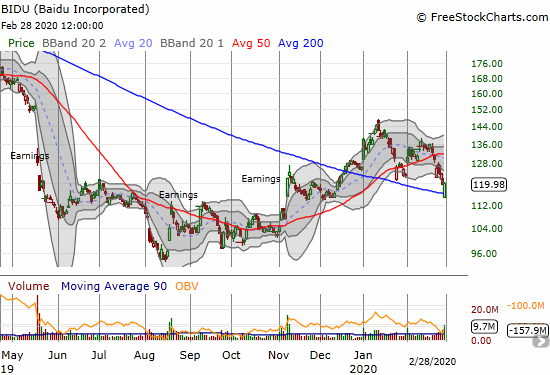
Baidu (BIDU)
I am keeping my eye on China-related stocks. I messed up my last call spread in Baidu (BIDU) by not taking profits. I bought a fresh call spread as a play off 200DMA support. This time around I will be keen to take profits when the time seems ripe.
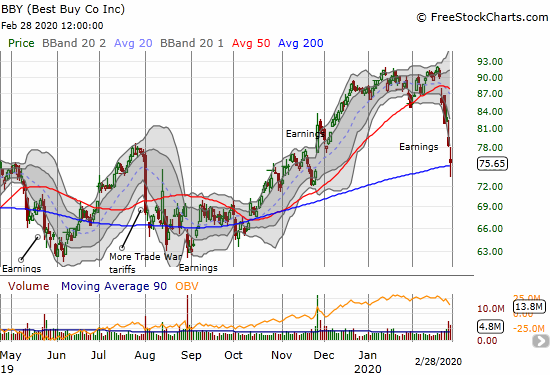
Best Buy (BBY)
Best Buy (BBY) reported earnings into the middle of the fray. I actually meant to short BBY when it broke down below its 50DMA ahead of earnings. Now, I am eyeing BBY for a buy if it can hold 200DMA support.
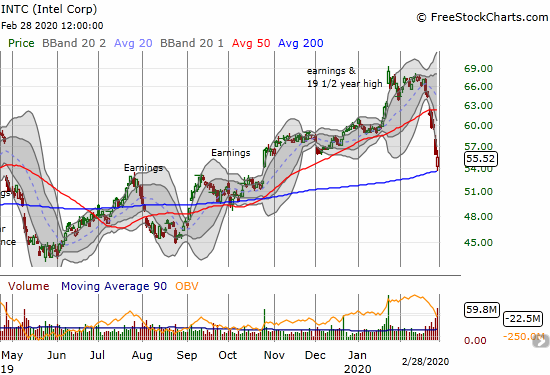
Intel (INTC)
I thought I was done trying the between earnings trade on Intel (INTC), but Friday’s bounce off 200DMA support during extreme oversold trading conditions has me interested again. INTC is back to the top of my shopping list.
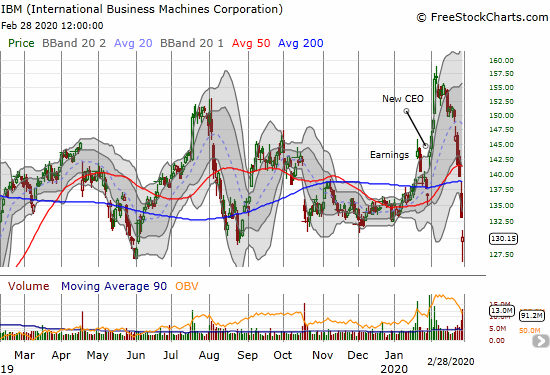
International Business Machines Corporation (IBM)
International Business Machines Corporation (IBM) has had a wild time since reporting earnings in January. The stock gapped up, completely reversed, tested 50DMA support before gapping up again on CEO news, and ramped parabolically from there. The market sell-off has taken IBM right back to the bottom of 2019’s trading range. If the good earnings news and good vibes from the CEO change are worth anything, then IBM should rebound nicely in a market bounce from oversold conditions.
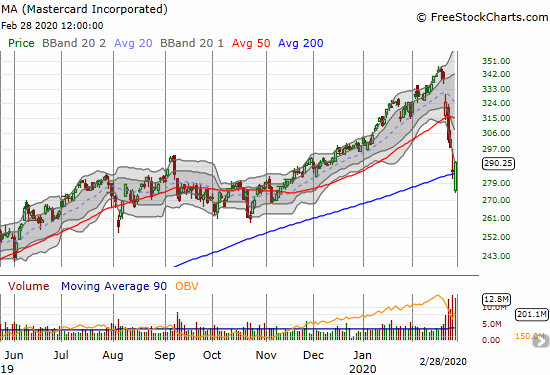
Mastercard Incorporated (MA)
When venerable and reliable companies like Mastercard Incorporated (MA) get thrown overboard, the trouble is indeed deep. MA sold off from its all-time high to Thursday by 17%. So perhaps no surprise that the trading bots went into buy mode when MA hit “bear market” territory with Friday’s 200DMA breakdown and gap down. MA is a buy here with a tight stop below Friday’s intraday low of $273.55.
Stock Chart Reviews – Above the 50DMA
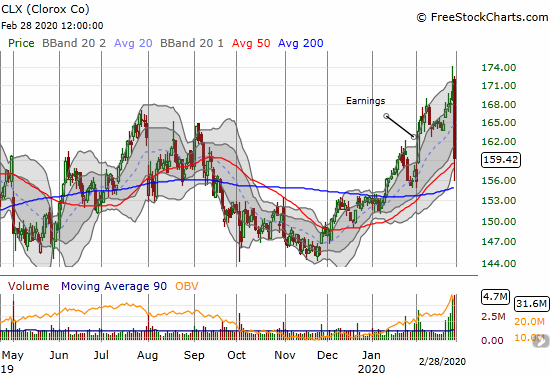
Clorox (CLX)
In my last Above the 40 post I claimed that Clorox (CLX) likely topped out. Sure enough, CLX confirmed Thursday’s topping pattern with a vicious bearish engulfing pattern and 5.5% loss. I looked for, and could not find, specific news to explain the reversal. However, I took note that apparently disinfectants are just a small part of the personal battle against viruses. More important is simply washing your hands and avoiding touching your face before washing your hands. Moreover, CLX is just plain expensive at 27 trailing and 28 forward P/Es. Clorox has quarterly earnings growth of less than 2%.
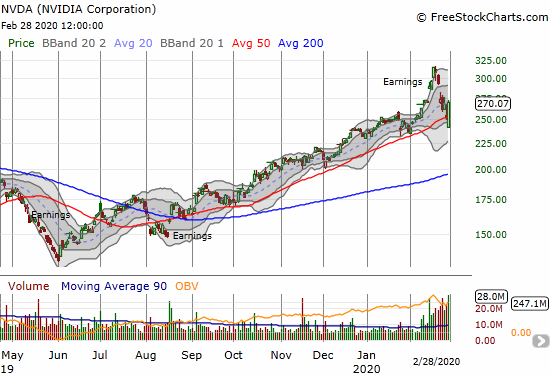
NVIDIA (NVDA)
NVIDIA (NVDA) put on a show Friday with a major bullish engulfing reversal that defended 50DMA support. Maybe for its next trick, NVDA can even invalidate the topping pattern I identified over a week ago…
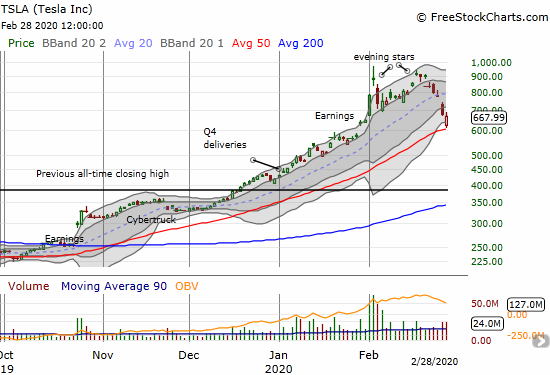
Tesla (TSLA)
I wrote bearishly about Tesla (TSLA) after it fell from its primary uptrend. The stock already looks enticing again with a decent defense of 50DMA support on Friday. TSLA is back on the shopping list, but I am afraid the stock may ramp hard and fast right from Monday’s open.
— – —
FOLLOW Dr. Duru’s commentary on financial markets via email, StockTwits, Twitter, and even Instagram!
“Above the 40” uses the percentage of stocks trading above their respective 40-day moving averages (DMAs) to assess the technical health of the stock market and to identify extremes in market sentiment that are likely to reverse. Abbreviated as AT40, Above the 40 is an alternative label for “T2108” which was created by Worden. Learn more about T2108 on my T2108 Resource Page. AT200, or T2107, measures the percentage of stocks trading above their respective 200DMAs.
Active AT40 (T2108) periods: Day #3 under 20% (oversold day #3), Day #4 under 30%, Day #15 under 40%, Day #6 under 50%, Day #25 under 60%, Day #29 under 70%
Daily AT40 (T2108)
")
Black line: AT40 (T2108) (% measured on the right)
Red line: Overbought threshold (70%); Blue line: Oversold threshold (20%)
Weekly AT40 (T2108)

*All charts created using FreeStockCharts unless otherwise stated
The T2108 charts above are my LATEST updates independent of the date of this given AT40 post. For my latest AT40 post click here.
Be careful out there!
Full disclosure: long IWM calls, long AUD/JPY, long QQQ call spread, long SVXY call, long AAPL calls, long UVXY puts, long BIDU call spread, long NVDA call spread, long AZO, long DIS calls and shares, long INTC calls, long SSO, long TSLA call
*Charting notes: FreeStockCharts stock prices are not adjusted for dividends. TradingView.com charts for currencies use Tokyo time as the start of the forex trading day. FreeStockCharts currency charts are based on Eastern U.S. time to define the trading day.