
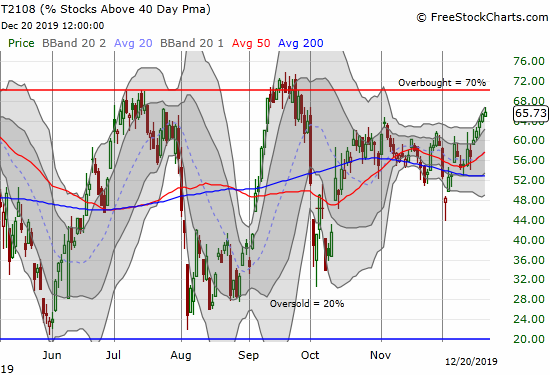
AT40 = 65.7% of stocks are trading above their respective 40-day moving averages (DMAs)
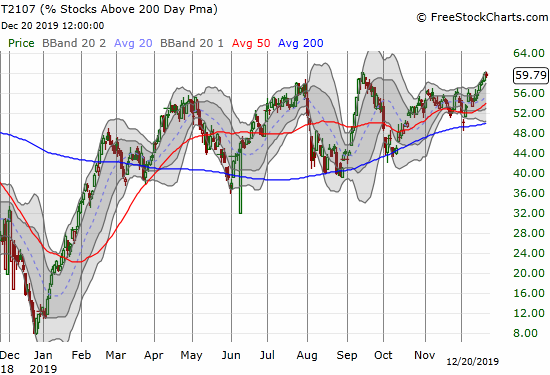
AT200 = 59.8% of stocks are trading above their respective 200DMAs (just under high for 2019 of 60.2%)
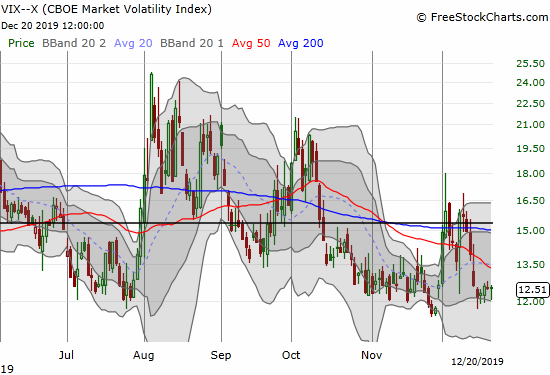
VIX = 12.5
Short-term Trading Call: neutral
Stock Market Commentary
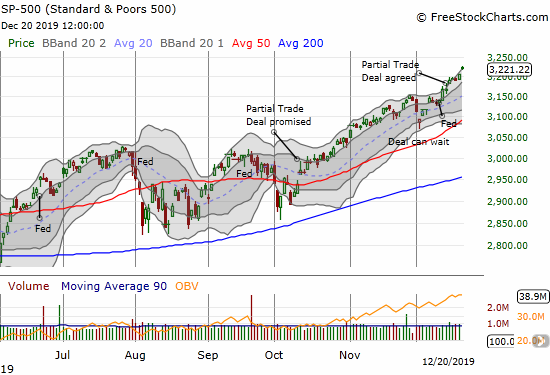
The bearish divergence finally ended between a range-bound AT40 (T2108) and an S&P 500 (SPY) steadily melting higher. AT40, the percentage of stocks trading above their respective 40-day moving averages (DMAs), broke out of a two-month range that was locked in place ever since the promise of a partial Phase One trade deal was announced. That range kept my enthusiasm for the stock market well in-check. AT40 has finally confirmed the latest bullish run in the stock market. Up next, a challenge of the overbought threshold at 70%.
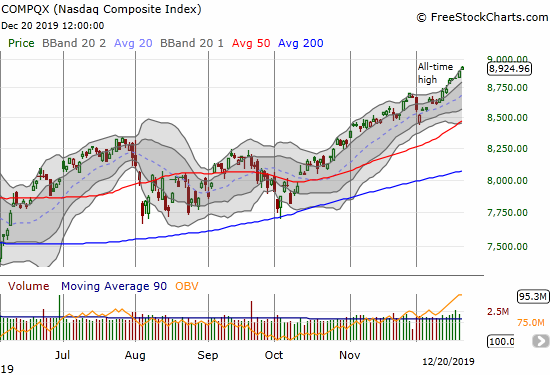
The NASDAQ (COMPQX) is of course floating higher and higher as well.
As luck would have it, I have new reasons to curb my enthusiasm and maintain a neutral short-term trading call. The first dose of cold water is AT200 (T2107), the percentage of stocks trading above their respective 200DMAs. AT200 stopped cold at its high of the year. A breakout for T2107 will be key for me to finally flip bullish and buy-in on the charts which suggest a whole new bull market is around the corner.
My second reason for pause is volatility.
Volatility
The volatility index (VIX) drifted higher for the week. This resilience may be related to the quadruple witching on Friday, a day on which traders fear a lot of unexpected things can happen. This time around, the day was just another up day in the stock market. I will be looking for complacency to resume its drift downward to confirm bullish sentiment. Otherwise, I suspect another big spike is awaiting by the start of the new year.
The Short-Term Trading Call
With the bearish divergence now in the rearview mirror, overbought conditions loom overhead. The proximity of the 70% threshold for AT40 is one more reason to stay neutral. If AT40 fails to break through, by rule, I will flip bearish. If AT40 launches into overbought territory, I will look to the other signals to decide whether to flip (cautiously) bullish. I am particularly interested in seeing AT200 breakout and hold the breakout.
Stock Chart Reviews – Below the 50DMA
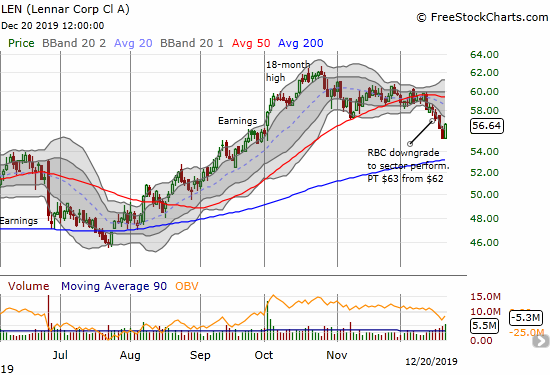
Lennar (LEN)
Home builders are rolling over and further confirming the under-performance of the sector. Lennar (LEN) is one of the several stocks definitively suffering. Until the big surge on Friday, LEN sold off 5 of the last 6 days on the way to confirming a bearish 50DMA breakdown. A downgrade from RBC helped to grease the skids. However, with a price target that is still higher than current levels, I am keeping an eye on LEN as a discounted play on the seasonally strong period for the stocks of home builders.
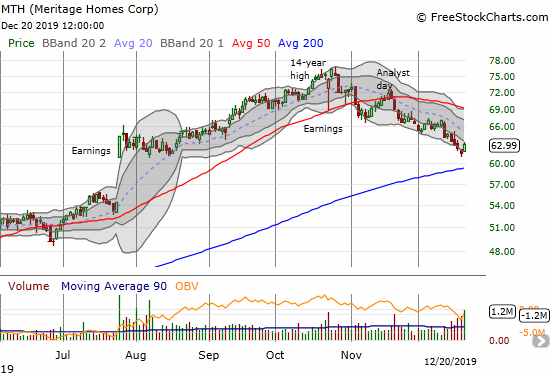
Meritage Homes (MTH)
Meritage Homes (MTH) has steadily sold off since hitting a 14-year high in October. It rolled over ahead of the general rollover for the stocks of home builders. If MTH is going to participate in a rebound for the sector, it has to start around current levels. MTH is back to its post-earnings open back in July and support from its 200DMA waits below. I still have on my to-do list a read through the presentation from November’s analyst day.
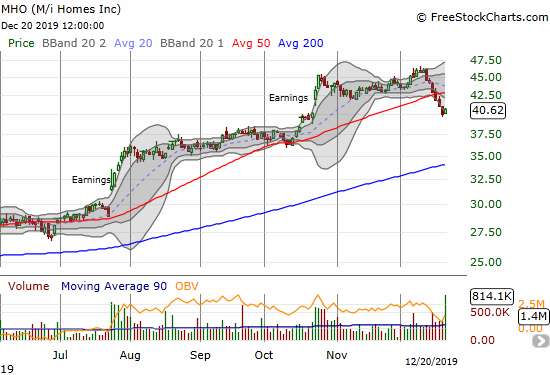
M/I Homes (MHO)
M/I Homes (MHO) finished a complete reversal from its October earnings. After this bearish move, I am content to wait for MHO to at least return to the August to October consolidation period. I am still overall bullish on MHO from its July earnings.
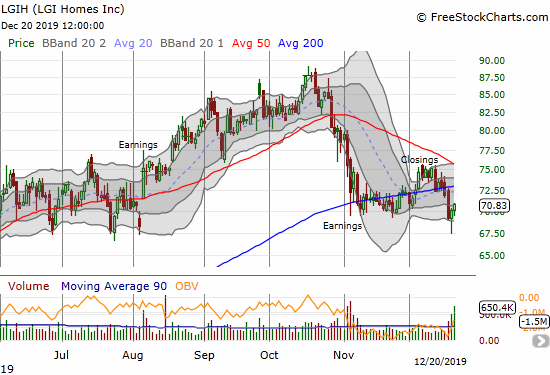
LGI Homes (LGIH)
I bought a small number of shares in LGI Homes (LGIH) based on the company’s bullish closings report and the seasonally strong period. The lift did not last long. Last week, LGIH even traded down to a 4+ month low before rebounding. With the fresh 200DMA breakdown, overhead resistance from a declining 50DMA looks more ominous. I will have to abandon ship if LGIH closes below last week’s low. I would treat such a move as further confirming the roll-over in the housing sector.
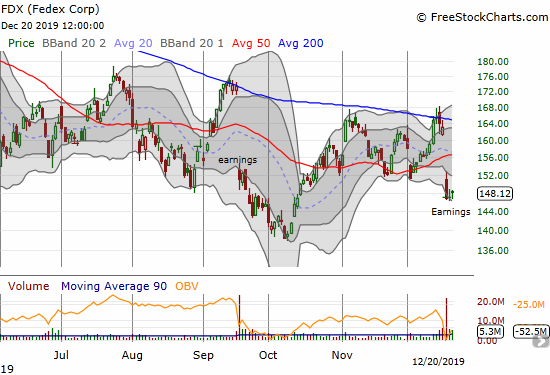
Federal Express (FDX)
Federal Express continues to underperform. The stock failed at 200DMA resistance after another post-earnings gap down. Now the countdown begins for a retest of the October low.
Stock Chart Reviews – Above the 50DMA
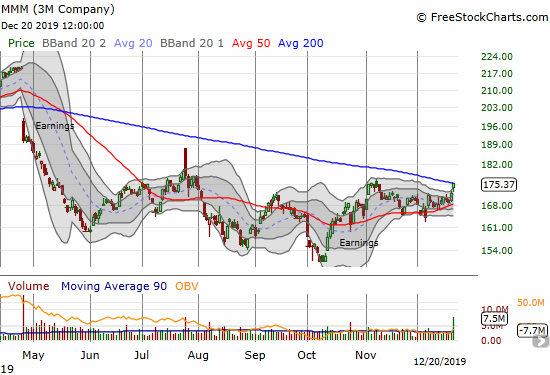
3M Company (MMM)
3M Company (MMM) is a 200DMA breakout away from becoming one of my favorite “value” stocks for 2020. MMM has suffered large market under-performance since a post-earnings breakdown in April. Outside a new low in October, MMM has consolidated fr almost 7 months. A (confirmed) 200DMA breakout would be very bullish.
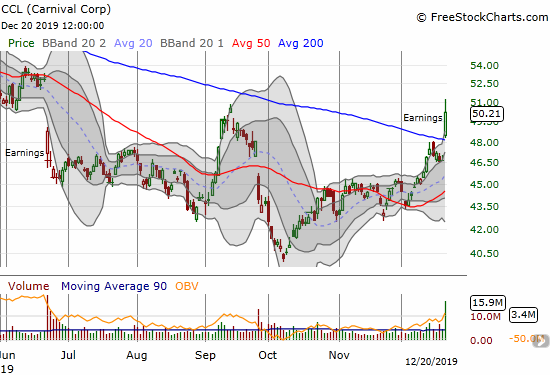
Carnival Corp (CCL)
Carnival Corp (CCL) printed an impressive post-earnings 200DMA breakout on Friday. I will be accumulating this stock even ahead of a confirmation with a higher close. The stock has a natural stop-loss below the 200DMA which coincides with the post-earnings open.
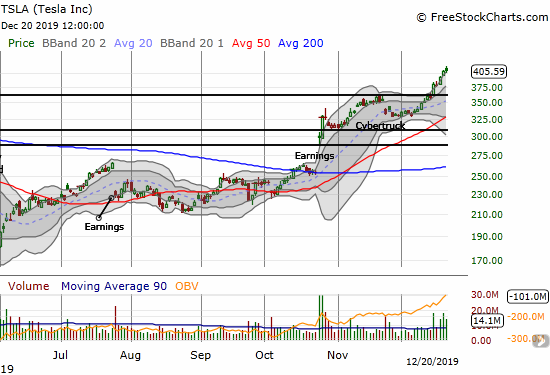
Tesla (TSLA)
Tesla (TSLA) is riding a rocket. All December, buyers loaded up near relentlessly. All my call options plays turned nice profits, and I have even taken some profits far too early. The downside is that my hedged short position has dampened the overall net. At this point, I will just continue with the current trading strategy. I am assuming TSLA is making a beeline to $420, a level that of course still holds a lot of symbolic significance.
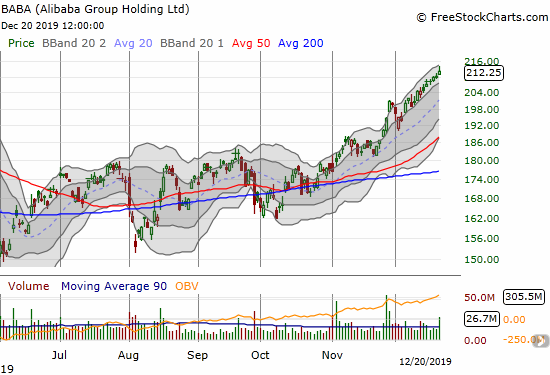
Alibaba Group Holdings (BABA)
Alibaba Group Holdings (BABA) has clearly benefited from the reduction in trade tensions between the U.S. and China. The chart says it all. BABA closed the week at an all-time high.
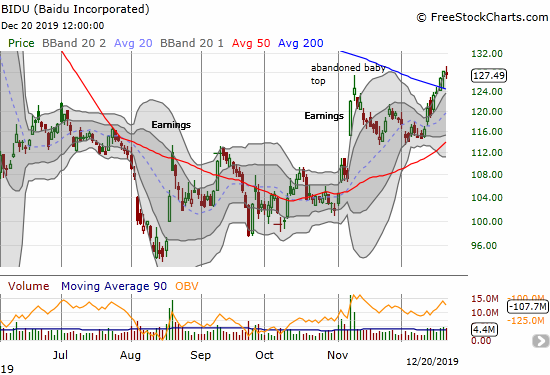
Baidu (BIDU)
Baidu (BIDU) is also on the buy list again. BIDU finally invalidated its post-earnings abandoned baby top with a confirmed 200DMA breakout. I like the upside potential with BIDU topping out above $280 last year.
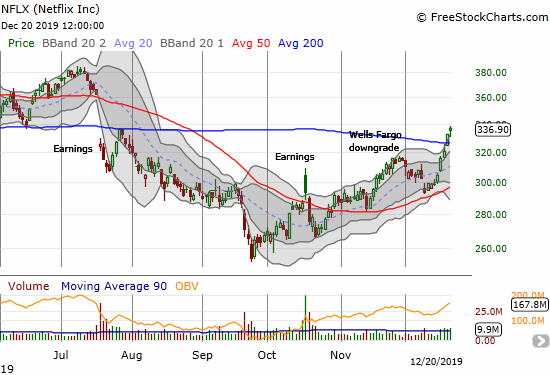
Netflix (NFLX)
Netflix (NFLX) has proven resilient, and I failed to take that toughness seriously enough. Instead of looking forward to adding to my small short at 200DMA resistance, I should have braced for a 200DMA breakout. NFLX is in a bullish position – especially with the rush past the point of a major downgrade, so I am forced to make the switch from bear to bull now!
— – —
FOLLOW Dr. Duru’s commentary on financial markets via email, StockTwits, Twitter, and even Instagram!
“Above the 40” uses the percentage of stocks trading above their respective 40-day moving averages (DMAs) to assess the technical health of the stock market and to identify extremes in market sentiment that are likely to reverse. Abbreviated as AT40, Above the 40 is an alternative label for “T2108” which was created by Worden. Learn more about T2108 on my T2108 Resource Page. AT200, or T2107, measures the percentage of stocks trading above their respective 200DMAs.
Active AT40 (T2108) periods: Day #232 over 20%, Day #71 over 30%, Day #46 over 40%, Day #9 under 50% (overperiod), Day #19 under 60% (underperiod), Day #59 under 70%
Daily AT40 (T2108)
")
Black line: AT40 (T2108) (% measured on the right)
Red line: Overbought threshold (70%); Blue line: Oversold threshold (20%)
Weekly AT40 (T2108)

*All charts created using FreeStockCharts unless otherwise stated
The T2108 charts above are my LATEST updates independent of the date of this given AT40 post. For my latest AT40 post click here.
Be careful out there!
Full disclosure: long VIXY calls, long LGIH, short NFLX, long TSLA call spread and short shares
*Charting notes: FreeStockCharts stock prices are not adjusted for dividends. TradingView.com charts for currencies use Tokyo time as the start of the forex trading day. FreeStockCharts currency charts are based on Eastern U.S. time to define the trading day.