
AT40 = 52.4% of stocks are trading above their respective 40-day moving averages (DMAs)
AT200 = 48.1% of stocks are trading above their respective 200DMAs
VIX = 15.6
Short-term Trading Call: cautiously bearish
Stock Market Commentary
A Broad-Based Re-Entry
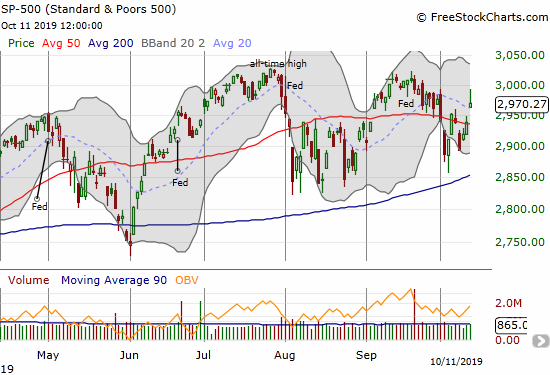
Two Fridays ago, buyers took the S&P 500 (SPY) back above its 50-day moving average (DMA). It was yet more evidence that the bull market was still very much alive. AT40 (T2108), the percentage of stocks trading above their respective 40-day moving averages (DMAs), recovered sharply from a trip to 30%, a level which tends to hold as a low when buyers are eager to buy the dip. Last week, sellers turned the pressure back on in the face of negative trade headlines. AT40 closed at 34.0% on Tuesday, and the S&P 500 (SPY) stopped just short of its closing low the previous week. Neither index looked back from there as the week ended with a celebration over a partial, “Phase One”, trade deal between the U.S. and China. The S&P 500 was a picturesque display of partial optimism with a gap higher, a rush to intraday highs, and a fade back toward the initial open.
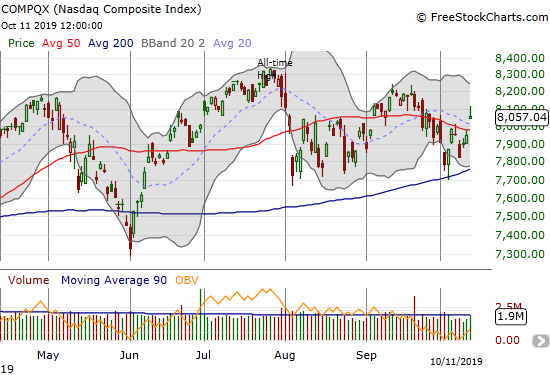
The NASDAQ (COMPQX) added to the partial optimism with a 50DMA breakout and a 1.3% gain after a sharp fade from the intraday high.
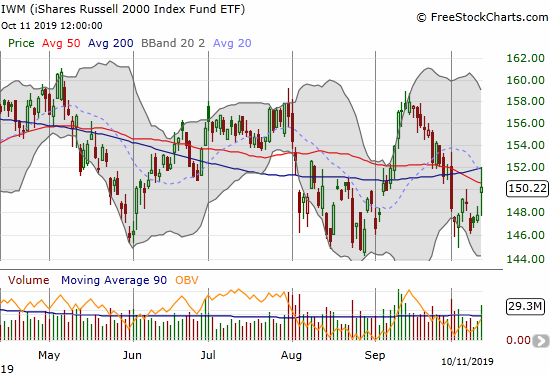
The iShares Russell 2000 Index Fund ETF (IWM), constantly the laggard, scored the largest percentage gain of 1.7%, but it failed to close above its major moving averages. At one point, this index of small cap stocks even closed its entire gap up. IWM delivered partial optimism with sprinkles of skepticism.
Volatility
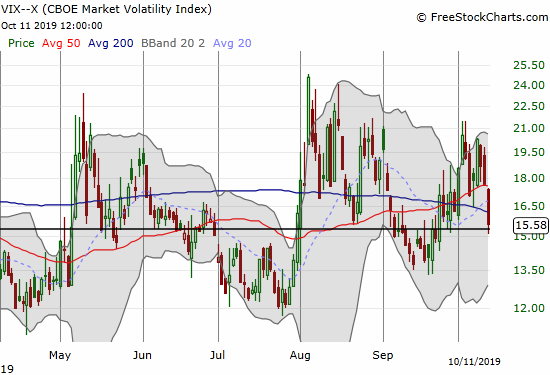
The volatility index (VIX) plunged as the market breathed a collective sigh of relief. The 15.35 pivot held for the day, setting up the potential for a rebound on Monday.
Partial deal, partially unconvinced
The partial trade deal is the perfect signature for the on-going Trade War drama between the U.S. and China. The deal has all the look of window dressing at the lowest common denominator of possible agreement. President Trump went from insisting on a complete and comprehensive deal to settling for this partial deal. In the wake of this half step, Trump even talked up the merits of creating a “Phase One” of a multi-phase Trade War. This kind of deal is a great setup for more drama, more disagreements, more insults, and ultimately few near-term accomplishments except additional volatility in the stock market. Phase One did not roll back existing tariffs and did not deliver to the U.S. any incremental gains. Essentially, the U.S. just agreed to forestall the tariffs threatened for next week, and China agreed to buy agricultural products it was already buying before the Trade War (there is some kind of “acceleration” to $40-50B of purchases in the next two years). The deal is not even written and signed yet.
The trading day started with rumors of the partial deal, and I was quite surprised that the S&P 500 was able to soar to a 1.9% gain. That gain seemed large enough to create a “sell-the-news” moment. After all, the rush to get a partial deal seemed unlikely to generate a deal of substance. I tentatively bought SPY put options expiring Wednesday specifically targeted for a sell-the-news move. I did not want to buy into a lot of premium on that kind of speculation; I also did not want to buy the puts expiring Monday as I feared the premium could completely deflate even on a weak open. If I had anticipated the potential for a sharp fade into the close, I probably would have just taken the profits on the put options at the close.
My short-term trading call stays at cautiously bearish despite the S&P 500 marginally confirming its Thursday 50DMA breakout. Friday’s fade from the intraday high left intact an ominous build-up of resistance at the September highs which in turn failed to break the all-time high set in July. I now need to see buyers overcome what is called a bearish shooting star candlestick pattern. I also want to see the NASDAQ confirm its 50DMA breakout with a close above its intraday high. also a shooting star. I want to see IWM breakout above its 200DMA and confirm the move. In other words, I am fully skeptical even as I was tentative on my one bearish trade in the post-partial-phase-one era.
Stock Chart Reviews – Below the 50DMA
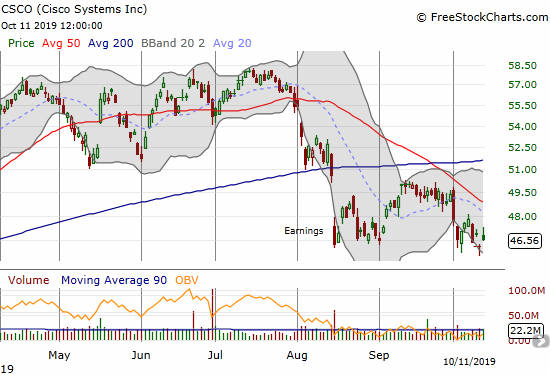
Cisco (CSCO)
The struggles continue for Cisco (CSCO) after its post-earnings disappointment in August. Last week the stock gapped down and closed right at its post-earnings low. Friday’s 0.9% gain looks tepid and unconvincing.
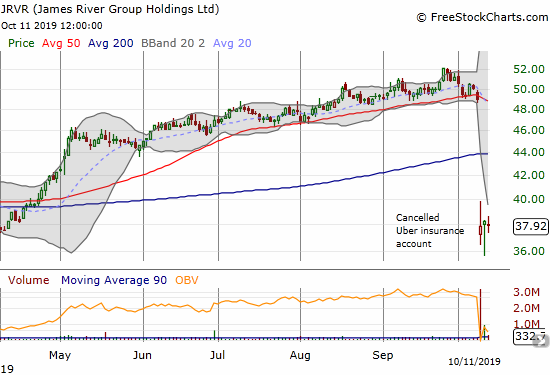
James River Group Holdings (JRVR)
James River Group Holdings (JRVR) had a rough week. The stock lost 22.6% on news the company cancelled an insurance policy with Uber. Apparently, Uber is its largest customer. I am intrigued by this stock for its potential to rebound to 200DMA resistance. A fresh post-earnings closing low makes the stock a short.
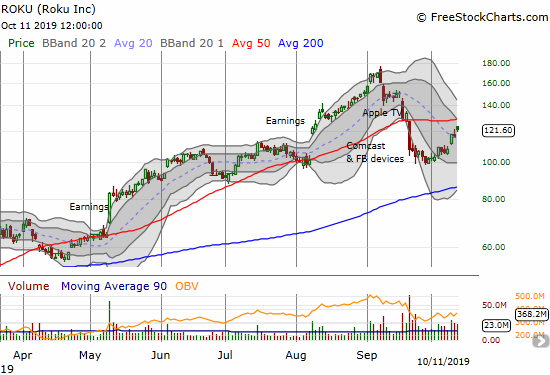
Roku (ROKU)
Roku (ROKU) hit my downside target of $100. The move was a perfect fill of the post-earnings gap up in August. The stock then made a textbook bounce as a part of a relief rally. Analysts have been all over ROKU, particularly in the last week, with upgrades and positive vibes. The convergence of good words certainly supported the relief rally. The moment of truth is near with the stock trading just below 50DMA resistance. Given the stock is up 20% in just two weeks, I am expecting some kind of pullback here before the stock makes a strong challenge of resistance.
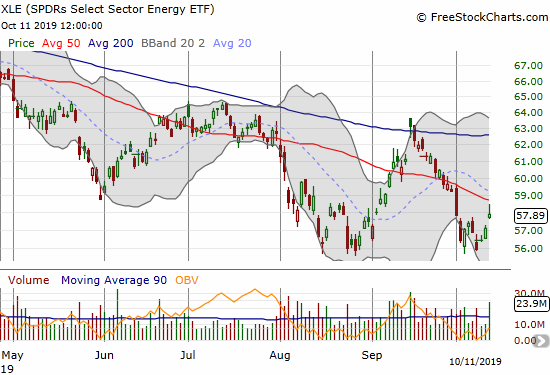
SPDRS Select Energy ETF (XLE)
After staring at XLE almost daily on its way down from last month’s 200DMA resistance, it took a regular reader to remind me to buy XLE call options off XLE’s bottom. The SPDRS Select Energy ETF (XLE) faithfully held the August low and rebounded nicely. I took profits at the declining 50DMA resistance.
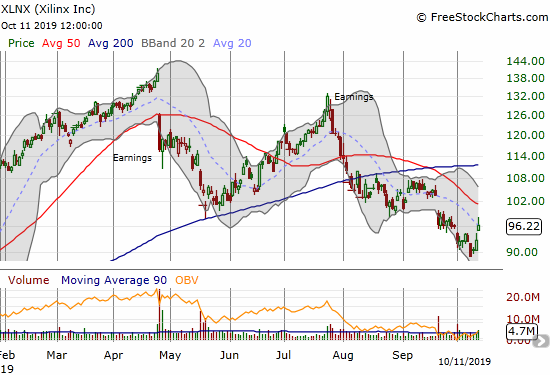
Xilinx (XLNX)
Xilinx (XLNX) has continued to suffer weakness since the fade from an initially strong post-earnings gain in July. I took the stock off my radar after it broke 200DMA support. The stock is back on my radar after a complete reversal of its January post-earnings gain. At that time, XLNX jumped from $89.55 for an 18% gain. XLNX gained another 31.7% from there before gapping down after April earnings.
Stock Chart Reviews – Above the 50DMA
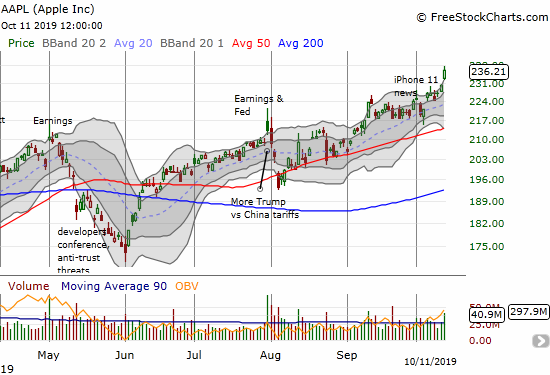
Apple (AAPL)
On a day that left me skeptical, Apple (AAPL) was one of the most convincing stocks I saw. AAPL gained 2.7% and barely faded off its intraday high despite stretching well above its upper Bollinger Band (BB). I failed to make my weekly call option play ahead of the surge, so I reluctantly bought a calendar call spread at the open with a $235 strike. Perhaps I should have aimed higher!
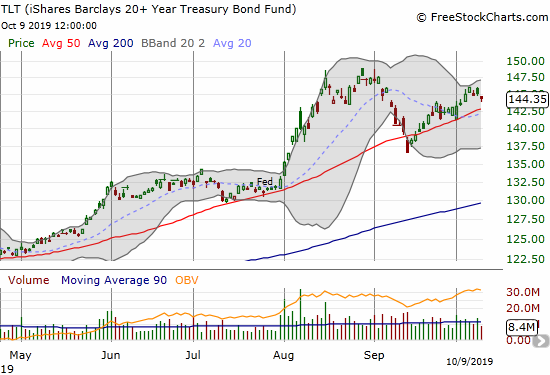
iShares Barclays 20+ Year Treasury Bond Fund (TLT)
Given my skepticism, I used the dip in the iShares Barclays 20+ Year Treasury Bond Fund (TLT) as a buying opportunity. I am just assuming that long-term interest rates will continue trending lower (TLT higher) as a slowdown in global growth continues to weigh on rates no matter what the Federal Reserve says or does. The interview below is a great discussion about the prospects for a recession from the man who wrote the dissertation on the meaning of an inverted yield curve: Dr. Cam Harvey, Research Affiliates partner and Duke Fuqua School of Business professor of finance.
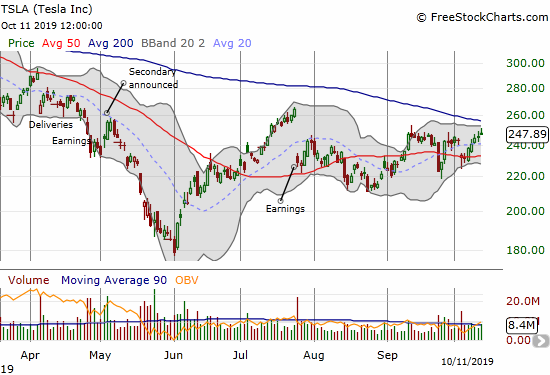
Tesla (TSLA)
The trading in Tesla (TSLA) is tightening and confounding my updated trading strategy on the stock. For TSLA longs, this looks like a good spot for selling a call against the position. TSLA bears should brace for a 200DMA breakout. I will reset the trading strategy based on TSLA’s next decisive move.
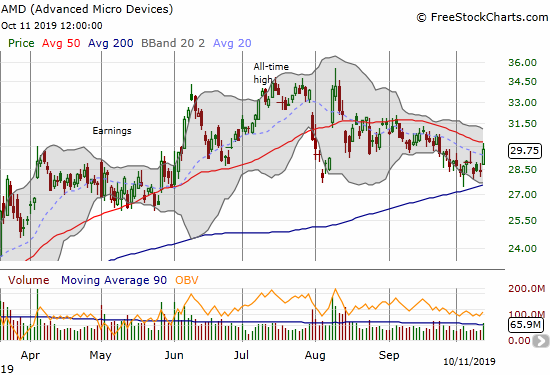
Advanced Micro Devices (AMD)
Advanced Micro Devices (AMD) spent September dribbling away from 50DMA resistance. The stock finally stabilized a bit after nearly touching 200DMA support in early October. I am on alert with the stock popping on Friday for a 4.8% gain. I am a buyer on a 50DMA breakout even without confirmation.
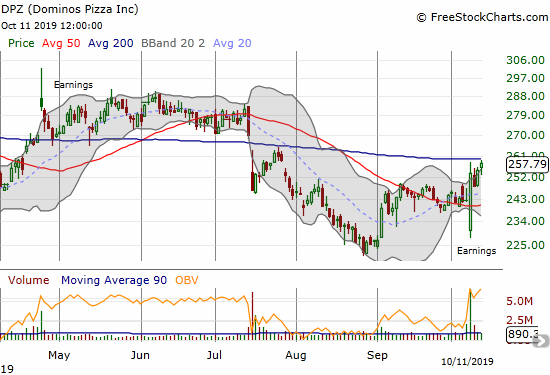
Dominos Pizza (DPZ)
Dominos Pizza (DPZ) had a wild week. DPZ gapped down 6.1% post-earnings. Buyers pounced and sent the stock high enough to close with a 4.7% gain. The balance of power clearly shifted back to the upside, and I expect a buyable 200DMA breakout in due time.
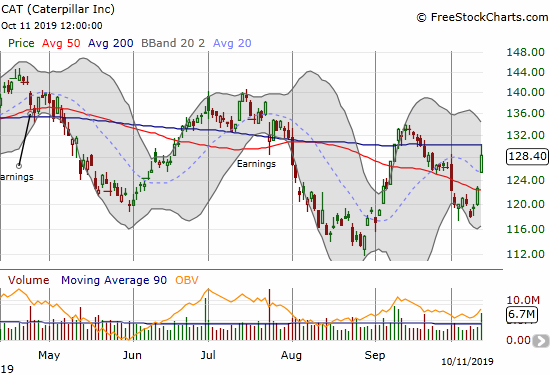
Caterpillar (CAT)
Caterpillar (CAT) stood to gain even from a nothing burger of a trade deal, and the stock delivered. CAT gained 4.7% even after a fade from 200DMA resistance. I was tempted to refresh CAT puts. Instead, I decided to wait to see more weakness. CAT flips bullish if it can close above last month’s high.
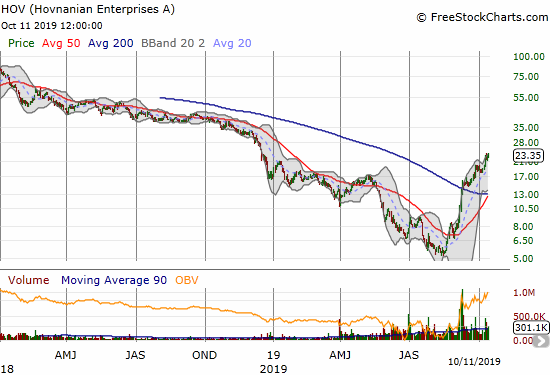
Hovnanian Enterprises (HOV)
Hovnanian Enterprises (HOV) is still on an amazing streak. The stock is close to a 5x gain since the August all-time low. The stock is now back to where it traded during the financial crisis. I will have to pay attention to Hovnanian’s next earnings report in December to determine whether the company is really freshly viable or whether this aggressive rally is the result of contrary speculation. Note on July 17th, the New York Stock Exchange notified Hovnanian that the company is not in compliance with the continued listing standard “…because Hovnanian’s average global market capitalization was less than $50 million over a consecutive 30 trading-day period and its most recently reported stockholders’ equity was also less than $50 million.” Buyers are betting that Hovnanian’s petition with the NYSE will succeed.
— – —
FOLLOW Dr. Duru’s commentary on financial markets via email, StockTwits, Twitter, and even Instagram!
“Above the 40” uses the percentage of stocks trading above their respective 40-day moving averages (DMAs) to assess the technical health of the stock market and to identify extremes in market sentiment that are likely to reverse. Abbreviated as AT40, Above the 40 is an alternative label for “T2108” which was created by Worden. Learn more about T2108 on my T2108 Resource Page. AT200, or T2107, measures the percentage of stocks trading above their respective 200DMAs.
Active AT40 (T2108) periods: Day #188 over 20%, Day #27 over 30%, Day #2 over 40% (overperiod), Day #8 under 50% (underperiod), Day #9 under 60%, Day #15 under 70%
Daily AT40 (T2108)
")
Black line: AT40 (T2108) (% measured on the right)
Red line: Overbought threshold (70%); Blue line: Oversold threshold (20%)
Weekly AT40 (T2108)

*All charts created using FreeStockCharts unless otherwise stated
The T2108 charts above are my LATEST updates independent of the date of this given AT40 post. For my latest AT40 post click here.
Be careful out there!
Full disclosure: long TLT calls, long CAT puts, long SPY puts, long AAPL calendar call spread, long TSLA put, long ROKU puts and call spread
*Charting notes: FreeStockCharts stock prices are not adjusted for dividends. TradingView.com charts for currencies use Tokyo time as the start of the forex trading day. FreeStockCharts currency charts are based on Eastern U.S. time to define the trading day.