Stock Buyers Break Important Downtrend Only to Get Stymied Again – Above the 40 (April 30, 2021)

Stock Market Commentary Last week featured an intense barrage of earnings reports. The collective response on the major indices was a major yawn. The S&P 500 finished flat for the week. The NASDAQ and the iShares Trust Russell 2000 Index ETF both softened by 0.4%. Financials were a notable exception as the Financial Select Sector … Read more

Stock Buyers Snapped Back But Failed to Crack An Important Downtrend – Above the 40 (April 23, 2021)

Stock Market Commentary The week began with two straight days of selling for the stock market. Almost everything was in place for a real pullback. Although the S&P 500 (SPY) was less than 2% off its all-time high, my favorite measure of breadth in the stock market, AT40 (T2108), the percentage of stocks trading above … Read more

Another Swift Drop In Stocks Paved the Way for Fresh Buying Power – Above the 40 (February 24, 2021)

Stock Market Commentary The split personality of the stock market resolved into major breakdowns in the stock market on Tuesday…for about 30 minutes. Apparently increasing inflation fears gave way to the soothing words of Federal Reserve Chairman Jerome Powell at the Fed’s semiannual monetary policy report to Congress. Buyers quickly met the latest sharp and … Read more

Stock Market Battle Royale: Regime Change Or A Big, Bad Bubble? – Above the 40 (January 26, 2021)

Stock Market Commentary After the stock market ended its last overbought period, I hesitated to drop my short-term trading call back to bearish. Three days later and the market has yet to snap back into overbought trading conditions. As the major indices levitate, my favorite breadth indicator, AT40 (T2108), the percentage of stocks trading above … Read more

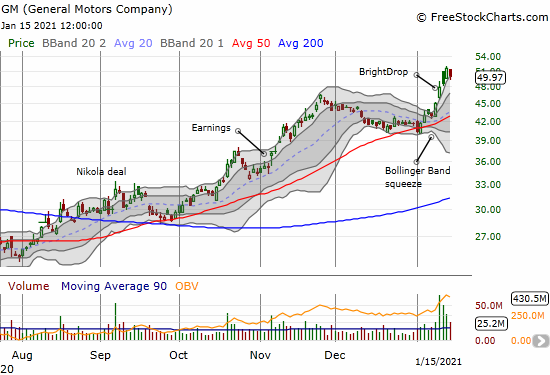
General Motors Stock: The Bollinger Bands Drop Before the BrightDrop

The General Motors Company (GM) launched sharply higher out of a Bollinger Band squeeze.

Bollinger Bands (BBs) are a powerful trading tool. They define an expected range of volatility in a stock based on recent price action. When that volatility contracts, the Bollinger Bands squeeze into a narrow channel. The resolution of that squeeze – to the upside or downside – can create a powerful continuation of or change … Read more

Overbought Period Demonstrates Freshly Bullish Sentiment for Stocks – Above the 40 (January 8, 2021)

Stock Market Commentary What a week to start the year’s trading. It started with a definitively bearish end to extended overbought conditions. Overbought conditions bullishly resumed in the middle of the week despite an insurrection in Washington D.C. The week ended with a confirmation of the freshly bullish sentiment in the market. The trading action … Read more

End of Overbought Period for Stocks Ushers In the Bear – Above the 40 (January 4, 2020)

Stock Market Commentary The weakening overbought conditions finally gave way to a full breakdown. The abrupt end of the overbought period ushers in the bear. Ironically, trading started well with the S&P 500 (SPY) gapping slightly higher at the open. The selling pressure started after the open and did not relent until lunchtime on the … Read more

An Extended Overbought Rally Moves Into Historic Territory (Above the 40) – December 18, 2020

Stock Market Commentary The Federal Reserve signaled an incremental improvement in its economic outlook by making an allowance for limited stock repurchases and dividends by the country’s top financial institutions. As a result, bank stocks apparently soared in after hours trading. That fresh rally in financials should extend to a positive open on Monday and … Read more

Key Overbought Threshold for the Stock Market In Time for the Holidays – Above the 40 (December 11, 2020)

Stock Market Commentary A week ago, the stock market stretched into an extended overbought rally. The stock market proceeded to relax from that stretch. Yet, the breadth indicators barely budged and allowed the overbought rally to reach a key overbought threshold and test of the extended overbought rally. The overbought period reached 20 days in … Read more

Bearish Indices and Bullish Reopen Stocks Create Abrupt Rotation – Above the 40 (November 9, 2020)

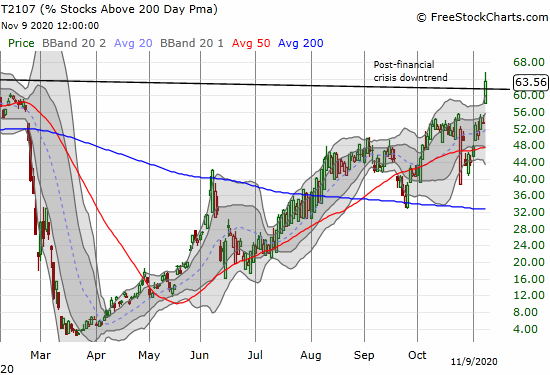
AT200 (T2107) surged 10 percentage points to close near a 3-year high and a breakout above the post financial crisis downtrend.

Stock Market Statistics AT40 = 67.8% of stocks are trading above their respective 40-day moving averages (DMAs) (high of 75.1%) AT200 = 63.6% of stocks are trading above their respective 200DMAs (near 3-year high and breakout above post financial crisis downtrend) VIX = 25.8 (as low as 22.4) Short-term Trading Call: neutral Stock Market Commentary … Read more