
Stock Market Statistics
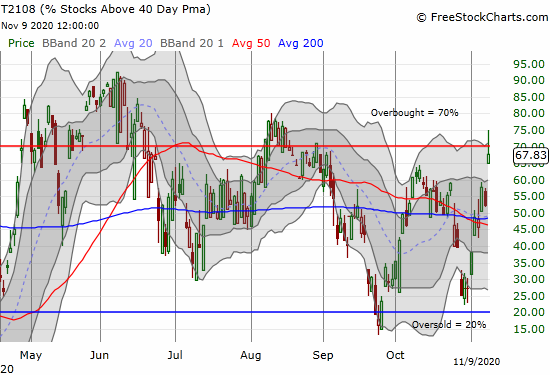
- AT40 = 67.8% of stocks are trading above their respective 40-day moving averages (DMAs) (high of 75.1%)
- AT200 = 63.6% of stocks are trading above their respective 200DMAs (near 3-year high and breakout above post financial crisis downtrend)
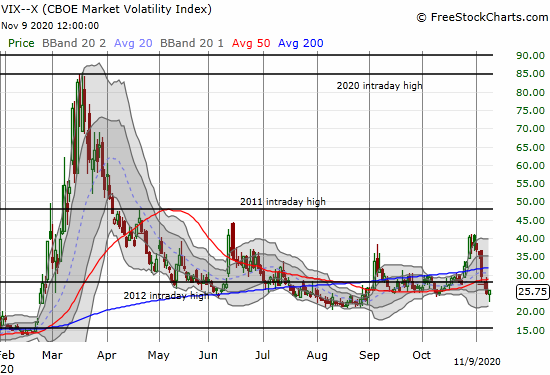
- VIX = 25.8 (as low as 22.4)
- Short-term Trading Call: neutral
Stock Market Commentary
Explosively divergent trading action accompanied news that Pfizer (PFE) and its partner BioNTech (BNTX) now have a coronavirus (COVID-19) vaccine that is 90% effective. The announcement drove traders to sell big cap tech and a large swath of lockdown, work-from-home, pandemic-friendly stocks and to plow that money right into value and “reopen” type of stocks. The industrial names I have favored for weeks rode the wave higher with bullish reopen stocks with stunning results (sometimes it is better to be lucky than good).
After taking profits and watching the dust settle over the trading action, I was stunned by the dramatic bullish and bearish extremes all over the stock market. I was left wondering why the stock market acted so swiftly on news that was a matter of when not if. Many hundreds of scientists across the globe are furiously working on coronavirus vaccines. Promising news of medical trials and political promises have swaddled the market and the public for months. As a result, I just assumed that optimistic anticipation was one of the solid drivers holding the stock market up. Instead, it turns out investors and traders were waiting for much more solid evidence that the beginning of the end of the coronavirus pandemic is indeed possible.
The Stock Market Indices
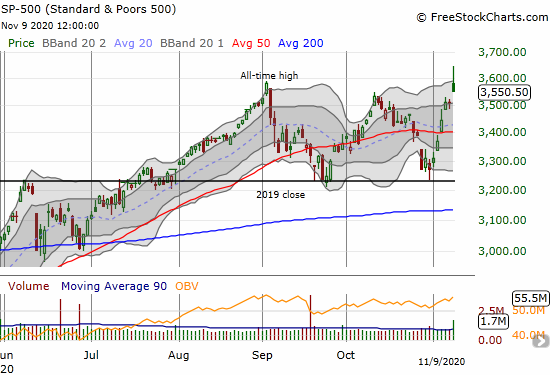
The S&P 500 (SPY) neatly combined the good and the bad about the day’s rally. The index gapped up on the momentum of bullish reopen stocks and buyers quickly took the S&P 500 above its all-time high. Almost as quickly, sellers descended upon the S&P 500 until its gain was whittled down to 1.2%. The pressure left behind a bearish “wick” in the candlestick chart. Follow-up selling will confirm a bearish topping pattern akin to a blow-off top.
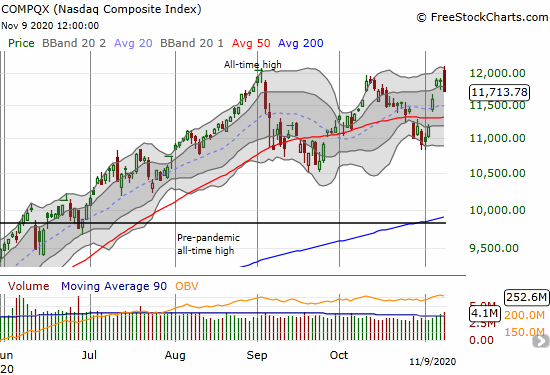
The NASDAQ (COMPQX) looks even worse than the S&P 500. The tech-laden index gapped right to its all-time high and proceeded to fade the rest of the day. The NASDAQ formed a bearish engulfing pattern. This bearishness forms at the end of an uptrend after an equity gaps higher above the previous day’s close only to end the day below the previous day’s low. The NASDAQ lost 1.5%. Follow-through selling will confirm a triple top.
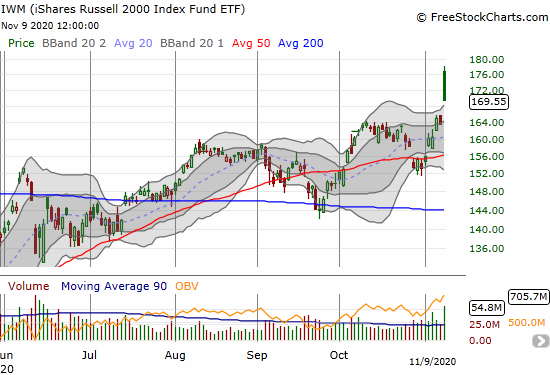
The iShares Russell 2000 Index Fund ETF (IWM) gapped well above its upper Bollinger Band (BB). From this over-stretched position sellers went right to work. By the end of the day, IWM closed at its lows, went from an all-time high to a 10-month high, and escaped with what otherwise would have been an impressive 3.6% gain. IWM formed a “gap and crap” pattern. The ETF of small caps can recover if the price action quickly stabilizes from here.
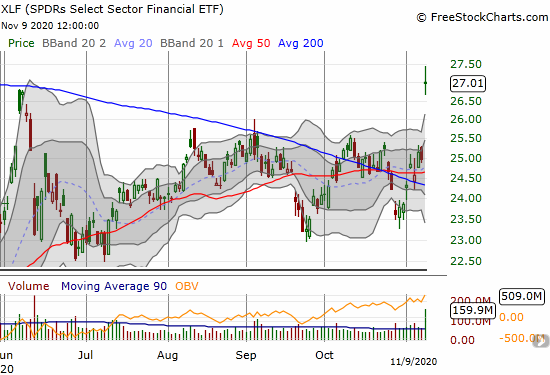
The SPDRs Select Sector Financial ETF (XLF) pulled off an unqualified bullish day even though it did not even come close to an all-time high. XLF gapped up and managed to close right around that open. Buyers and sellers ended the day with an intraday stalemate. XLF gained a whopping 8.2% on an 8-month high. XLF still has yet to recover from its post-pandemic losses.
Stock Market Volatility
The volatility index (VIX) recovered from early losses and ended the day with a 3.6% gain. The VIX printed a bullish hammer candlestick pattern that marks the end of a downtrend. A higher close confirms the bottom. In other words, the VIX gives me cause to pause.
The Short-Term Trading Call
Perhaps ironically, I am even more wary about the stock market than I was on Friday when the stock market voted to rally. Yet, I am not wary enough to flip bearish despite the accumulating bearish technical signals as described above (including a bottoming VIX). Even the potentially bearish action in AT40 (T2108), the percentage of stocks trading above their respective 40DMAs, did not quite sway me off the fence of a neutral short-term trading call.
AT40 traded above the overbought threshold of 70% at one point only to fade backward to 67.8%. Per the AT40 trading rules, such a move is potentially bearish. A lower close from here seals the deal.
One the other hand, AT200 had a VERY bullish day. This longer-term indicator of breadth in the market surged to a near 3-year high. Most importantly, it actually broke the long-term downtrend in place since the financial crisis! With 63.6% of the stock market trading above 200DMAs, traders and investors have every reason to expect more good times ahead.
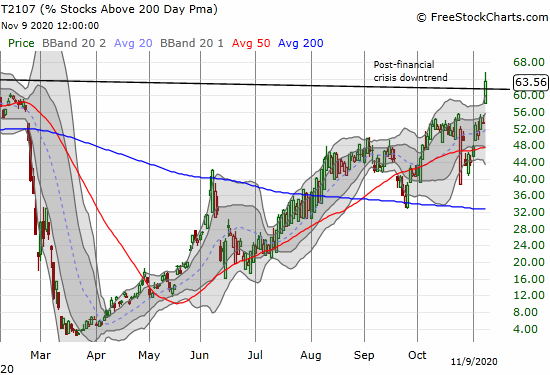
I do not have an easy method for resolving the apparent dilemma between the weight of bearish signals and the gleaming bullish signal summarized by AT200 (and buttressed by financials). Tech stocks that took a beating on the day look like an opportunity. I see opportunity in buying the coming dips in the “reopen” stocks and other value plays. I like the industrial plays even more. In other words, while I flipped neutral a week ago to mentally prepare to get bearish after AT40 hit the overbought threshold of 70%, I am not yet sympathetic to the bearish case. One potential clincher for the bearish case is a continued fade in AT40 joined by AT200 closing below its low of the day at 58.1%.
Since I took a lot of profits on the day, I do not feel pressed to make aggressive decisions. Yet, given the aggressive divergence in trading on the day, I expect a lot of opportunities lie ahead as the market snaps back to some kind of more stable equilibrium. Sitting on a neutral short-term trading call at least keeps my eye open to optimism and skepticism. Nimble traders can immediately short SPY, QQQ, and IWM with tight stops above their respective all-time highs.
Stock Chart Reviews – Below the 50DMA
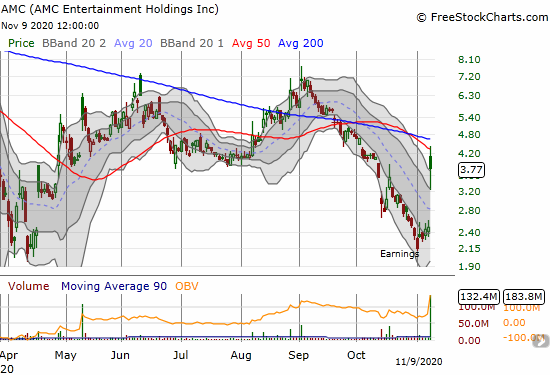
AMC Entertainment Inc. (AMC)
Movie theaters are struggling to stay alive long enough for a return to post-pandemic normalcy. AMC Entertainment Inc. (AMC) returned to its death bed until earnings put a halt in the selling. It is telling that even with a 51.4% gain, AMC still managed to close below its 50DMA. A lot of work still ahead…
iShares Dow Jones US Home Construction Index Fund ETF (ITB)
In my last Housing Market Review, I wrote about a divergence between strong housing data and the stocks of home-builders. That parting of ways widened on a day of divergences. Bond yields soared on the stock market’s optimism for a full reopening of the economy. As a result, investors and trading bots automatically sold rate-sensitive housing plays. I stuck to the seasonal trading plan for home builders and bought back into call options on ITB. The trading action put me on notice that I need to keep these trades on short leashes.

Vapotherm (VAPO)
after two consecutive post-earnings disappointments, investors must have started sniffing out the beginning of the end for Vapotherm (VAPO). VAPO makes medical equipment to treat patients in respiratory distress. There will be a lot fewer of these patients in the post-vaccine world. In the wake of the pandemic, VAPO launch from $7.79 to $17.77 in just three days. Gravity should take the stock back to those levels in due time.

Zoom Video Communications Inc (ZM)
Perhaps no other stock symbolizes the pandemic era better than Zoom Video Communications Inc (ZM). Last week’s recovery on a 50DMA bounce ended abruptly with today’s 50DMA breakdown and 17.4% loss. Zoom’s usefulness will extend well beyond the pandemic and likely ushered in a new era of digital communications for a broad range of people. As I mentioned in my last Above the 40 post, I am just not comfortable paying up for the opportunity here. At some point (months, a year or more?), ZM will test its 200DMA support, and I will revisit the case then.

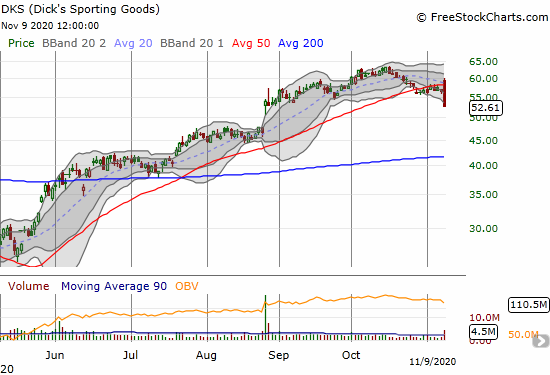
Dick’s Sporting Goods (DKS)
Even the trending outdoor recreation stocks are suddenly in trouble. Dick’s Sporting Goods (DKS) managed a bearish engulfing pattern after first breaking out above its 50DMA. DKS ended the day with a devastating 7.0% loss and 2 1/2 month low.
Stock Chart Reviews – Above the 50DMA
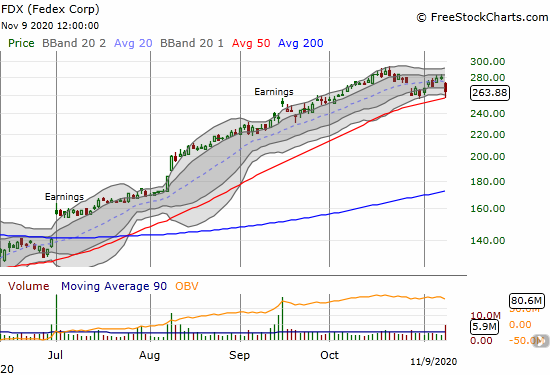
FedeEx Corp. (FDX)
Renewed selling in FedEx Corp. (FDX) surprised me. The stock has definitely enjoyed heady gains, so using the stock as a source of funds to buy cheaper stocks makes sense. However, nothing changed about the company’s prospects in a world more and more dominated by electronic commerce and the related shipping of packages. The bounce of 50DMA support is encouraging for my current call spread position.
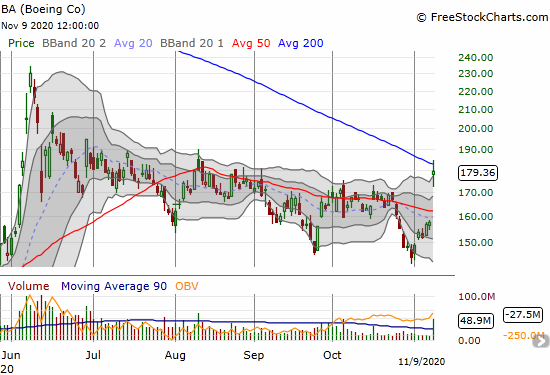
Boeing (BA)
Plane manufacturer Boeing (BA) jumped 13.7% but stopped right at its 200DMA resistance. The stock still has plenty of room to go before challenging its June high. I happened to have a fistful of call options in BA left over from a call calendar spread. I promptly took profits.
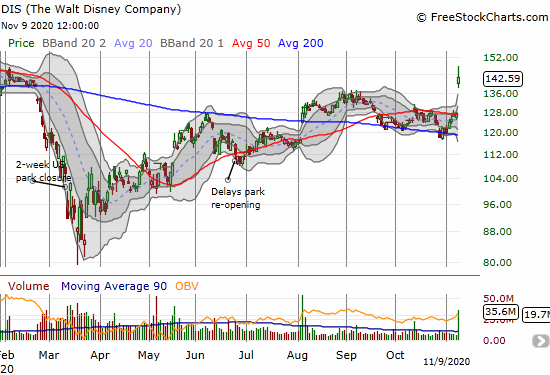
The Walt Disney Company (DIS)
The Walt Disney Company (DIS) soared 11.9% although it faded from an 11-month high. DIS is definitely a buy-the-dip stock now after confirming 200DMA support across two months. Earnings are around the corner.
Wynn Resorts Ltd (WYNN)
Wynn Resorts Ltd (WYNN) is one of my favorite travel and leisure companies and stocks. Yet, I did not luck out with a position on this one. I am VERY eager to buy dips here. The company managed a 50DMA breakout post-earnings last week, so I should have bought right there. Lesson” stay on top of your favorites!

— – —
FOLLOW Dr. Duru’s commentary on financial markets via email, StockTwits, Twitter, and even Instagram!
“Above the 40” uses the percentage of stocks trading above their respective 40-day moving averages (DMAs) to assess the technical health of the stock market and to identify extremes in market sentiment that are likely to reverse. Abbreviated as AT40, Above the 40 is an alternative label for “T2108” which was created by Worden. Learn more about T2108 on my T2108 Resource Page. AT200, or T2107, measures the percentage of stocks trading above their respective 200DMAs.
Active AT40 (T2108) periods: Day #29 over 20%, Day #4 above 30%, Day #3 over 40%, Day #2 over 50%, Day #1 over 60%, Day #47 under 70%
Daily AT40 (T2108)
")
Black line: AT40 (T2108) (% measured on the right)
Red line: Overbought threshold (70%); Blue line: Oversold threshold (20%)
Weekly AT40 (T2108)

*All charts created using FreeStockCharts unless otherwise stated
The T2108 charts above are my LATEST updates independent of the date of this given AT40 post. For my latest AT40 post click here.
Be careful out there!
Full disclosure: long UVXY, long ITB calls, long FDX call spread
*Charting notes: FreeStockCharts stock prices are not adjusted for dividends. TradingView.com charts for currencies use Tokyo time as the start of the forex trading day. FreeStockCharts currency charts are based on Eastern U.S. time to define the trading day.