
Stock Market Commentary
Last week featured an intense barrage of earnings reports. The collective response on the major indices was a major yawn. The S&P 500 finished flat for the week. The NASDAQ and the iShares Trust Russell 2000 Index ETF both softened by 0.4%. Financials were a notable exception as the Financial Select Sector SPDR Fund (XLF) jumped 2.6%. Presumably, the Federal Reserve’s latest pronouncements on monetary policy at least partially drove the move. XLF delivered a yawn the previous week when financials delivered a barrage of earnings. Through it all, the stock market had just enough momentum to help stock buyers break an important downtrend on AT40 (T2108), the percentage of stocks trading above their respective 40-day moving averages (DMAs). However, buyers were stymied by the secondary downtrend which Friday’s pullback confirmed. The setup looks perfect for the annual hand-wringing about the prospects for “sell in May.”
The Stock Market Indices
The S&P 500 (SPY) essentially went nowhere all week except for a 0.7% spurt on Thursday. Subsequently, selling on Friday reversed that gain and ended the index flat for the week. The steep rise in the 20DMA (the dotted line below) means that the S&P 500 will likely face its first important test of support since March 24th and 25th.
The NASDAQ (COMPQX) is already facing its test of 20DMA support. The tech-laden index was a little more volatile last week than the S&P 500, but it still ended the week just a hair below flat. The NASDAQ started the week with a fresh closing all-time high.
The iShares Trust Russell 2000 Index ETF (IWM) looked good as it followed along its upper Bollinger Band (BB) the first three days of the week. A fade on Thursday and a 1.4% loss on Friday sent IWM right back to support. IWM continues to pivot around its trendlines: the 20DMA since February and now the 50DMA since late March.
The pivoting threw me for a loop again. I placed a fresh calendar call spread trade expecting IWM to continue grinding along its upper-BB. The Friday drop left the short side of the trade worthless. However, I now need a quick return to the previous momentum…something that looks unlikely.
Stock Market Volatility
The volatility index (VIX) is now holding its own. The VIX gained 7.5% for the week. This follows a 6.7% gain the previous week. The VIX last gained two weeks in a row in late February. I no longer expect an imminent return to the 15.35 pivot. Still, sellers have work to do to spook the market enough to drive the VIX through 20 anytime soon.
The Short-Term Trading Call after the break of the important downtrend
- AT40 (T2108) = 55.6% of stocks are trading above their respective 40-day moving averages
- AT200 (T2107) = 80.8% of stocks are trading above their respective 200-day moving averages (TradingView’s calculation)
- Short-term Trading Call: neutral
AT40 (T2108), the percentage of stocks trading above their respective 40DMAs, finished the week almost exactly where it finished the previous week. Yet, the week started off in a promising way for the bulls. Even as the S&P 500 went nowhere, AT40 opened the week with a breakout above the primary downtrend. That downtrend had me worried earlier. AT40 continued higher for the next two days after slipping by that important downtrend. Thursday changed the tenor of the trading. Even though the S&P 500 popped out of its churn for an all-time high, AT40 declined slightly with a pullback from the secondary downtrend line (see the chart below). Friday’s losses on the indices helped send AT40 into a gap down that stymied the buyers and confirmed the bearish divergence. The secondary downtrend now becomes the primary downtrend. For good measure, AT40 closed almost on top of the former primary downtrend.
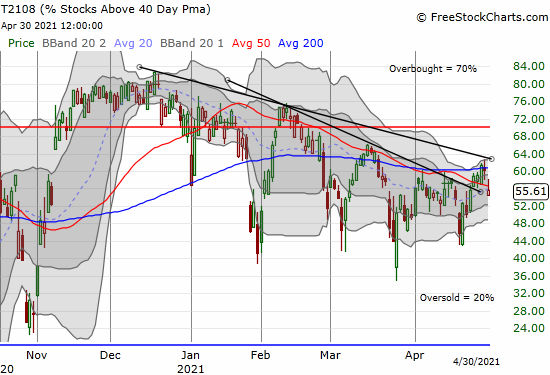
This definitive rejection from the new primary downtrend is a great set-up for May trading. If selling gets started in the coming week, it will effectively flip me into a bearish mode. At that point, I will anticipate being correct about a 50DMA test this month for the S&P 500. Standing in front of this call is the annual hand-wringing about “sell in May and go away.” This old stock market adage fails most years, yet it persists. Accordingly, if too many traders expect this May/summer to deliver, then it won’t (such is the contrary nature of consensus expectations).
Canaccord Genuity’s Tony Dwyer appeared on Fast Money last week to give another go at calling for a market correction. It was another bullish bearish call. Dwyer thinks the stock market is fundamentally sound. The market is simply due for a correction because momentum has gone too far, too fast. Dwyer wants to buy the sell-off. I do as well…especially if the stock market reaches oversold conditions.
On the other side of the coin are analysts who increased bullish bets thanks to the current momentum and/or economic backdrop. For example, Credit Suisse (CS) reviewed earnings results and concluded the market is primed for a fresh leg higher. Credit Suisse increased its year-end price target for the S&P 500 from 4300 to 4600. JPMorgan (JPM) offered a twist on the old adage and insisted it is time to buy in May and go away with cyclical and value stocks leading the way. Like Dwyer, I am looking for a sell-off before all the bulls get rewarded yet again.
Stock Chart Video Reviews
Stock Chart Reviews – Below the 50DMA
Advanced Micro Devices (AMD)
Last week featured a bunch of troubling post-earnings trading action in important stocks. Advanced Micro Devices (AMD) initially gapped up post-earnings. Sellers took over from there and have yet to stop. I went from feeling like a genius with my June $85/100 call spread to feeling cheated as AMD sliced toward a test of 50DMA support.
Texas Instruments (TXN)
Sellers wasted no time with Texas Instruments (TXN). The stock gapped down post-earnings and confirmed 20DMA resistance. I am targeting going short on a confirmation of the current 50DMA breakdown on a lower close.
Invesco Solar ETF (TAN)
Solar stocks as a group continue to struggle. The Invesco Solar ETF (TAN) looks like it is in profit-taking mode. After opening the week with a test of downtrending 50DMA resistance, TAN pulled back the rest of the way. The two month trading range looks close to resolution as the 50DMA and 200DMA converge.
First Solar (FSLR)
Earnings treated First Solar (FSLR) poorly. The stock fell 12.3% on a surge in volume. First Solar reaffirmed guidance for the year, so I assumed the selling was mostly profit-taking. Perhaps investors had high expectations for raised guidance? Under these conditions, I bought back into FSLR given I liked the stock around these levels in March.
Enphase Energy (ENPH)
Solar energy company Enphase Energy (ENPH) (with a focus on microinverters) tried to lead the solar sector out of its morass. A post-earnings gap down left behind a false 50DMA breakout. Sellers persisted from there and look ready to set up ENPH for a test of 200DMA support.
Discovery (DISCA)
My trade in Discovery (DISCA) ended a while back. Finally, the dribbling downward came to a halt with an 8.5% pop on April 21st (I did not see news to explain the move). DISCA churned from there until disappointing earnings sent the stock gapping down. That reaction is telling because it suggests DISCA really is worth something around current levels for now. Previously, I thought the liquidation-related collapse in March was perhaps overdone. Instead, the run-up to the March high was the overdone part of this move.
Boeing (BA)
Boeing (BA) is languishing a bit. The stock has drifted downward since its parabolic move in the first half of March. That frenzied trading likely exhausted buyers as is typical of parabolic moves. The post-earnings move for BA drove the stock through a 50DMA breakdown. Friday’s 0.7% loss marginally confirmed the latest 50DMA breakdown.
EBay Inc (EBAY)
I am always amazed to see Ebay (EBAY) trading relatively well. EBAY set all-time highs in February and then in April. However, earnings disappointed and sent the stock through a 50DMA breakdown. I am watching for another bounce off 200DMA support to buy…or a confirmed breakdown to short.
Twitter (TWTR)
So much for the excitement from February’s Investor Day. Twitter (TWTR) reversed most of those gains in a month, but Friday’s 15.2% post-earnings loss definitively confirms that the glow from February is but a distant memory. The plunge also confirmed 50DMA resistance. Since I am a permabull trader in TWTR, I am looking to buy back in with a test of 200DMA support.
Impinj Inc (PI)
I have not traded Impinj (PI) in a long time. After a post-earnings stumble, I am watching PI more closely. The 19.4% post-earnings loss confirmed 50DMA resistance. The stock’s two month struggle to break that barrier could also have served as a warning sign. A 200DMA breakdown will be the next opportunity to go short. A 50DMA breakout after this calamity would be a very bullish event.
Teladoc Health Inc (TDOC)
I have had several discussions about the growth opportunity for telehealth. I remain on the fence. For example, Teladoc Health Inc (TDOC) has gone nowhere for over a year. Ironically, its big run-up happened ahead of the pandemic. So the big question ahead is whether TDOC can continue high growth rates as more and more people are comfortable seeing their doctors in-person. Moreover, will insurance companies cooperate and pay enough for telehealth visits when they are no longer deemed necessary for public health reasons? After an 8.3% post-earnings loss, TDOC now trades right at the bottom of a trading range.
Stock Chart Reviews – Above the 50DMA
Caterpillar Inc (CAT)
I have not returned to Caterpillar (CAT) in about a month. CAT is stuck in a trading range just below all-time highs. Post-earnings, CAT gapped up and then faded to a 2.1% loss. It is now struggling to hold 50DMA support for the first time since January earnings. Needless to say, I will shift from buying CAT call options to put options on a confirmed 50DMA breakdown. CAT is part of the cyclical/industrial complex that should benefit from the current economic environment. Accordingly, a bearish signal would raise a major red flag for me.
Apple (AAPL)
One of the most important post-earnings fades happened with Apple (AAPL). I was positioned ahead of earnings with a weekly 135 (long)/137 (short) calendar call spread. The position looked decent at the gap open and even maintained some profit at the end of the fade to a flat close; I designed the trade to profit from just such a lukewarm close. Unfortunately, the (surprise) gap down and 1.5% loss on Friday took the position into the red with a quickness. Absent a huge rebound on Monday, I will take my losses. The poor post-earnings behavior of AAPL adds to my wariness with the broader market. AAPL now looks primed for a test of 50DMA support.
Microsoft (MSFT)
I was also positioned with a calendar call spread ahead of Microsoft (MSFT) earnings. I was anticipating at worst a flat close. So the gap down to a 2.8% post-earnings loss took me by surprise. I was also surprised sellers were able to keep pushing MSFT lower. Like AAPL, MSFT now looks primed for an imminent test of 50DMA support.
Amazon.com (AMZN)
Add Amazon.com (AMZN) to the club of lukewarm to poor post-earnings performance in big cap tech. Like AAPL, AMZN gapped up post-earnings and then faded to a near flat close. Buyers managed to pull off a gap up on Friday but sellers pushed AMZN right back to a flat close. If sellers follow through on Monday, AMZN will looked primed for at least a test of uptrending 20DMA support. Given the eagerness of sellers, I think AMZN has a high risk of testing converged support at the 50 and 200DMAs in the coming weeks.
Alphabet (GOOG)
Alphabet (GOOG) bucked the trend of post-earnings profit-taking. While faders removed some of the shine, GOOG still finished with a 3.2% gain that held the gap up. GOOG even gained 2.1% the next day for another all-time high. The mantle of big cap strength has clearly passed on to GOOG. More importantly, GOOG becomes the tip of the spear of the narrowing breadth in the stock market.
Facebook (FB)
Post-earnings trading was good for Facebook (FB). The stock not only soared 7.3% to an all-time high but also a rebound off the upper-BB nullified the faders and profit-takers. Even with a 1.3% loss on Friday, FB looks exceptionally strong. FB joins GOOG at the tip of the spear of a narrowing market.
Qualcomm (QCOM)
The faders and profit-takers swooped into the post-earnings response for Qualcomm (QCOM). The stock gapped up and faded but held an initial 4.5% post-earnings gains. However, the selling continued the next day as QCOM lost 2.7%. The stock looks poised to fill its post-earnings gap and even test 50/200DMA support levels.
Cryoport (CYRX)
Through the fog of surprise gap downs, profit-taking, and fades, I found a bullish sign in Cryoport (CYRX). The stock is consolidating just above its 50DMA support. CYRX is a breakout away from triggering a buy signal for me. Note how CYRX faded from a parabolic move in January. Yet one more lesson in the dangers of chasing parabolic run-ups.
Tesla (TSLA)
Ironies abound with my most recent trades in Tesla (TSLA). I was positioned with a calendar call spread on TSLA ahead of earnings. The short side expired harmless the previous week. However, TSLA went into earnings without any momentum. The stock ran out of charge with a 4.5% post-earnings loss. Sellers next managed to push TSLA below its 50DMA. At that point, I jumped into a May 640/600 put spread in preparation for a rush toward the March lows. TSLA instead bucked Friday’s market malaise and reversed course with a 4.8% gain and 50DMA breakout. I will run fast from my position if buyers manage to follow-through on Monday. This experience was another one of those reminders of the value of waiting for a confirmation of a breakdown (or breakout).
Be careful out there!
Footnotes
“Above the 40” (AT40) uses the percentage of stocks trading above their respective 40-day moving averages (DMAs) to measure breadth in he stock market. Breadth indicates the distribution of participation in a rally or sell-off. As a result, AT40 can identify extremes in market sentiment that are likely to reverse. Above the 40 is my alternative name for “T2108” which was created by Worden. Learn more about T2108 on my T2108 Resource Page. AT200, or T2107, measures the percentage of stocks trading above their respective 200DMAs.
Active AT40 (T2108) periods: Day #126 over 20%, Day #110 above 30%, Day #108 over 40%, Day #3 over 50% (overperiod), Day #20 under 60% (underperiod), Day #39 under 70%


Black line: AT40 (T2108) (% measured on the right)
Red line: Overbought threshold (70%); Blue line: Oversold threshold (20%). Source: FreestockCharts
Source for charts unless otherwise noted: TradingView.com
Grammar checked by Grammar Coach from Thesaurus.com
Full disclosure: long UVXY calls, long SPY puts, long IWM calls, long MSFT calls, long AAPL calls, long FSLR, long TSLA put spread, long AMD call spread, long TAN
FOLLOW Dr. Duru’s commentary on financial markets via StockTwits, Twitter, and even Instagram!
*Charting notes: Stock prices are not adjusted for dividends. Candlestick charts use hollow bodies: open candles indicate a close higher than the open, filled candles indicate an open higher than the close.
There is very good content on your blog, I was truly delighted with this information.