
Stock Market Commentary
The weakening overbought conditions finally gave way to a full breakdown. The abrupt end of the overbought period ushers in the bear. Ironically, trading started well with the S&P 500 (SPY) gapping slightly higher at the open. The selling pressure started after the open and did not relent until lunchtime on the East Coast (imagine that). Buyers were able to shove stocks higher into the close.
The headlines contained plenty of bad news to back into explanations for the selling.
- Political and elections drama in and for Georgia.
- U.S. Secretaries of Defense across parties for the last 50 years wrote together about concerns over the potential for U.S. military involvement in civilian political battles.
- The United Kingdom retrenched back into a full national lockdown announced by Prime Minister Boris Johnson as a new more virulent coronavirus sweeps through the country.
- Iran seized a South Korean oil tanker and resumed enrichment of uranium.
- Profit-taking after a banner 2020 year for stocks (profits counting for 2021 taxes instead of 2020).
- The NY Giants missed the NFL playoffs after the coach for the Philadelphia Eagles shockingly plugged in his 3rd string QB in the 4th quarter of a 14-17 game against the Washington Football Team.
The last point just covers the Wall Streeters in the New York area who sold stocks out of spite in disgust. Their 6-10 team was denied what would have been an historic division title.
In all seriousness, pick your favorite poison – it is sufficient to recognize that the weakening overbought conditions put the market in a mood to find excuses to sell. The stock market could have and would have ignored any combination of these news items just 2 or 3 weeks ago.
The Stock Market Indices
The S&P 500 (SPY) lost 1.5% after dropping as low as a 2.5% loss. Buyers perfectly perched the S&P 500 on top of its uptrending 20DMA support.
The NASDAQ (COMPQX) also lost 1.5%. Buyers did not quite stick the landing on top of the uptrending 20DMA support.
Small caps expanded a pattern of weakness. The iShares Trust Russell 2000 Index ETF (IWM) lost 1.3% after buyers just missed sticking the landing on the uptrending 20DMA support.
Stock Market Volatility
In past Above 40 posts I flagged the ominous resilience of support for the volatility index (VIX). The launchpad of support finally activated. The volatility index (VIX) surged as much as 28.1% before settling for an 18.6% gain.
The Short-Term Trading Call: Usher in the Bear
- AT40 = 63.6% of stocks are trading above their respective 40-day moving averages (ended 33-day overbought period)
- AT200 = 85.3% of stocks are trading above their respective 200-day moving averages (TradingView’s calculation).
- Short-term Trading Call: bearish
AT40 (T2108), the percentage of stocks trading above their respective 40DMAs, closed at 63.6%. My favorite technical indicator struggled for two days to hold the overbought threshold of 70%. The wilting trading action moved me to claim: “an end to the weakening overbought conditions appears imminent.”

However, I did not expect the end to come with such an exclamation mark. As a result, I did not have as many hedges in place as I would have liked. I held on to the few hedges I do have. In particular, I am still holding the March $5 UVXY call options. While I expected to hold these for weeks to come, I will need to take profits whenever I think the VIX is faltering. I will continue to hold shares in UVXY.
Per the AT40 (T2108) trading rules, I flipped the short-term trading call to bearish with the breakdown from overbought conditions. As the stock market ushers in the bear, I considered taking a baby step from neutral to “cautiously bearish.” However, the stock market has plenty of downside potential from here, so I prefer to be in a prepared mindset now. The bearish call gets invalidated on the next all-time high in the S&P 500. The bearish call should be validated with a close below Monday’s intraday lows.
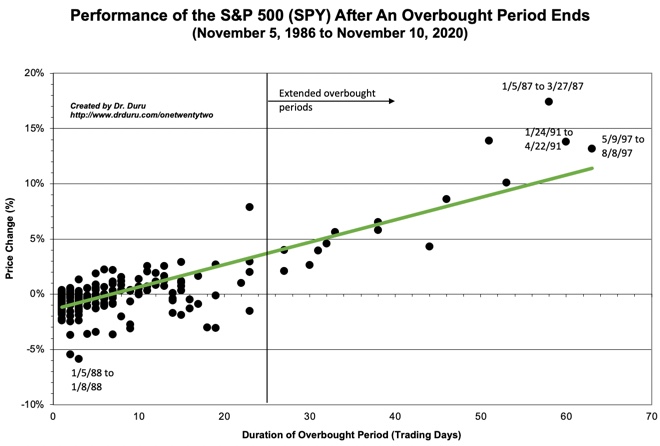
Overbought conditions ended at 33 days. The S&P 500 gained 3.2% from the beginning of the overbought period to today’s end. Per the historical chart below, this overbought period under-performed expectations. The chart projects around a 5% gain for an overbought period lasting 33 days.
The Message in the Currency Market
Note I am not quite ready to short anything aggressively. For example, at the time of writing, the Australian dollar is rebounding sharply against the Japanese yen (AUD/JPY). This trading action supports risk-on sentiment in the market.
Stock Chart Reviews – Below the 50DMA
Zoom Video Communications (ZM)
The stock of Zoom Video Communications (ZM) rebounded to 50DMA resistance in the first two weeks of the overbought period. The correction in the stock resumed from there. Today’s action notably out-performed the market with a 6.7% gain. On an intraday basis, ZM ran up to this gain in the first hour of trading. Accordingly, ZM’s out-performance was extremely strong. While ZM seems inevitably headed for 200DMA support, I put in place a hedged play of a weekly put spread to support and a calendar call spread at 20DMA resistance in the hopes of catching a big move in either direction.
Stock Chart Reviews – Above the 50DMA
Boeing Co (BA)
Boeing Co (BA) corrected the entire month of December. I stopped buying call options after it broke 20DMA support. BA’s large 5.3% drop put it within sight of an important test of 50DMA support.
Meritage Homes (MTH)
Home builder Meritage Homes (MTH) is one of the most vulnerable housing-related stocks of my universe. MTH barely rebounded out of a 200DMA breakdown and closed with a 0.9% loss. The stock sits near a 6-month low and has nearly reversed its entire summer breakout.
Stitch Fix (SFIX)
Digital clothing outfitter Stitch Fix (SFIX) peaked days before Christmas. SFIX is down 21.8% since then. As a result of the 20DMA breakdown, the stock looks like it is aiming for an eventual test of 50DMA support. I start to get interested in buying on a test of the post-earnings closing low of $49.90.
Be careful out there!
Footnotes
“Above the 40” (AT40) uses the percentage of stocks trading above their respective 40-day moving averages (DMAs) to measure breadth in he stock market. Breadth indicates the distribution of participation in a rally or sell-off. As a result, AT40 can identify extremes in market sentiment that are likely to reverse. Above the 40 is my alternative name for “T2108” which was created by Worden. Learn more about T2108 on my T2108 Resource Page. AT200, or T2107, measures the percentage of stocks trading above their respective 200DMAs.
Active AT40 (T2108) periods: Day #57 over 20%, Day #41 above 30%, Day #40 over 40%, Day #39 over 50%, Day #38 over 60% (overperiod), Day #1 under 70% (underperiod ended 33 days overbought)


Red line: Overbought threshold (70%); Blue line: Oversold threshold (20%). Source: FreestockCharts
Source for charts unless otherwise noted: TradingView.com
Full disclosure: long UVXY shares and calls, long SPY put spread
FOLLOW Dr. Duru’s commentary on financial markets via StockTwits, Twitter, and even Instagram!
*Charting notes: FreeStockCharts stock prices are not adjusted for dividends. TradingView.com charts for currencies use Tokyo time as the start of the forex trading day.