Tech Leaves Behind A Stock Market Back in Oversold Conditions – Above the 40 (April 13, 2020)

AT40 = 19.7% of stocks are trading above their respective 40-day moving averages (DMAs) (oversold day #1)AT200 = 9.2% of stocks are trading above their respective 200DMAsVIX = 41.2Short-term Trading Call: cautiously bullish Stock Market Commentary It lasted just a day. The market’s historic oversold period lasted 31 days and ended with a flurry. This … Read more

A $2.3 Trillion End to An Extreme Oversold Period in the Stock Market – Above the 40 (April 10, 2020)

AT40 = 24.4% of stocks are trading above their respective 40-day moving averages (DMAs) (ended 31-day oversold period)AT200 = 10.9% of stocks are trading above their respective 200DMAsVIX = 41.7Short-term Trading Call: cautiously bullish Stock Market Commentary “The Federal Reserve on Thursday took additional actions to provide up to $2.3 trillion in loans to support … Read more

Nike Kicks Into High Gear Relative to Amazon.com

In early November, I wrote about Nike (NKE) ending its partnership with Amazon.com (AMZN) in a post titled “Nike Kicks Amazon.com Into Bearish Territory.” I gave the bullish case for NKE, a bearish case for AMZN, and a wildcard case for the “innocent” bystander Footlocker (FL). Here is an update on what happened in the … Read more

Nike Kicks Amazon.com Into Bearish Territory

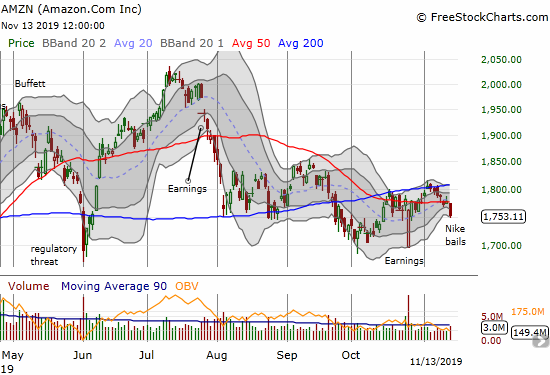
Amazon.com (AMZN) lost 1.4% on a drop below its 50DMA on the way toward a reversal of the post-earnings recovery.

A Failed Pilot “…with a direct partnership, Nike will be able to ‘elevate the way the brand is presented’ by gaining more control over how its products are marketed on the site…” Former Nike CEO Mark Parker quoted in CNN Business (June 29, 2017) In 2017, the Nike (NKE) pilot with Amazon.com (AMZN) held a … Read more

A Stock Market Pivot Around Overbought As Indices Fail At Highs – Above the 40 (September 20, 2019)

AT40 = 69.6% of stocks are trading above their respective 40-day moving averages (DMAs)AT200 = 56.3% of stocks are trading above their respective 200DMAs (13-month high)VIX = 15.3Short-term Trading Call: neutral Stock Market Commentary A Broken Record Last week had some big moments. Looking back, the week looks like a broken record. The Federal Reserve … Read more

Realogy and Amazon.com Partner Up But Does It Matter?

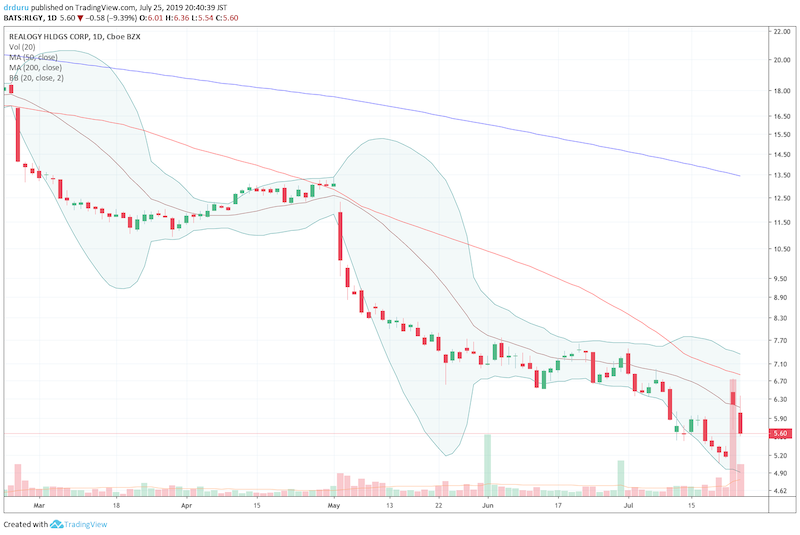
Realogy (RLGY) is struggling to avoid a resumption of its vicious downtrend.

Two weeks ago I threw up a chart of Realogy (RLGY) just to have something bearish to show among a group of bullish charts. I wondered why this company of real estate agents and brokers was in a persistent decline while housing-related stocks were generally holding up well. On July 23, Realogy rolled out what … Read more

Saving Money On Cable – Inside the Experience of A Cord-Cutter

It was early August, 2015 and Disney (DIS) had just created a ruckus by addressing “cord-cutting” and admitting softer than expected results at ESPN. Cord-cutting is the practice of cancelling subscription or pay-tv services like cable TV in favor of cheaper alternatives (including not watching TV at all). There is also growing interest in “never … Read more

T2108 Update (September 8, 2015) – A Historic Oversold Period Ends While Buyers Still Hold the Burden of Proof

(T2108 measures the percentage of stocks trading above their respective 40-day moving averages [DMAs]. It helps to identify extremes in market sentiment that are likely to reverse. To learn more about it, see my T2108 Resource Page. You can follow real-time T2108 commentary on twitter using the #T2108 hashtag. T2108-related trades and other trades are … Read more

Valuations for Internet Stocks Disrupted by Second Quarter 2015 Earnings

Almost a month before the latest earnings cycle, I chronicled the ascendancy of Facebook (FB) to the top valuation spot among the internet stocks I follow. Twitter (TWTR) lost the top spot thanks to a large post-earnings sell-off in April. Fast forward to the latest earnings cycle and internet-companies delivered even more disruptions. Rising above … Read more

Breakout Charts with Caveats: Google and Amazon.com

In previous posts, I have pointed to the charts of Google (GOOG) and Amazon.com (AMZN) as very bullish setups. Google has alternated between vindication and disappointment as a big breakout in March eventually gave way to a choppy slide below a declining 50-day moving average (DMA). Amazon.com (AMZN) has slowly boiled since earnings in late … Read more