
(T2108 measures the percentage of stocks trading above their respective 40-day moving averages [DMAs]. It helps to identify extremes in market sentiment that are likely to reverse. To learn more about it, see my T2108 Resource Page. You can follow real-time T2108 commentary on twitter using the #T2108 hashtag. T2108-related trades and other trades are occasionally posted on twitter using the #120trade hashtag. T2107 measures the percentage of stocks trading above their respective 200DMAs)
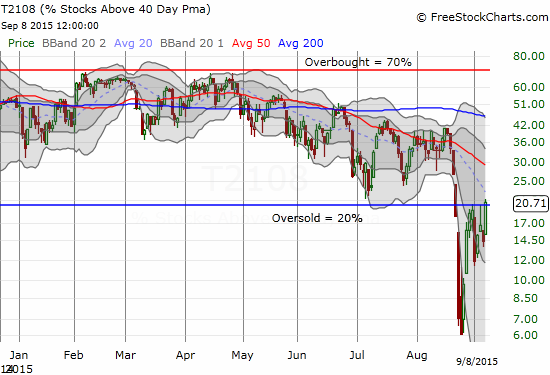
T2108 Status: 20.7% (the 44% gain brought an end to an 11-day oversold period)
T2107 Status: 23.2%
VIX Status: 24.9 (still “elevated”)
General (Short-term) Trading Call: Bullish
Active T2108 periods: Day #1 over 20% (ended 11 days under 20%, aka oversold), Day #13 under 30%, Day #36 under 40%, Day #76 under 50%, Day #93 under 60%, Day #291 under 70%
Reference Charts (click for view of last 6 months from Stockcharts.com):
S&P 500 or SPY
SDS (ProShares UltraShort S&P500)
U.S. Dollar Index (volatility index)
EEM (iShares MSCI Emerging Markets)
VIX (volatility index)
VXX (iPath S&P 500 VIX Short-Term Futures ETN)
EWG (iShares MSCI Germany Index Fund)
CAT (Caterpillar).
Commentary
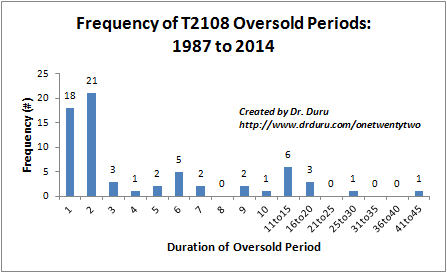
T2108 closed today at 20.7%. The 44% rise from Friday’s close at 14.3% brings an end to a historic oversold period (where T2108 is under 20%). Since 1986, only 10 other oversold periods lasted longer than the 11-day duration of this now concluded oversold period.
T2108 has now reversed all its losses from the flash crash on August 24th.
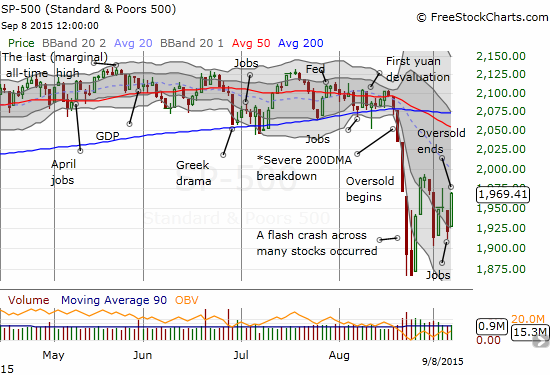
The S&P 50 (SPY) has now returned almost exactly to its close on the FIRST day of the oversold period.
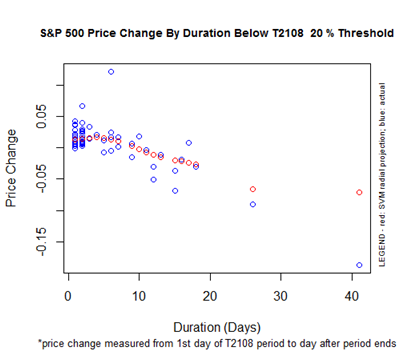
The -0.08% performance of the S&P 500 coming out of an 11-day oversold period places it exactly where the T2108 model would project the index to perform. This accuracy is another great validation of the model.
While the end of the oversold period is good news, the S&P 500 is still lagging. This oversold period was special not only for its flash crash but also for the ability of the S&P 500 to close with a gain WITHOUT first exiting the oversold period. The S&P 500’s current close leaves it below the high from the oversold period. This relative positioning means buyers still hold a heavy burden of proof for the recovery. The “good news” is that the proof will come in the form of a close at or above 2000 which should serve as an important psychological accomplishment.
According to the T2108 trading rules, the most conservative investors and traders now have the green light to buy. However, I cannot give the all clear given the technical resistance still in place directly overhead. I identify the first day out of the oversold period as a spot for conservative buying rules because it tends to limit large drawdowns. The biggest losses on the S&P 500 should now be in the rearview mirror. Conservative buyers can also choose to stop out of new positions if T2108 falls back into oversold territory – and wait again to buy back into the market. So, buying here is conservative, but it is NOT easy.
I thus consider the aggressive trading rules easier to execute. The aggressive approach that I prefer locked in several buying points that leave me with gains on my collection of ProShares Ultra S&P500 (SSO) shares. Given the NET trading success during the oversold period, I am going to try to wait out the market’s next moves from here. (Refer to the links at the top of this article for more details on the trading rules. I also summarized them in “How To Profit From An EPIC Oversold Period.” Refer to previous T2108 Updates for descriptions of trades).
Note well that even after the S&P 500 clears the first level of resistance, it will next contend with downward trends on all three major daily moving averages: the 20, 50, and then 200-day moving averages. Given the severity of the S&P 500’s breakdown last month, I fully expect the 50 or the 200DMAs to hold stiff in the near-term. So, these lines of resistance represent my final price trading targets. T2108 should also hit overbought levels by that point as well.
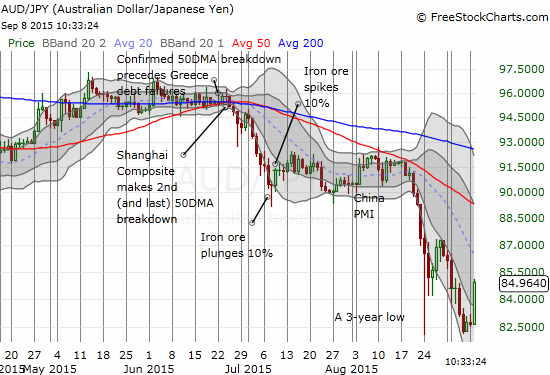
The Australian dollar (FXA) versus the Japanese yen (FXY), AUD/JPY helped to confirm some kind of a bottom with a tremendous surge off its lows. I am still watching this currency pair like a hawk as a sentiment indicator.
The decline of the volatility index, the VIX, added more confirmation as it dropped out of the “dangerzone” marked by the low from the day of the last big surge in volatility.
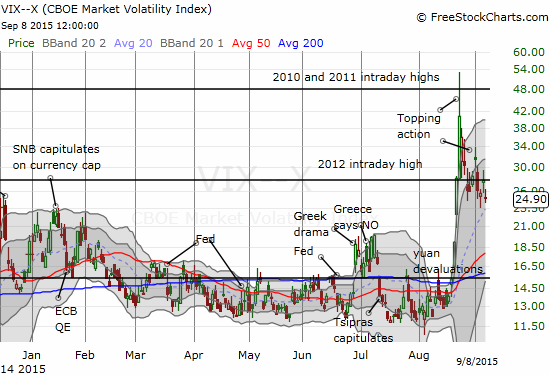
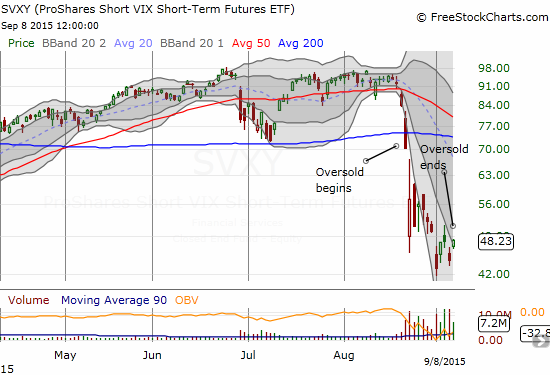
While the VIX is ever so slowly separating from the dangerzone, it has further supported a growing (albeit reluctant) ease in the market. The VIX peaked out on the SECOND day of the oversold period. On day 5, the VIX was already below its close from the first oversold day. So, I am a bit disappointed that only my quick flips on ProShares Short VIX Short-Term Futures (SVXY) have delivered net gains. I am sure on-going backwardation in the VIX futures (their cost is higher now than in the future – fear of the present is much higher than fear of what might come later) has a LOT to do with the 31.5% loss on SVXY despite the end of the oversold period. I consider this a lesson learned in fading volatility during the oversold period: either flip quickly or wait until the oversold period ends.
Ironically enough, my biggest trade on this day was to FADE Netflix (NFLX). Last week, I removed NFLX from my short list of aggressive buys. After it followed through on its latest 50DMA breakdown, I put it on my list of shorts. So, when NFLX gapped up right to the top of the current downward trading channel, I did not hesitate to buy put options. My limit order to sell the put options triggered within an hour as NFLX faded hard. The stock produced a “bearish engulfing pattern” where the open and close are outside the previous day’s open and close (highs and lows). Trading volume was high as NFLX spanned almost the entire width of the trading channel. This very bearish move put NFLX at it lowest close since the breakdown began.
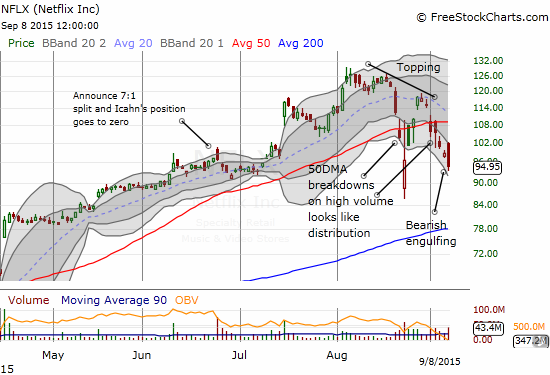
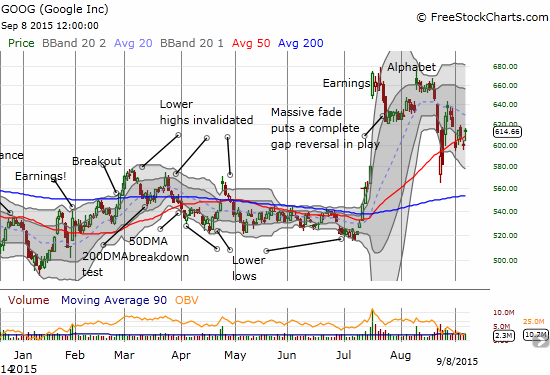
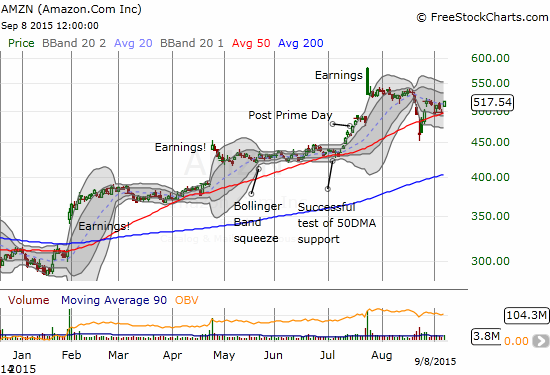
With a whopping 95% year-to-date gain, NFLX is still a stock market leader. However, the on-going breakdown below its 50DMA has put the stock in a lagging position as it trades contrary to the end of the oversold period. Will NFLX lead the rest of the market downward again? Or is NFLX’s days as a leader numbered? Is it finally time for a new crop of leaders to emerge? Apple (AAPL) gave up its leader position shortly after its big earnings gap down. It faces its next big test with another new product announcement (September 9th, 2015). Amazon (AMZN) and Google (GOOG) are still hanging in there as leaders. AMZN close below its 50DMA only twice during the oversold period. Google (GOOG) is pivoting around this critical level of support. Speaking of GOOG, I forgot to mention in the last T2108 Update, that I managed to both my profits on the last set of GOOG call options. I am trying to atone for that gaffe by playing what I think should be a solid bounce off 50DMA support if the oversold period retreats further into the rearview mirror….
Other trades: I sold the SSO call options I bought on Friday into the gap open; sold short BHP Billiton Limited (BHP) as it ran into its 20DMA downtrend (trades in commodities explained in upcoming piece).
Daily T2108 vs the S&P 500
")
Black line: T2108 (measured on the right); Green line: S&P 500 (for comparative purposes)
Red line: T2108 Overbought (70%); Blue line: T2108 Oversold (20%)
Weekly T2108

*All charts created using freestockcharts.com unless otherwise stated
The charts above are the my LATEST updates independent of the date of this given T2108 post. For my latest T2108 post click here.
Related links:
The T2108 Resource Page
Expanded daily chart of T2108 versus the S&P 500
Expanded weekly chart of T2108
Be careful out there!
Full disclosure: long SVXY shares, long SSO shares and call options, long UVXY put options, short AUD/JPY, long GOOG call options, long AAPL put spread, short BHP