
AT40 = 69.6% of stocks are trading above their respective 40-day moving averages (DMAs)
AT200 = 56.3% of stocks are trading above their respective 200DMAs (13-month high)
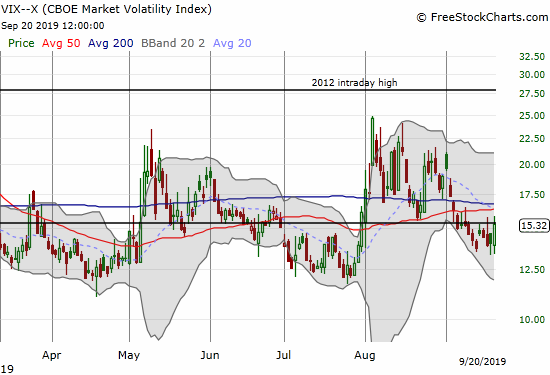
VIX = 15.3
Short-term Trading Call: neutral
Stock Market Commentary
A Broken Record
Last week had some big moments. Looking back, the week looks like a broken record. The Federal Reserve delivered another rate cut as expected and sounded as muddled as ever about current economic conditions and the need for rate cuts.
“Information received since the Federal Open Market Committee met in July indicates that the labor market remains strong and that economic activity has been rising at a moderate rate…
In light of the implications of global developments for the economic outlook as well as muted inflation pressures, the Committee decided to lower the target range for the federal funds rate to 1-3/4 to 2 percent. This action supports the Committee’s view that sustained expansion of economic activity, strong labor market conditions, and inflation near the Committee’s symmetric 2 percent objective are the most likely outcomes, but uncertainties about this outlook remain.”
Just when the market looked ready to put full faith in a satisfactory resolution of the U.S. vs China Trade War, the news twisted in the wind. Friday morning, news went out that the U.S. granted a temporary exemption to some tariffs on China. Next, China cancelled a visit to Montana – a move interpreted as being a blow to the prospects of China buying farm U.S. products. Even the sharp pullback in oil prices looked like the broken record of the market’s tendency to move toward complacency as fast as possible.
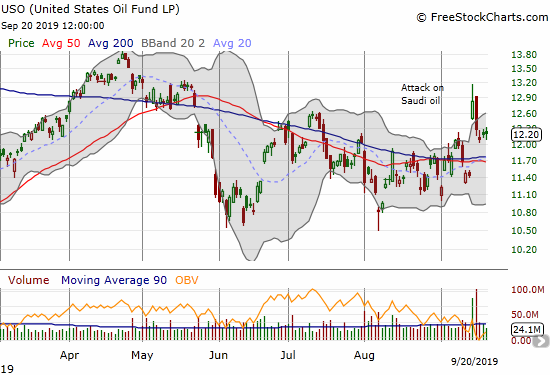
The United States Oil Fund (USO) did manage to stop losing altitude over the last three trading days. USO stopped selling right at a pullback of 50% from the big pop on Monday.
Overbought Pivoting with Indices Pulling Back from Resistance
AT40 (T2108), the percentage of stocks trading above their respective 40-day moving averages (DMAs), only spent three days in overbought territory (above 70%). On Tuesday, my favorite technical indicator printed its closing high for the cycle at 72.2%. The last two trading days of the week delivered AT40 at 69.8% and 69.6%. AT40 is essentially pivoting around the overbought threshold. This behavior keeps my short-term trading call firmly on neutral.
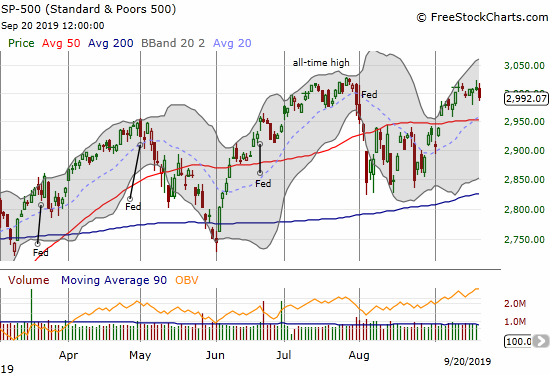
The S&P 500 (SPY) also struggled to make progress last week. After the slight gap down on Monday in response to the spike in oil prices, the index crawled its way higher even through some post-Fed uncertainty. Friday’s 0.5% loss took the S&P 500 to a marginal closing low for the week. I call the overall results a stalemate.
The iShares Russell 2000 Index Fund ETF (IWM) was a little more definitive as it lost ground every day last week. Like the S&P 500, IWM stopped cold at its previous highs.
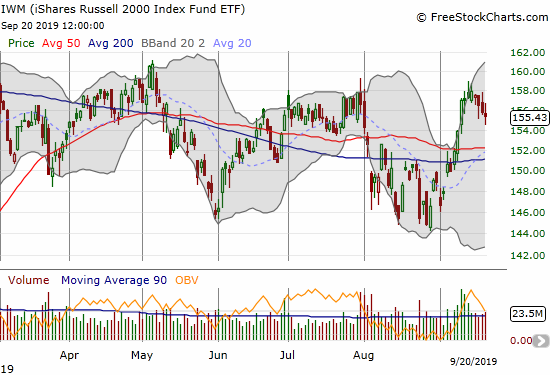
The iShares Russell 2000 Index Fund ETF (IWM) also failed at its prior peak.
What Worry?
Despite the potential ominous implications of major indices all failing to break through previous highs, the volatility index (VIX) could not break through its own pivot at 15.35. That line provided reliable resistance for the entire week, even on Friday when the VIX jumped 9.0%. I plan to reload on long volatility plays on a close above this line. Note well that previous breakouts above the pivot peaked within a few days.
Stock Chart Reviews – Bearish
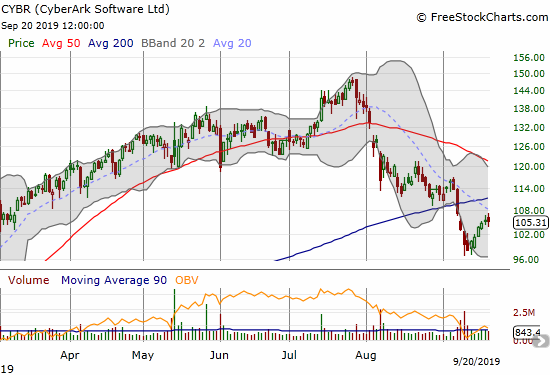
CyberArk Software (CYBR)
CyberArk Software (CYBR) peaked at its all-time high in July. Since then, the stock is down 28.3% with a 50 and 200DMA breakdown. The stock is in a bearish position until it can hurdle 200DMA resistance. Even after that, downtrending resistance at the 50DMA should be tough.
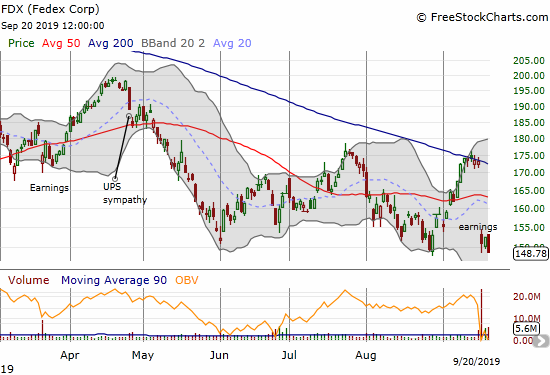
Fedex (FDX)
Fedex (FDX) suffered an awful post-earnings response. The big gap down confirmed declining 200DMA resistance. Friday’s close took FDX to a new 3+ year low. The stock look like a short with a tight stop at a post-earnings high.
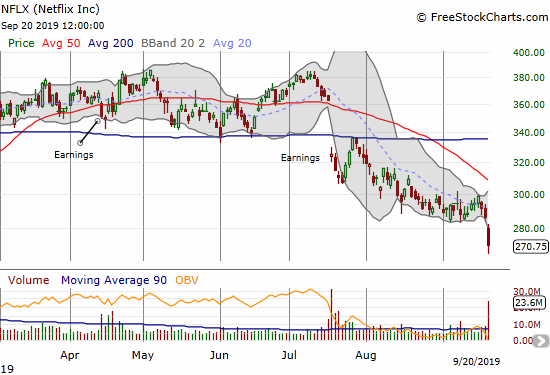
Netflix (NFLX)
I have been bearish on Netflix (NFLX) for most of this year. In mid-August, I locked in on maintaining bearish positions in the stock after the 200DMA received confirmation as overhead resistance. On Friday, NFLX lost 5.5%; I closed a short position a little early, thinking the stock would rebound as it has done in previous sharp selling bouts.
Analysts have started rolling out more bearish reports on NFLX. On Thursday, Bernstein put a $230 floor on NFLX. On Friday, Evercore raised the alarm over slowing international app downloads. Tracking those numbers is a sneaky way to get a peek into likely subscriber growth trends.
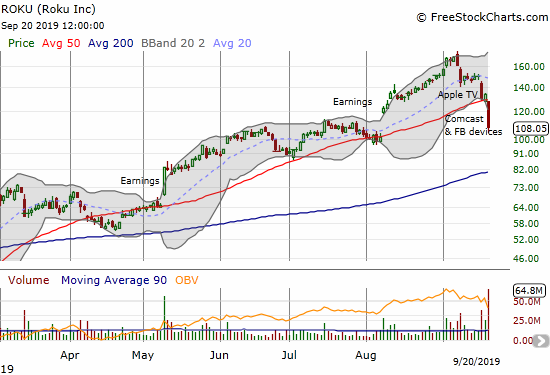
Roku (ROKU)
A top in Roku (ROKU) looks confirmed. The Apple TV announcement created a definitive top in the stock, and Comcast and Facebook device announcements confirmed the top with a 50DMA breakdown. The post-earnings gap up from $100 looks like the obvious downside target for the short-term. Looking further out, I am expecting a 200DMA challenge. ROKU’s next earnings report should create a fundamental juncture for a company whose competitive fortunes may have taken a sharp turn southward.
Stock Chart Reviews – Bullish
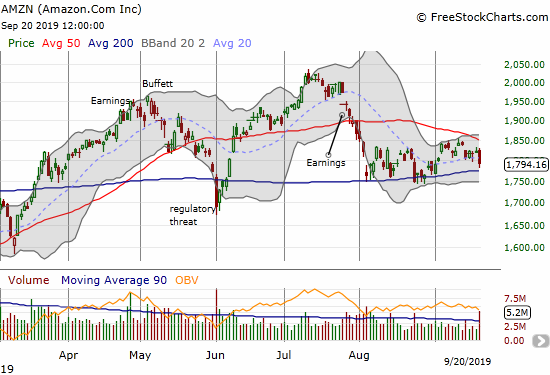
Amazon.com (AMZN)
Amazon.com (AMZN) actually does not look healthy to me given how long the 50DMA has held as resistance even with the S&P 500 challenging all-time highs. Still, AMZN stays in the bullish column as long as it trades above 200DMA support.
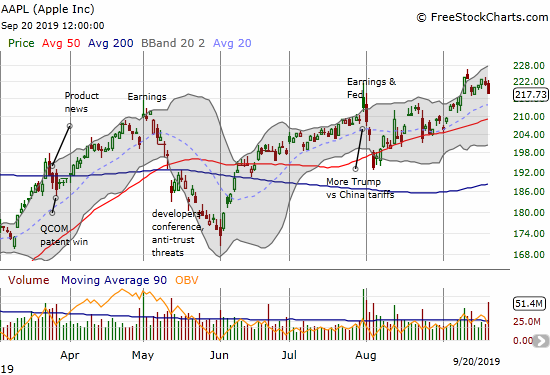
Apple (AAPL)
Apple (AAPL) took a dip on the Trade War headlines just in time to bring an end to the latest upward momentum. AAPL is one of the few big cap tech stocks keeping pace with the S&P 500.
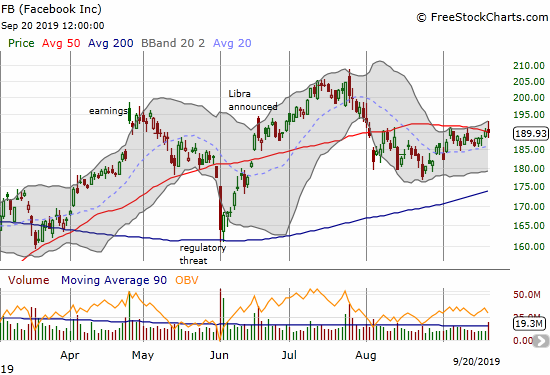
Facebook (FB)
Facebook (FB) is a stretch as a bullish stock. I am giving a nod to the marginal 50DMA breakout. However, a pullback from these levels would raise a warning about a potential head and shoulders top: the left shoulder from April earnings and the head at the post-Libra peak…
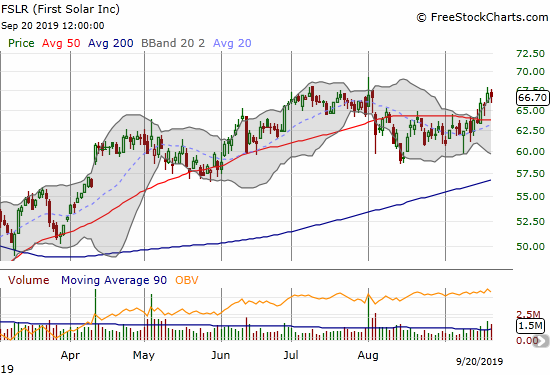
First Solar (FSLR)
I lost track of First Solar (FSLR) again. Last week, FSLR broke out from 50DMA resistance and got back on my radar. The path since April has been slow going, so I am good waiting for a clean breakout to a 2019 high to start accumulating a position.
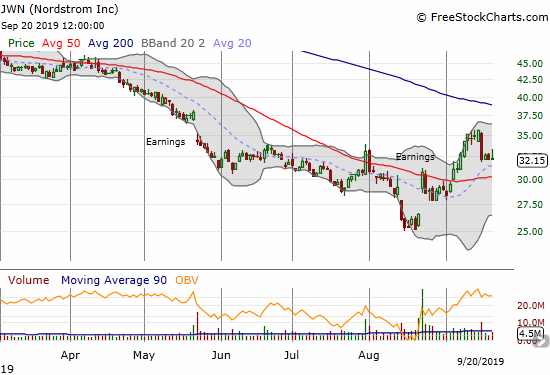
Nordstrom (JWN)
Retail stocks were slammed last week as part of a sudden rotation out of a bunch of relief rallies. JWN lost 9.8% last Tuesday. Somehow, the selling stopped cold there. I am giving JWN credit for resilience. I am a buyer on a test of 50DMA support with a target at overhead declining 200DMA resistance.
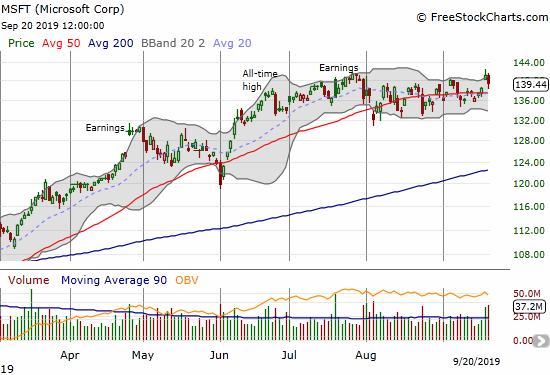
Microsoft (MSFT)
Microsoft (MSFT) has churned since June. The stock popped on Thursday on news of a fresh $40B authorization for share buybacks. Sellers promptly returned on Friday. I think MSFT’s relative stability and resilience make it a candidate for long-dated calls and call spreads assuming MSFT executes on its buyback. The repurchases could provide that extra little nudge MSFT needs to breakout and start a fresh rally.
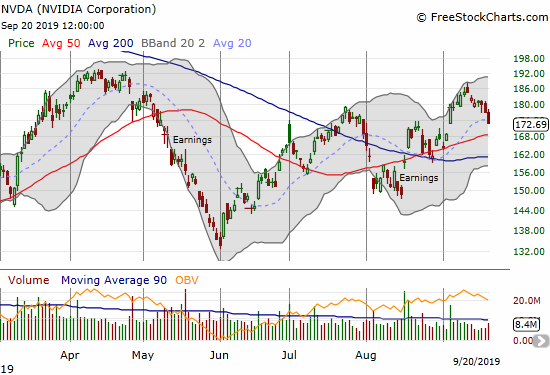
NVIDIA (NVDA)
NVIDIA (NVDA) is chopping its way higher but had a setback last week. I want to add call options to my shares on a test of 50/200DMA supports.
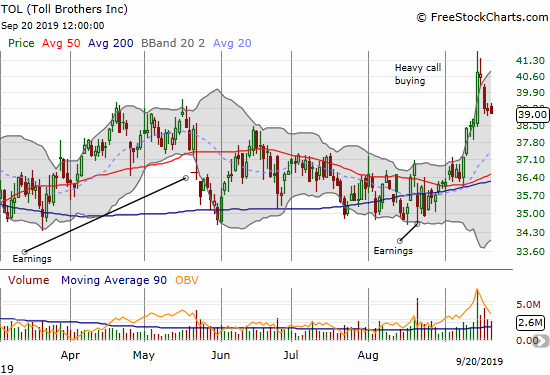
Toll Brothers (TOL)
The sudden buying enthusiasm in Toll Brothers (TOL) continues waning. I added more call options on Friday’s weakness under the assumption that the low from the day of heavy call buying will hold.
— – —
FOLLOW Dr. Duru’s commentary on financial markets via email, StockTwits, Twitter, and even Instagram!
“Above the 40” uses the percentage of stocks trading above their respective 40-day moving averages (DMAs) to assess the technical health of the stock market and to identify extremes in market sentiment that are likely to reverse. Abbreviated as AT40, Above the 40 is an alternative label for “T2108” which was created by Worden. Learn more about T2108 on my T2108 Resource Page. AT200, or T2107, measures the percentage of stocks trading above their respective 200DMAs.
Active AT40 (T2108) periods: Day #175 over 20%, Day #14 over 30%, Day #26 over 40%, Day #10 over 50%, Day #9 over 60%, Day #2 under 70% (previous overbought period lasted 3 days)
Daily AT40 (T2108)
")
Black line: AT40 (T2108) (% measured on the right)
Red line: Overbought threshold (70%); Blue line: Oversold threshold (20%)
Weekly AT40 (T2108)

*All charts created using FreeStockCharts unless otherwise stated
The T2108 charts above are my LATEST updates independent of the date of this given AT40 post. For my latest AT40 post click here.
Be careful out there!
Full disclosure: long VIXY calls, long USO calls and puts, long TOL calls, long NVDA, short ROKU shares and long ROKU calendar put spread, long AAPL calls and calendar call spread
*Charting notes: FreeStockCharts stock prices are not adjusted for dividends. TradingView.com charts for currencies use Tokyo time as the start of the forex trading day. FreeStockCharts currency charts are based on Eastern U.S. time to define the trading day.