
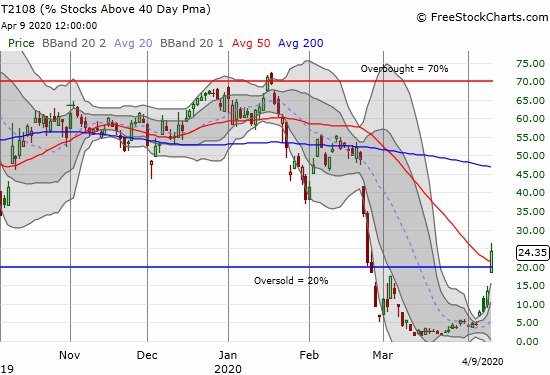
AT40 = 24.4% of stocks are trading above their respective 40-day moving averages (DMAs) (ended 31-day oversold period)
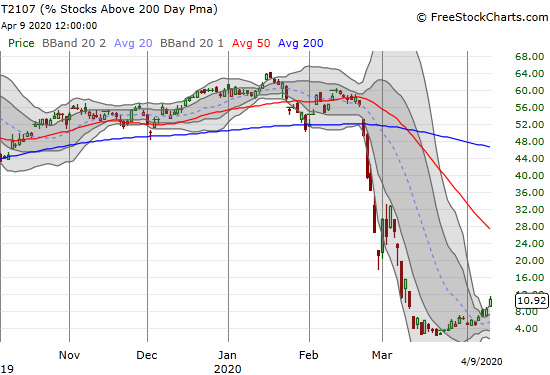
AT200 = 10.9% of stocks are trading above their respective 200DMAs
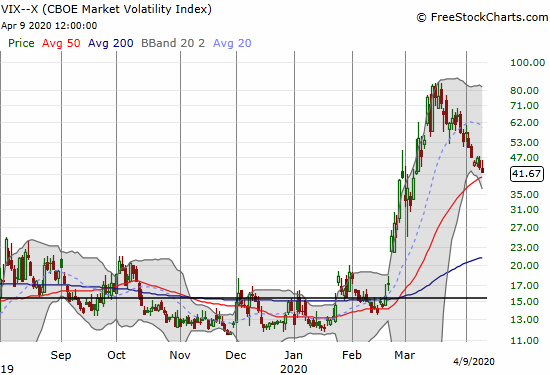
VIX = 41.7
Short-term Trading Call: cautiously bullish
Stock Market Commentary
“The Federal Reserve on Thursday took additional actions to provide up to $2.3 trillion in loans to support the economy. This funding will assist households and employers of all sizes and bolster the ability of state and local governments to deliver critical services during the coronavirus pandemic…
The Main Street Lending Program will enhance support for small and mid-sized businesses that were in good financial standing before the crisis by offering 4-year loans to companies employing up to 10,000 workers or with revenues of less than $2.5 billion. Principal and interest payments will be deferred for one year…
The Federal Reserve remains committed to using its full range of tools to support the flow of credit to households and businesses to counter the economic impact of the coronavirus pandemic and promote a swift recovery once the disruptions abate.”
“Federal Reserve takes additional actions to provide up to $2.3 trillion in loans to support the economy”, Federal Reserve press release, April 9, 2020
Last Monday, I celebrated a fresh dose of bullishness for the stock market in the form of convincing breakouts above declining 20-day moving averages (DMAs). The green shoots bloomed right after I finished grousing about stiff resistance from the same 20DMAs. Buyers printed an extra show of force by setting new highs since the rebound from March lows.
The green shoots bloomed right into a spring out of oversold conditions. FINALLY, the oversold period came to an end after 31 days cycling from hope to despair and collapse to fresh hope to disappointment to the current triumph.
Oversold (No More!)

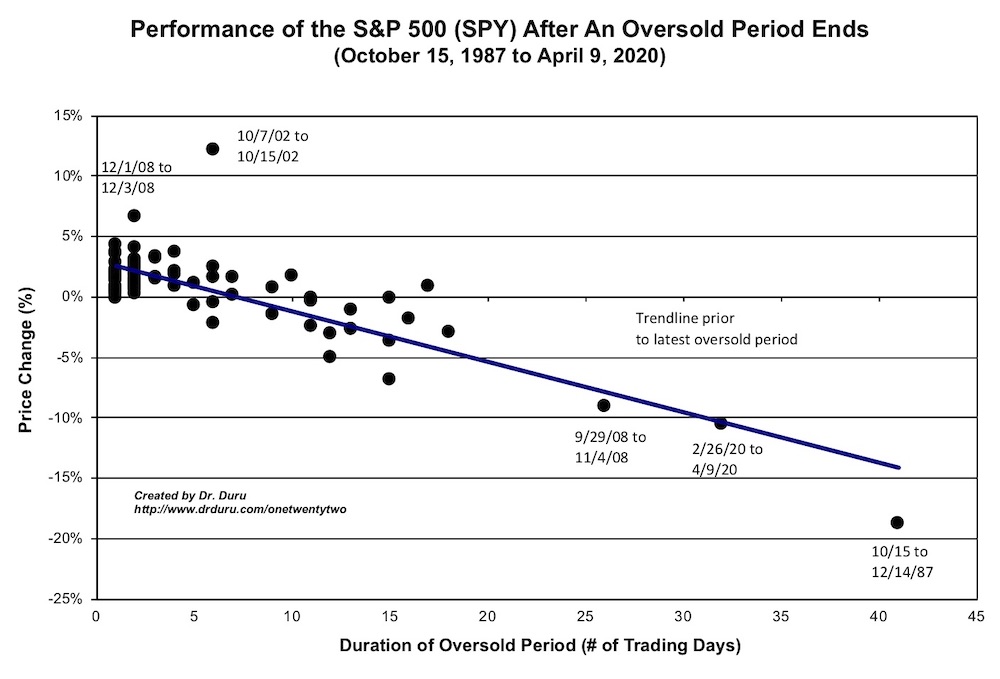
I call the stock market oversold when AT40 (T2108), the percentage of stocks trading above their 40DMAs, closes below 20%. The oversold period ends the day AT40 closes above 20% again. The duration of the oversold period lasts from the first oversold day to the day before the last oversold day. This past oversold period lasted an astonishing 31 days – the second longest oversold period since at least the 1987 stock market crash. I held out hope that a new record would not happen and the market delivered.
From the first oversold day to the burst from oversold conditions, the S&P 500 (SPY) lost 10.5%. For many days through this oversold period, I posted a chart showing the expected performance of the S&P 500 given the length of the oversold period. This oversold period nailed the trendline in picture-perfect style. This trendline formed the basis of my upside expectations ever since the rebound from the March bottom began.
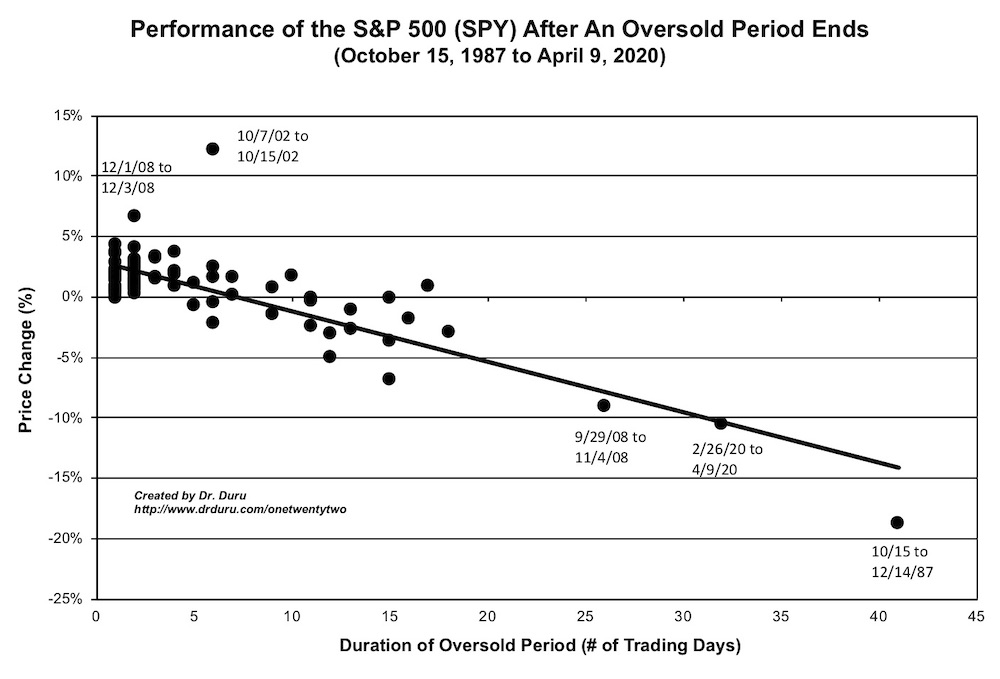
The NEW chart is the one below where I have drawn a new trendline incorporating the latest oversold period. Notice the difference with the previous chart is negligible. This is a chart of history!
AT200 (T2107), the percentage of stocks trading above their respective 200DMAs, only closed at 10.9%. From a longer-term perspective, a LOT of upside remains in the stock market as a recovery takes hold.
The Stock Market Indices
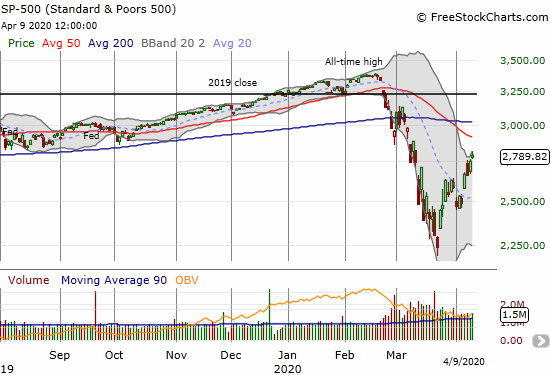
The S&P 500 (SPY) gained 1.4% on Thursday to end the holiday-shortened week with a 12.1% gain. This performance was about as bullish a follow-through as I could imagine coming from the 20DMA breakout that launched the week. Overhead resistance from the declining 50DMA is now in play, but it will take exceptional buying power to get there from here given the S&P 500 is now at its upper Bollinger Band (BB). Is $2.3 trillion plus enough?
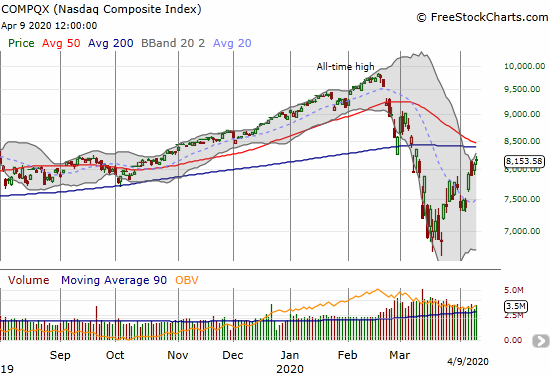
The NASDAQ (COMPQX) actually under-performed the S&P 500 with a 0.8% gain on the day. For the week, the NASDAQ gained 10.6%, also under-performing the S&P 500. The NASDAQ is already perilously close to overhead resistance. The converging 50 and 200DMAs are menacing obstacles for a market that has already spent a lot of buying power in the past 3 weeks. Still, the NASDAQ’s overall relative strength shows in full force with the tech-laden index trading at “only” a 6-month low.
Volatility
Despite the celebration of the end of the oversold period, the volatility index (VIX) remains very elevated. The VIX lost another 3.9% with a definitive downtrend from the historic highs still intact.
The Short-Term Trading Call
The oversold period ended up being a triumph of technicals in the face of collapse, despair, and horrific economic data. While many are cranking numbers on economic and epidemiological models, the price action in the stock market carried a logic all its own. My favorite technical indicator, AT40, guided me to the finish line even after it originally melted in the face of an historic collapse in the stock market. One truth remains: an oversold period must come to an end at some point. That end can be profitable with persistent application.
As I mentioned before, if not for the horrible macro-economic environment, I would dare to call a bottom in the stock market. The high amount of uncertainty renders nearly futile attempts to measure the scale and scope of the economic environment. I agree with Brian Belski, chief investment strategist at BMO Capital, who insisted: “Stop trying to figure out whether or not it’s an ‘L’ or ‘V,’ and just let the market and the companies come back and get back to business…trying to call a peak in claims is like trying to call a peak in coronavirus and the stock market. It’s a fool’s game…look for a second derivative less negative.” The analogue for the stock market is stop trying to figure out whether THE bottom is in and recognize that at the other side of this crisis will be higher asset prices thanks to a directional normalization assisted by massive and historic monetary and fiscal measures.
The AT40 trading strategy directs conservative traders to start buying the market after the oversold trading period ends. The huge caveat is the risk of large drawdowns from waiting so long to buy. That caveat is extremely large this time around with the last oversold period delivering a loss of 28.2% at its worst. The caveat is especially important given the limited upside between here and overhead resistance. At this juncture, I am content to sit on my shares in ProShares Ultra S&P500 (SSO) and buy individual stocks on the next dip. The upcoming earnings season should deliver a lot of buyable dips as the harsh reality of business conditions reignites some amount of panic selling and the accompanying despair.
I will have another major decision to make once the major indices slam into overhead resistance. I will no doubt shed another tranche of longs at that point. My short-term trading call will stay cautiously bullish until fresh oversold conditions flip me back to outright bullish. I will flip the trading call to neutral if the major indices break out above resistance from here, only because I will be wary about a quick return to overbought conditions from there. For now, I cannot foresee a scenario that flips me to (cautiously) bearish anytime soon.
Stock Chart Reviews – Below the 50DMA
Alibaba Group Holding (BABA)
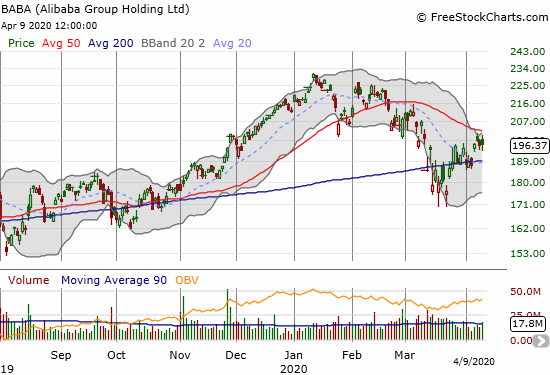
Alibaba Group Holding (BABA) managed to test and confirm 200DMA support in the first days of April. The bigger challenge is now the downtrending 50DMA. I am a buyer on a confirmed 50DMA breakout.
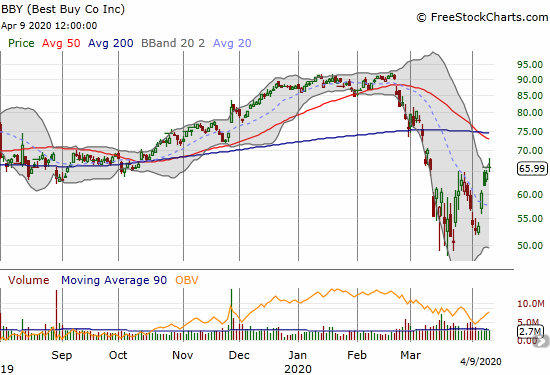
Best Buy (BBY)
Best Buy (BBY) was one of my early oversold plays. I sold a March $65 put just as the stock was testing its 200DMA for the second time. I assumed the stock would hold support as the oversold period came to an imminent end. Instead, the culture of collapse took the stock down another 33%, and I was assigned the put. I held on through the choppy rebound and was able to take a small profit into Thursday’s rally. While I was of course relieved, the overall experience was poor in terms drawdown vs profit.
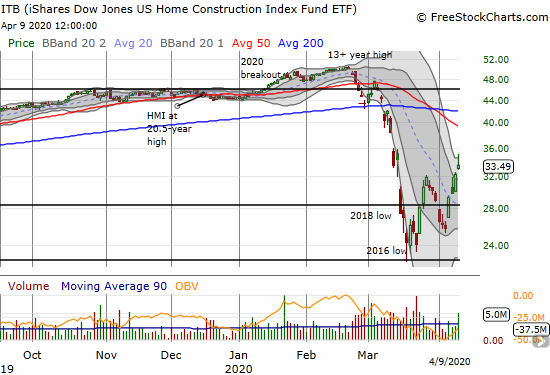
iShares Dow Jones U.S. Home Construction ETF (ITB)
The iShares Dow Jones U.S. Home Construction ETF (ITB) has made a lot more progress than I could have imagined back when housing-related stocks completely crashed and collapsed. I am still holding ITB shares as part of the seasonal trade, but I used Friday’s rally to take profits on individual home builders and housing plays. If not for the poor macro-economic environment, like so many other stocks and ETFs, I would declare a confirmed bottom in ITB given the higher low and the breakout from the 20DMA downtrend. Moreover, ITB successfully tested a major support level in the form of the 2016 low.
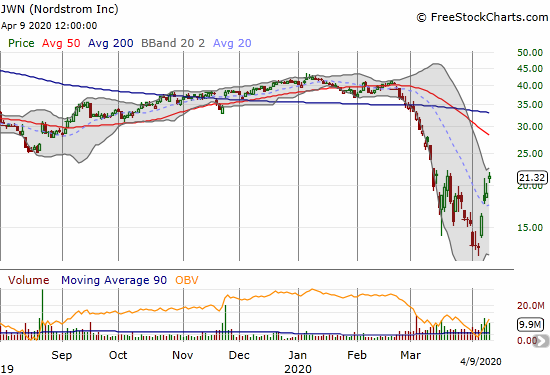
Nordstrom (JWN)
At the end of March I cast a wary eye toward Nordstrom (JWN) because it was one of a select group of stocks that made a fresh multi-year low after the rest of the stock market made major lows around March 23rd. After JWN hurdled its 20DMA downtrend, I jumped on some call options. For this trade, I learned the lessons from the broad-based 20DMA breakouts the day before that such a move is bullish and tradeable. I took profits on the call options on Thursday. JWN’s bottoming pattern comes in the form of a hammer on April 3rd confirmed by the 24.1% surge the day after.
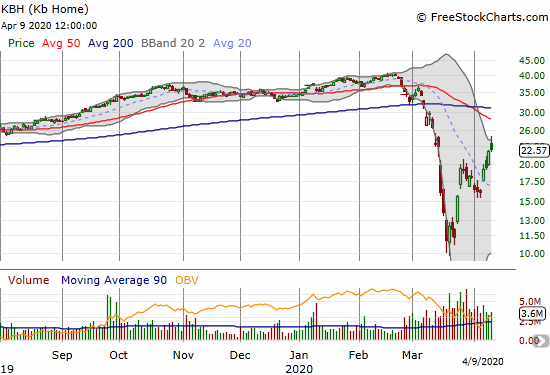
KB Home (KBH)
KB Home (KBH) is experiencing a nice run-up since its 20DMA breakout. I took profits on KBH call options and shares after considering the stock “close enough” to overhead 50DMA resistance. Like many home builders, I fully expect these stocks to test lower support levels like the 20DMA or even the March lows in some cases. Since the seasonal period for home builders is coming to an end, I will be particularly hesitant about buying the dips for a while.
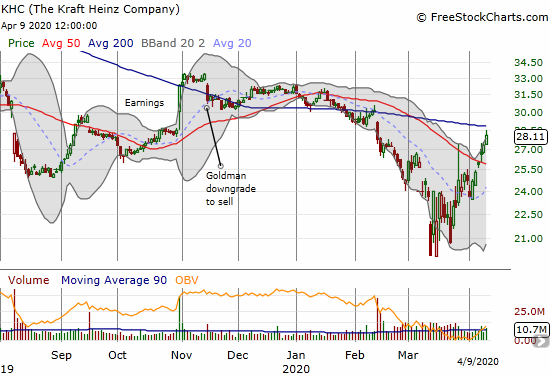
The Kraft Heinz Company (KHC)
The Kraft Heinz Company (KHC) was a beaten up stock going into the collapse in financial markets. The stock bottomed out at a fresh all-time low over two weeks of wide-ranging churn. The recent 50DMA breakout is encouraging, but the stock is still not investable until it pushes above its 200DMA.
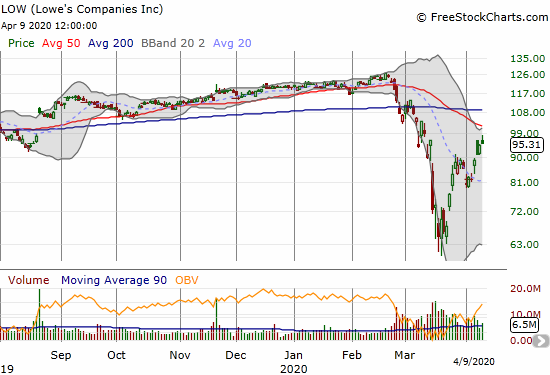
Lowe’s Companies (LOW)
The Lowe’s Companies (LOW) was a tough call for me. I wanted to hold the stock but the tremendous 46% gain off the March lows meant that pressing my luck at 50DMA resistance presented a poor risk/reward scenario. I took profits on shares. I still have an outstanding April $100/110 call spread that suddenly has some salvage value. I will be pressed to take whatever value remains on Monday or Tuesday.
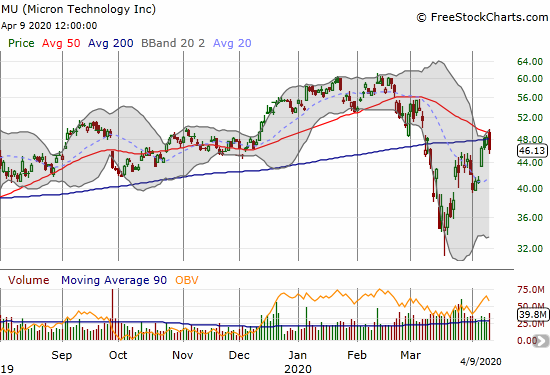
Micron Technology (MU)
Semiconductors in general rebounded very well from their March lows. Last week, Micron Technology (MU) managed to directly challenge overhead resistance at its 50 and 200DMAs. Unfortunately, semis may also lead the path back down. MU formed a bearish engulfing topping pattern by gapping up and then directly selling off to close below the previous day’s intraday low. This pattern is all the more bearish given the failure at a downtrending 50DMA and a fresh close under the 200DMA. MU is now in the deadzone. A close above the bearish engulfing pattern would be exceptionally bullish. A buy at lower prices has the best risk/reward at our around natural supports like the 20DMA, which is starting to turn upward.
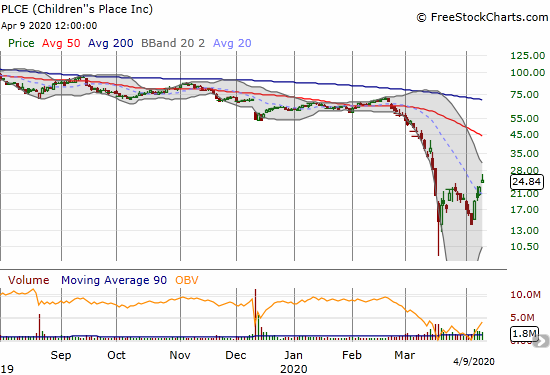
Children’s Place (PLCE)
If I had not seen a bullish analyst report, I would have stopped out of my Children’s Place (PLCE) holding at the exact bottom of the last pullback. This experience was another reminder of just how tough it is to stay focused on upside opportunity in the middle of a calamity in financial markets. I took profits on my position on Thursday. Next time, I will buy PLCE on a test of support and/or a clearer breakout than the last enrty.
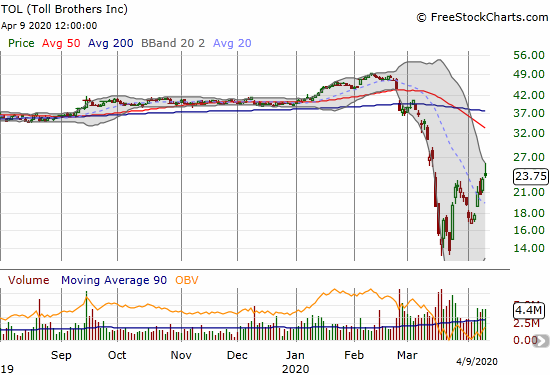
Toll Brothers (TOL)
Toll Brothers (TOL) is up 72.1% from its March closing low. Because I started accumulating TOL a little early in the oversold period, I was not positioned well for buying even more right at those lows. It was a “clear” buying point because TOL was testing a low that held from October, 2008 to the final trough in the housing market in November, 2011. On Thursday I sold a profitable call option and shares I bought on March 16th. I reduced exposure given I have puts which will likely be assigned to me for April expiration. I have not yet decided what, if anything, to do with shares I bought earlier in the oversold period. TOL remains on my buy list when the seasonal trade starts up again in October/November. (With hindsight, I can see I was far too bullish about TOL!)
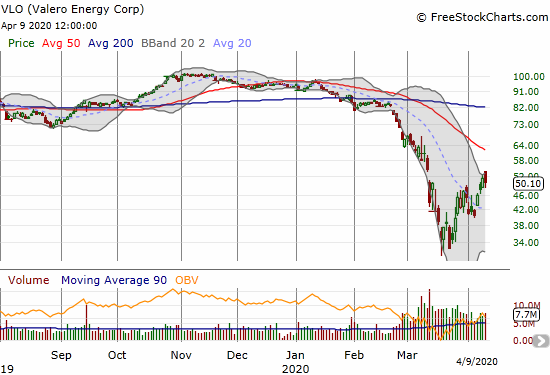
Valero (VLO)
My trade in Valero (VLO) gained faster than I expected. Like so many positions, I took profits on my shares soon after Thursday’s open. I am still holding my long-term calendar call spread.
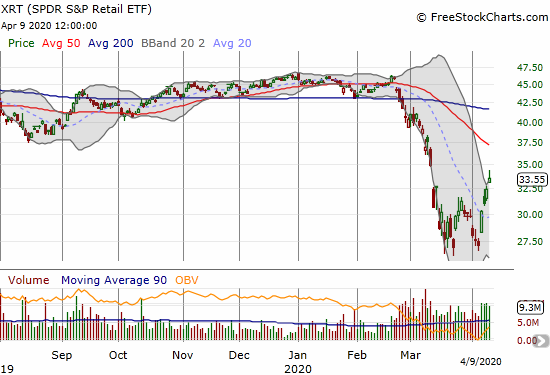
SPDR S&P Retail ETF (XRT)
I am watching the SPDR S&P Retail ETF (XRT) more closely given some of the largest gains during the oversold period came from retail (and other consumer discretionary) stocks. XRT made a nice double bottom pattern across March and April, so I am looking at that level as a key element of support for future sell-offs.
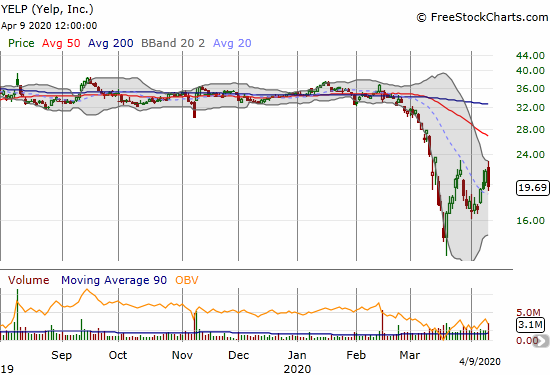
Yelp (YELP)
Yelp (YELP) could become one of my favorite tech plays on the consumer discretionary space. I consider the company a kind of aggregated indicator of the health of consumer discretionary: people cannot and will not provide recommendations when businesses are closed and/or income is lacking. On Thursday, Yelp released an 8K that revealed how badly business has suffered. The company had to make major cuts in its workforce. From the 8K:
“Over the past several weeks, the Company has seen significant drops in consumer engagement with businesses on its platform that rely on foot traffic, human contact or in-person interactions. By the end of March of this year, page views and searches (which are measured on a combined basis) for businesses in the Company’s most trafficked category, restaurants, had dropped approximately 60% compared to the beginning of the month, while page views and searches for businesses in the services category,* which generate a majority of the Company’s revenue, dropped approximately 40% over the same period…
In addition to reductions and deferrals in spending, the Plan’s cost-cutting measures include workforce reductions affecting approximately 1,000 employees and furloughs affecting approximately 1,100 additional employees, as well as salary reductions and reduced-hour work weeks. The Company is also deferring share repurchases under its stock repurchase program indefinitely.”
Stock Chart Reviews – Above the 50DMA
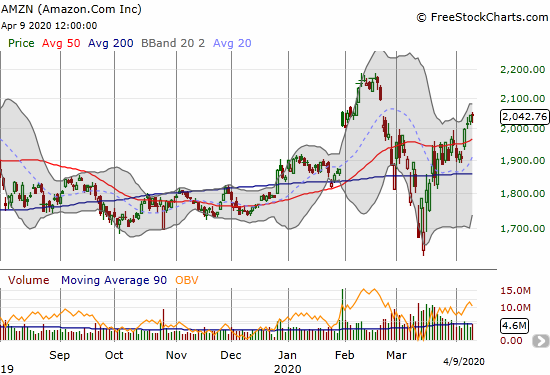
Amazon.com (AMZN)
Amazon.com (AMZN) has fared very well during this period of stress. AMZN actually gained 3.2% over the oversold period. The stock can even see “over the horizon” its all-time high set in February.
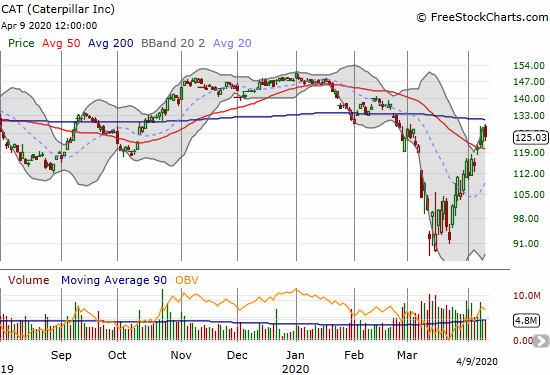
Caterpillar (CAT)
As Caterpillar (CAT) approached 200DMA support, I decided to go back to buying puts as a hedge against bullishness. I think this is a good hedge considering the uncertainties with the end of the oversold period. If CAT can break out from this resistance, the entire market should be in general “full bull” mode with a breakout for the S&P 500 in parallel or on the way.
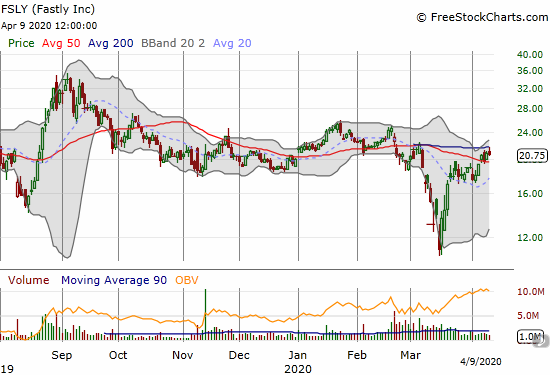
Fastly (FSLY)
Unlike many stocks, Fastly (FSLY) did not provide a fresh buying dip after the first bounce from March lows. I took profits on the first rebound and remain without a position. I will be eagerly buying the next dip whenever it comes. At best, I am assuming FSLY returns to the trading range that dominated the price action for the 5 months or so going into the collapse in the stock market.
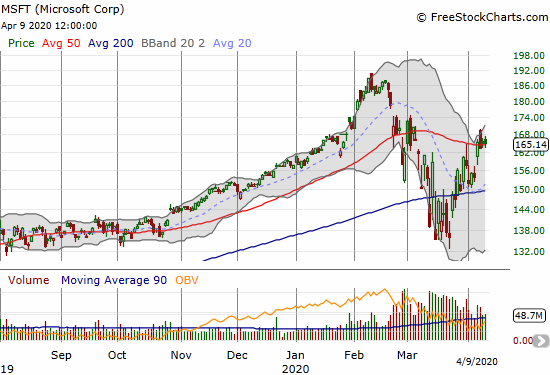
Microsoft (MSFT)
As I mentioned in an earlier post, I now think of Microsoft (MSFT) as the leading tell for the market’s mood instead of Apple (AAPL). While AAPL remains below a declining 50DMA, MSFT is clinging to its 50DMA as support. If MSFT moves to a new high for this rebound period, I will assume the stock market is getting a fresh dose of bullish energy. It will be interesting cross-referencing MSFT and CAT. (Note I missed out on a great selling opportunity when MSFT surged to an intraday high on Tuesday – that move briefly confirmed the previous day’s 50DMA breakout).
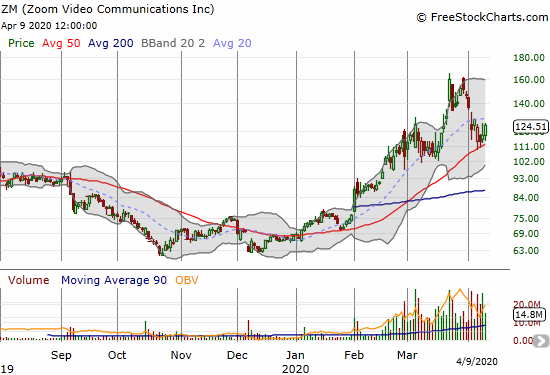
Zoom Video Communications (ZM)
Zoom Video Communications (ZM) is rebounding in near picture-perfect style off its 50DMA support. I will buy the stock around these levels with a stop below $108, the most recent intraday lows. I just hope the stock does not get away from me on Monday.
— – —
FOLLOW Dr. Duru’s commentary on financial markets via email, StockTwits, Twitter, and even Instagram!
“Above the 40” uses the percentage of stocks trading above their respective 40-day moving averages (DMAs) to assess the technical health of the stock market and to identify extremes in market sentiment that are likely to reverse. Abbreviated as AT40, Above the 40 is an alternative label for “T2108” which was created by Worden. Learn more about T2108 on my T2108 Resource Page. AT200, or T2107, measures the percentage of stocks trading above their respective 200DMAs.
Active AT40 (T2108) periods: Day #1 over 20% (ending 31 days oversold, under 20%), Day #33 under 30%, Day #44 under 40%, Day #35 under 50%, Day #54 under 60%, Day #58 under 70%
Daily AT40 (T2108)
")
Black line: AT40 (T2108) (% measured on the right)
Red line: Overbought threshold (70%); Blue line: Oversold threshold (20%)
Weekly AT40 (T2108)

*All charts created using FreeStockCharts unless otherwise stated
The T2108 charts above are my LATEST updates independent of the date of this given AT40 post. For my latest AT40 post click here.
Be careful out there!
Full disclosure: long QQQ shares, long SSO, short UVXY shares and long UVXY call spread, long CAT puts, long ITB, long LOW call spread, long TOL shares and call and short put, long VLO calendar call spread, AAPL calendar call spread
*Charting notes: FreeStockCharts stock prices are not adjusted for dividends. TradingView.com charts for currencies use Tokyo time as the start of the forex trading day. FreeStockCharts currency charts are based on Eastern U.S. time to define the trading day.
Nice to see that your optimistic world view remains… You can’t fight Powell and your trading call is correct for the very short term. However in the last three weeks the fed has managed to blow the economic bubble to at least 1.5x the size it was at the ath’s. Given JPMs prediction of a 40% GDP drop. IF this bubble pops. Think about a 2000 plus point drop in the S&P in weeks. The only thing that might save it is fed direct stawk purchases… Then the world will have changed…
I take it one step at a time and try not to over-project. So if another market collapse is coming, I will at least be prepared by not over-committing to the long side here. Not to mention I am maintaining some key “backstops” so as not to get completely blindsided by a 5-10% drop on a market open!