The Healthcare Stock Index (XLV) Has Topped Out

At this point, everyone should be used to looking at charts of stocks and indices that look like they are topping out, many in climactic fashion (click here for a review of Caterpillar; click here for a review of Intel). Add healthcare stocks to the growing list. Specifically, the Health Care Select Sector SPDR ETF, … Read more

Stock Chart Reviews – Snapshots of the Fresh Bearishness

Stock Market Commentary: After much resistance to Fed hawkishness, the U.S. stock market gave way to fresh bearishness. The major indices dropped into new depths of the bear den. The stocks below are snapshots of the latest deterioration in the price action and decline in the technical health underlying the stock market. The ARK funds … Read more

Animal Spirits Rediscover Housing-Related Stocks

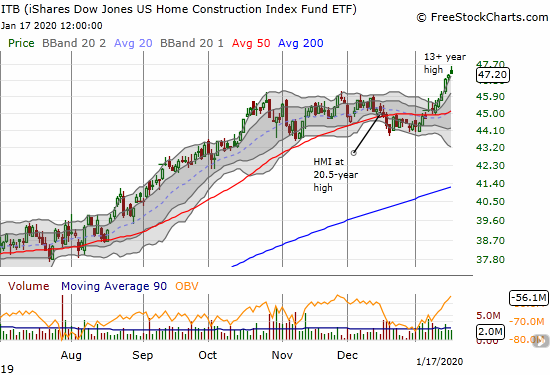
The iShares Dow Jones US Home Construction Index Fund ETF (ITB) is on a rare 6-day winning streak after confirming 50DMA support.

In recent weeks, the trade in the stocks of home builders provided timely reminders in the limited meaning in price action. The market periodically makes key “mistakes” that provide buying (or selling) opportunities. A Fresh Turning Point At the end of December, I described a “precarious divergence” between the stocks of home builders and the … Read more

The Stock Market Manages to Stretch Out of Overbought Conditions – Above the 40 (January 17, 2020)

AT40 = 69.6% of stocks are trading above their respective 40-day moving averages (DMAs) (ends 1-day overbought period) AT200 = 63.1% of stocks are trading above their respective 200DMAs VIX = 12.1Short-term Trading Call: neutral Stock Market Commentary The stock market finally pushed into overbought territory on Thursday. The breakout only lasted for a day. … Read more

Home Builders Withdraw As the Stock Market Celebrates

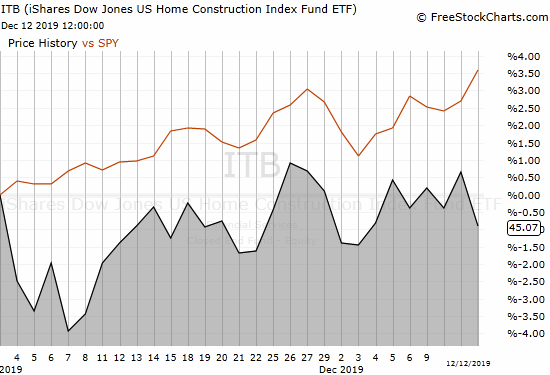
Since November, the performance of the iShares US Home Construction Index Fund ETF (ITB) has lagged that of the S&P 500 (SPY)

The seasonally strong period for home builders begins in November. For this period, home builders tend to outperform the S&P 500 (SPY) which is also in its own period of seasonal strength. So far, home builders have lagged significantly in what I continue to call the moment of truth for home builders. Since November, the … Read more

S&P 500 Performance During Overbought and Oversold Trading Conditions

Introduction The percentage of stocks trading above important moving averages provides good information on the breadth of the stock market. I use the percentage of stocks trading above their respective 40-day moving averages (DMAs) because the historical data are readily available for analysis. I call this indicator “AT40” as a shorthand for “above the 40DMA” … Read more

Above the 40 (December 26, 2018) – Oversold Chronicles: Stock Market Delivers Major Reprieve for the Post-Trump Reversal

AT40 = 6.5% of stocks are trading above their respective 40-day moving averages (DMAs) (oversold day #8)AT200 = 11.0% of stocks are trading above their respective 200DMAsVIX = 30.4 (down 15.7%)Short-term Trading Call: bullish Commentary Pick your favorite catalyst or explanation. I am sure there is good news (or the absence of bad news) out … Read more

T2108 Update (December 19, 2016) – The S&P 500 Makes A Feeble Return to Overbought Conditions

(T2108 measures the percentage of stocks trading above their respective 40-day moving averages [DMAs]. It helps to identify extremes in market sentiment that are likely to reverse. To learn more about it, see my T2108 Resource Page. You can follow real-time T2108 commentary on twitter using the #T2108 hashtag. T2108-related trades and other trades are … Read more

T2108 Update (December 13, 2016) – Whispering Warnings for the S&P 500 On December Fed Eve

(T2108 measures the percentage of stocks trading above their respective 40-day moving averages [DMAs]. It helps to identify extremes in market sentiment that are likely to reverse. To learn more about it, see my T2108 Resource Page. You can follow real-time T2108 commentary on twitter using the #T2108 hashtag. T2108-related trades and other trades are … Read more

T2108 Update (September 1, 2015) – Stock Market Sellers Boldly Press Into A Now Historic Oversold Period

(T2108 measures the percentage of stocks trading above their respective 40-day moving averages [DMAs]. It helps to identify extremes in market sentiment that are likely to reverse. To learn more about it, see my T2108 Resource Page. You can follow real-time T2108 commentary on twitter using the #T2108 hashtag. T2108-related trades and other trades are … Read more