Damage from the AI Trade Weighs on Market Breadth
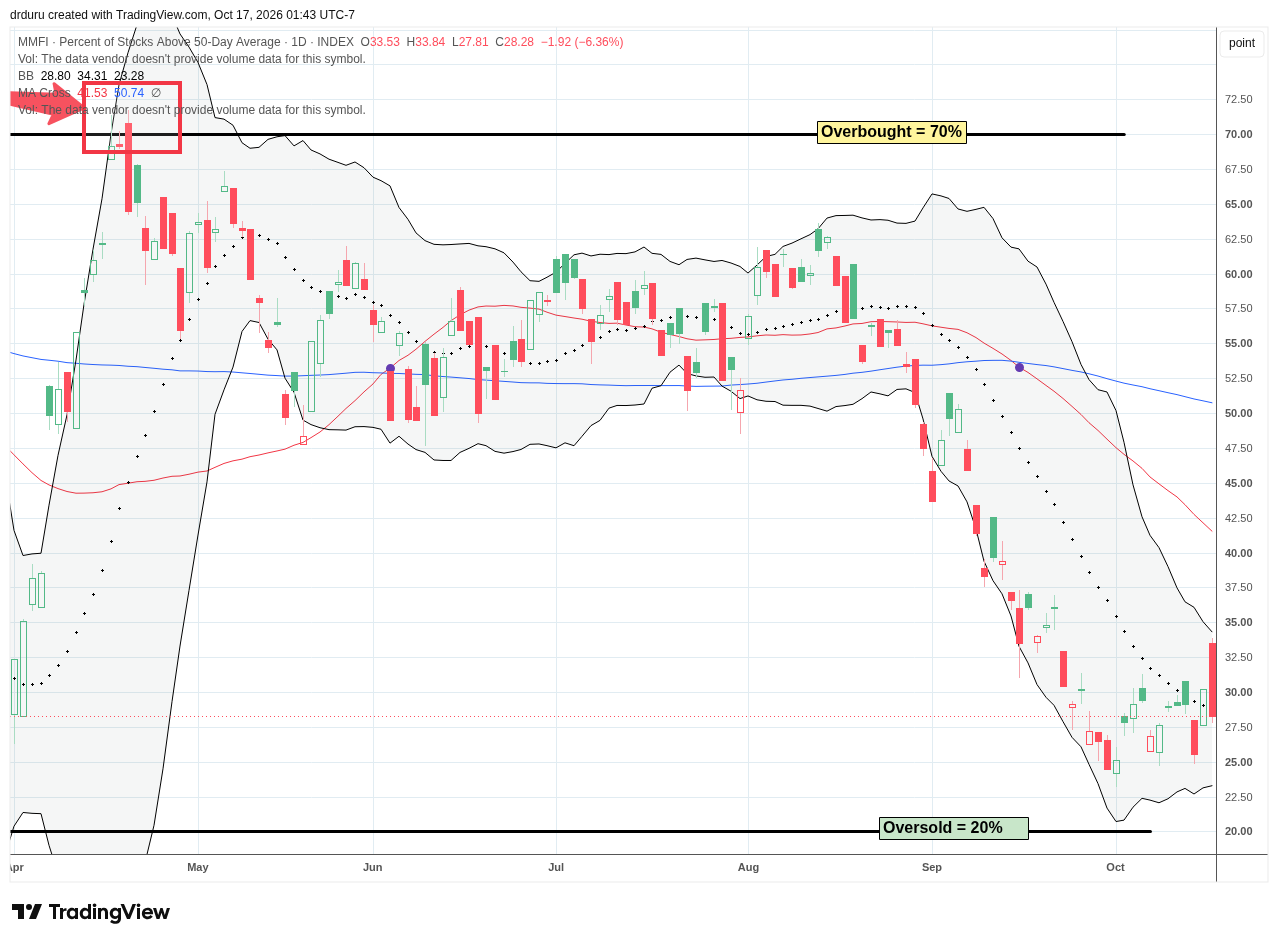
The Percent of Stocks Above 50 Day Average (AT50) gapped to a 3-week high before fading sharply to a loss that maintained the primary downtrend.

The Market Breadth Summary The Stock Market Summary Damage from the AI trade drove the NASDAQ to its worst weekly decline since June. A convergence of events and headlines has brought the market to another critical juncture, this time in the last of the stock market’s most dangerous months of the year. The renewed tech … Read more


Cracks Wide Open in the Stock Market – The Market Breadth

cracks wide open in the stock market

Stock Market Analysis Summary Market liquidity fears intensified across equities and crypto as market breadth continued to deteriorate. The major stock market indices confirmed bearish technical breakdowns. Major AI and tech stocks confirmed weakening momentum. The week ended with a relief rally after rate-cut expectations surged with Fed Governor Williams teasing a possible December easing. … Read more

Ugly, Breaking Down, but Oversold – The Market Breadth

oversold, ugly and breaking down (Credit: Duet AI)

Stock Market Commentary At the end of September, I asked skeptically whether an oversold bounce could prevent an October swoon. As I suspected at the time, the answer turned out to be no. The market-moving headlines for October have included weighty, tragic, and alarming news making for a demotivating trading environment. An oversold bounce earlier … Read more

Oversold Bounce Sends Signs of Life for Stocks – The Market Breadth

Oversold Bounce Sends Signs of Life for Stocks (Credit: Google Workspace Labs, AI-generated image)

Stock Market Commentary Get used to the sentiment shifts. One day the stock market went oversold and over hard. The next day, an oversold bounce shows signs of life for stocks. In particular a classic bottoming signal came in the form of the “hammer” candlestick. Together, the bounce from oversold territory and the bottoming hammer … Read more

The Bottom Falls Out of ARK

bottom falls out (Credit: Trap Door Open by comingstobrazil on Flickr)

Over a month ago, I uncovered a sunny thesis about a bottom for the ARK funds. The timing of that post happened to be the exact top of the cycle for the ARK funds. Moreover, the S&P 500 (SPY) was trading just under its 200-day moving average (DMA) (the blue in the chart below). Once … Read more