
(T2108 measures the percentage of stocks trading above their respective 40-day moving averages [DMAs]. It helps to identify extremes in market sentiment that are likely to reverse. To learn more about it, see my T2108 Resource Page. You can follow real-time T2108 commentary on twitter using the #T2108 hashtag. T2108-related trades and other trades are occasionally posted on twitter using the #120trade hashtag. T2107 measures the percentage of stocks trading above their respective 200DMAs)
T2108 Status: 11.9% (a plunge of 38%)
T2107 Status: 17.7%
VIX Status: 31.4 (up 10.4%)
General (Short-term) Trading Call: Bullish
Active T2108 periods: Day #8 below 20% (oversold), Day #9 under 30%, Day #32 under 40%, Day #72 under 50%, Day #89 under 60%, Day #287 under 70%
Reference Charts (click for view of last 6 months from Stockcharts.com):
S&P 500 or SPY
SDS (ProShares UltraShort S&P500)
U.S. Dollar Index (volatility index)
EEM (iShares MSCI Emerging Markets)
VIX (volatility index)
VXX (iPath S&P 500 VIX Short-Term Futures ETN)
EWG (iShares MSCI Germany Index Fund)
CAT (Caterpillar).
Commentary
T2108 took a fresh plunge that promises to extend this oversold period into the history books. T2108 plunged to 11.9% from 19.1% and marked an 8th straight day in oversold territory. Of the 66 oversold periods that have occurred from 1986 to 2014, only 14 (21%) have lasted over 8 days. The last oversold period that lasted at least as long as the current one was the 17-day stomach-churner in August, 2011 that was part of the debt ceiling madness.
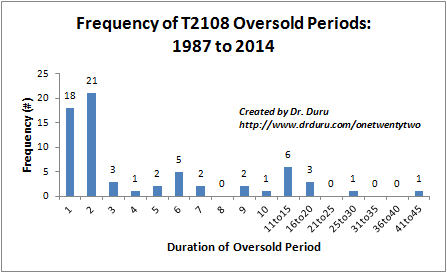
The chart above shows that 39 (59%) of all oversold periods last just one or two days. This skewed distribution is part of what makes the T2108 trading strategy work (and the variants I have developed since the original development of the strategy). Once the oversold duration gets as long as the current one, managing drawdowns become a more important component of the strategy. Risk management comes into play by watching VIX thresholds. For example, to start this week, I advised less aggressive traders to put buying plans aside given the VIX had returned to the “dangerzone.” With today’s (September 1, 2015) selling on the S&P 500 (SPY) for a 3.0% loss, the VIX moved deeper into the dangerzone.

As I noted in the last T2108 Update, the VIX’s move higher off the low from the day with the last big surge implies that even lower levels on the S&P 500 are ahead. The persistent elevation of the VIX means that the stock market should continue to experience large swings up AND down along the way.
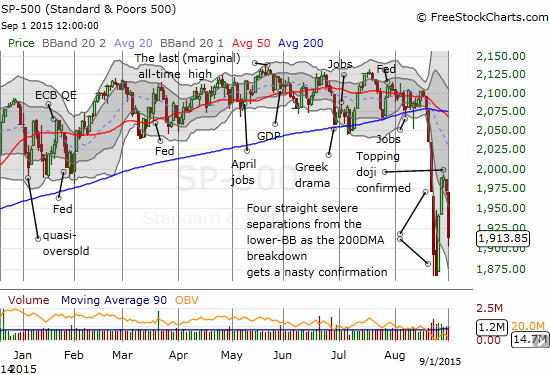
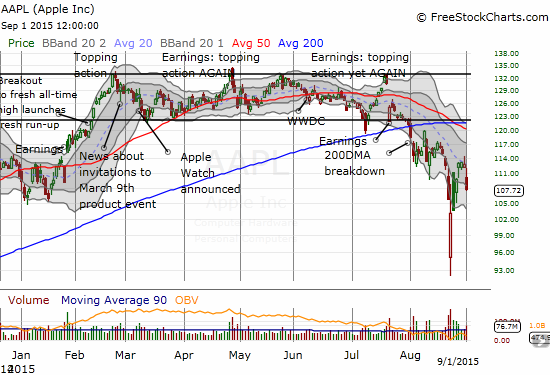
If this news is not bad enough, then note the topping pattern on the S&P 500 which compounds the significant breakdown from the earlier 50DMA pivot and 200DMA support. The “small-body doji” from last Friday represents a stalemate between buyers and sellers. The selling on Monday tip the advantage to sellers. Today’s deep selling on heavy volume confirmed the advantage and signaled a short-term top. The only good news from today is that this level provides a great marker to confirm buying interest on the way back up.
Under these more and more bearish circumstances, maintaining hedges makes a lot of sense for traders like myself who have chosen the aggressive strategy for the oversold period. This was my motivation in loading up on Direxion Daily Russia Bear 3X ETF (RUSS) in anticipation of a significant reversal of the V-bottom on the United States Oil ETF (USO). Russian shares have traded in tight correlation with oil. RUSS has followed a nice uptrend higher along 50DMA support.

With RUSS printing a 21% gain on the day, I did not hesitate to close out the trade even as I suspect it RUSS has at least one more big surge ahead. As a reminder, the hedges serve a purpose: to provide profits to help provide a buffer for lasting through a particularly brutal oversold period.
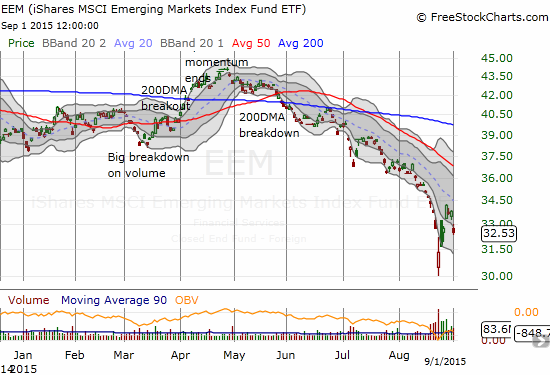
The iShares MSCI Emerging Markets (EEM) dropped 3.9% and printed its own fresh topping pattern. The 20DMA has emerged as stiff downward resistance for EEM. If this happened early in the oversold period, I would have quickly sold my put options (as part of an options strangle I discussed last week). Now, with bearish tidings growing, I am inclined to hold on longer, especially as I am feeling more naked with so few hedges left in the arsenal. If the bearish momentum in the stock market grows, I can see EEM easily plunging to new lows in short order.
I even added to my put options on Caterpillar (CAT) today.
The fresh breakdown in Netflix (NFLX) has added to my sense that the bears will summon enough energy and motivation to drag this oversold period out to extremes. When the sellers are able to start taking out the leaders that helped propped up the market so long, the warning signs flash ever brighter.
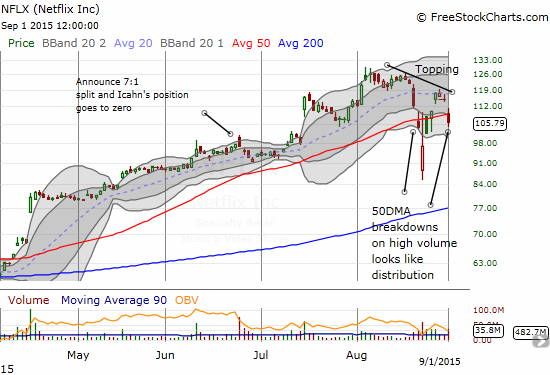
NFLX was presumably hit by news/rumors that Apple (AAPL) will unveil next week a streaming-TV device and service that could rival NFLX’s service. The damage was clear from the open but I took one last swing at one of my favorite trades of the year – hoping the 50DMA would manage to hold as support. With the topping pattern unfolding for NFLX, I have officially removed it from my short list of “aggressive buys.” Only Amazon.com (AMZN) and Google (GOOG) are left. I opened a trade on GOOG call options today as the stock tried to hold support at $600.
Anyway, the AAPL news knocked down NFLX and did not help AAPL one bit. The only reason why AAPL’s gap down is not as bearish as NFLX’s is that NFLX crumbled off 50DMA resistance. AAPL already accomplished this feat a while back after reporting July earnings. Today’s gap down just provided additional confirmation of the unfolding downtrend and re-established the downward trending 20DMA as resistance.
Adding to my sense that speculating in expensive stocks is slowly going out of style is the fresh breakdown in market leader iShares Nasdaq Biotechnology (IBB). Are you seeing the pattern? IBB gapped down and left buyers over the last three days stranded. The downtrending 20DMA is now confirmed as resistance.

Overall, it was another slow trading day as nothing triggered in strict accordance with my T2108 trading rules. I am still on alert for action if (when?) the VIX rechallenges the high on this cycle (or better yet surges past it). With T2108 at just 11%, I am also primed to start buying ProShares Ultra S&P500 (SSO) call options and/or fading ProShares Ultra VIX Short-Term Futures (UVXY) anew (or adding to ProShares Short VIX Short-Term Futures (SVXY)) when moves get so extreme they stretch well below the lower-Bollinger Band.
As this oversold period drags out, I realize that folks new to this may get discouraged. Maybe even panic to the point of losing focus on rules. I realize that some readers were just kids during the dot com crash. Some readers may know about those days but started into the stock market only after the financial crisis receded into the rear view mirror. In other words, you may mainly know the market as a machine that just steadily marches higher. So, for some more perspective on extreme moves, here are two windows onto what the volatility index, the VIX, did during the disruptions of the bursting of the tech bubble and the financial crisis.
Note each stock market sell-off has a slightly different signature. During the dot-com crash, the VIX never soared like it is doing now. It could not even break 34. The intense focus of sellers on tech stocks was part of the reason for this relatively mild behavior in the VIX. The S&P 500 was not impacted nearly as severely as the NASDAQ. In fact, T2108 NEVER dropped into oversold territory this entire time. After a 3-day oversold period in October, 1999 it took another TWO years for T2108 to go oversold again!
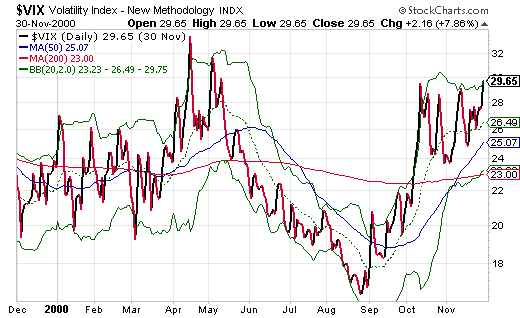
Source: StockCharts.com
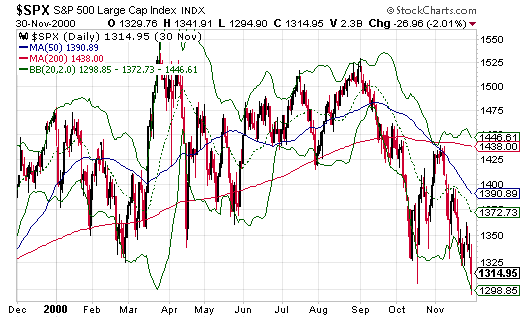
Source: StockCharts.com
The behavior of the VIX was even MORE intriguing during the financial crisis. The VIX marched steadily higher for a month before taking a brief break. After the next run-up failed to make a new high, the VIX steadily marched downward. For the first three months, it churned widely until the S&P 500 finally made its historic low in early March. The relief resumed from there. T2108 experienced multiple oversold periods in the last four months of 2008, some interrupted by just a day. The next year only had ONE T2108 oversold period and that 15-day gut-wrencher covered the historic March, 2009 lows. Imagine sticking with the rules during THAT period, eh? (I had not yet formalized the rules at that point unfortunately).
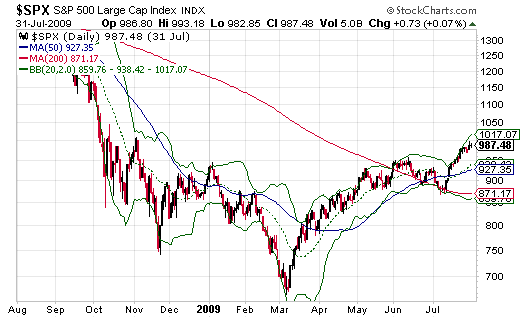
Source: StockCharts.com
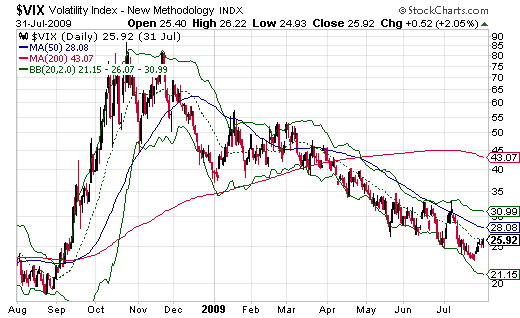
Source: StockCharts.com
Daily T2108 vs the S&P 500
")
Black line: T2108 (measured on the right); Green line: S&P 500 (for comparative purposes)
Red line: T2108 Overbought (70%); Blue line: T2108 Oversold (20%)
Weekly T2108

*All charts created using freestockcharts.com unless otherwise stated
The charts above are the my LATEST updates independent of the date of this given T2108 post. For my latest T2108 post click here.
Related links:
The T2108 Resource Page
Expanded daily chart of T2108 versus the S&P 500
Expanded weekly chart of T2108
Be careful out there!
Full disclosure: long SVXY shares, long SSO shares and call options, long NFLX call options, short USO call spread, short USO put options, long calls and puts on EEM, long put options on CAT, long put spread on AAPL