
Introduction
The percentage of stocks trading above important moving averages provides good information on the breadth of the stock market. I use the percentage of stocks trading above their respective 40-day moving averages (DMAs) because the historical data are readily available for analysis. I call this indicator “AT40” as a shorthand for “above the 40DMA” to clearly differentiate it from AT200 which is shorthand for “above the 200DMA.” (In TC2000 by Worden, these indicators are called T2108 and T2107, respectively). In this post, I provide my latest update on AT40 data with an emphasis on oversold (AT40 below 20%) and overbought (AT40 above 70%) trading conditions.
Market breadth provides hints about the sustainability of a market rally or sell-off. A stock market rally tends to lift all boats, but over time this rising tide wanes. Money is not infinite, so in the short-term buyers will exhaust themselves at some point. Fewer and fewer stocks attract new money until, eventually, the remaining buyers are not purchasing enough stocks to keep pushing the major indices higher, particularly the S&P 500 (SPY). This slowing momentum shows up as AT40 making little progress even if the S&P 500 continues higher. I label the most distinct changes in momentum between AT40 and the S&P 500 as “bearish divergences.” Tops can also happen when buyers exhaust themselves in one sharp and abrupt push higher which I call a “climactic top”.
On the downside, sellers push more and more stocks below their 40DMAs. At some point, sellers exhaust themselves after satisfying their desire to reduce risks and the remaining holders think stocks are priced below their true values. This slowing downside momentum shows up in AT40 making little progress to the downside even as the indices continue downward. Sometimes the bottom comes in a sudden rush of buying.
Overbought and Oversold Trading Conditions
I adopted conventions to define the AT40 thresholds for overbought as 70% and for oversold as 20%. Because these periods must end, they present unique short-term trading opportunities. There are two important questions for trading these extremes: 1) how long will the extreme last, and 2) how will the S&P 500 perform during the extreme trading conditions. The performance question has two sub-components: total performance and greatest extreme of performance whether drawdown or maximum gain.
In this post, I answer the duration and the total performance questions. All data run from September 17, 1986 to January 11, 2019. The first oversold period in this period started on October 15, 1987 (in the middle of the crash of 1987). The first overbought period started on November 5, 1986. Perhaps ominously, the stock market experienced SIX overbought periods lasting a total of 78 trading days ahead of the crash of 1987.
Based on medians and means, extremes typically last short periods. The charts below show the number of trading days on the y-axis and the percentage threshold of AT40 on the x-axis. Each chart zooms in on the range of thresholds of most interest because durations increase rapidly beyond 50% and distort the visual.
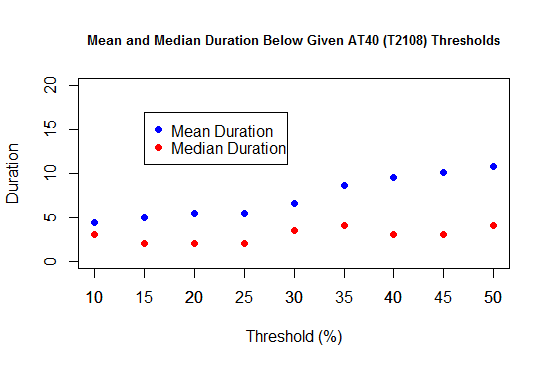
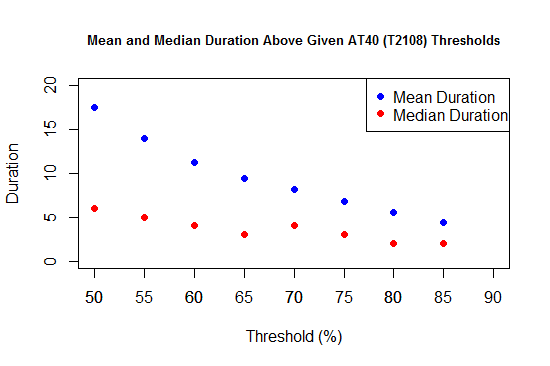
Both charts indicate that the stock market typically spends very little time beyond the AT40 extremes whether oversold (below 20%) or overbought (above 70%). Short-term traders and long-term investors should buy oversold conditions. Short-term traders should prepare to sell/short during overbought conditions and long-term investors should generally avoid buying during overbought periods. Each rule includes important caveats to accommodate the potential for extended periods of extreme trading conditions. I discuss these on my resource page. For example, during oversold periods, the most attractive buys occur during a sharp rise in the volatility index, the VIX. Conservative traders/investors might wait to buy until after the oversold period ends. During overbought periods, the most attractive shorts may occur after the overbought period ends or when the S&P 500 (SPY) experiences a definitive rejection at important resistance levels or a sharp rise higher and then a rush back downward.
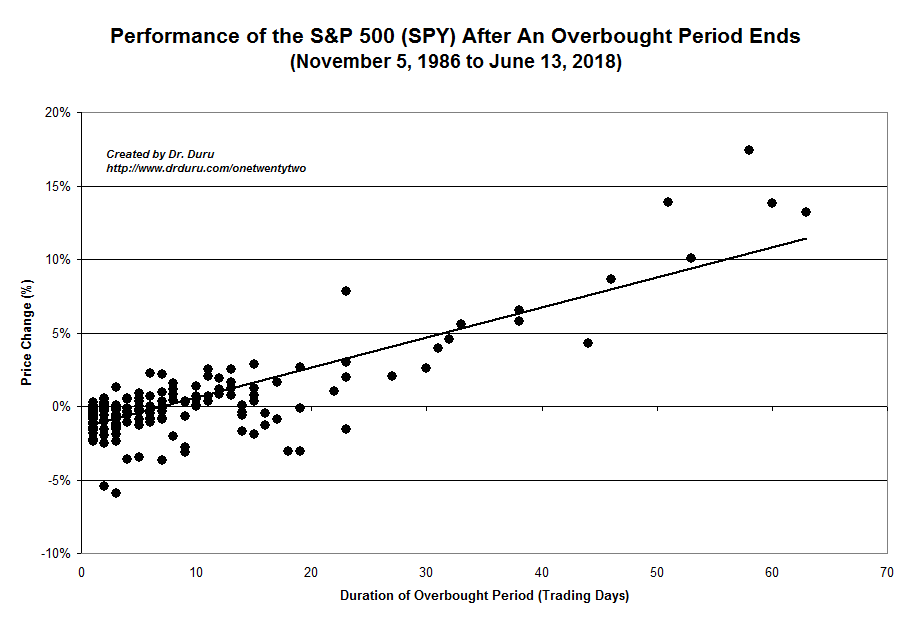
These rules and caveats are important because, as the charts below show, the longer the stock market spends in oversold conditions, the worse the S&P 500 tends to perform. Similarly, the longer the stock market stays overbought, the better the S&P 500 tends to perform. Simple trendlines represent these relationships. The y-axis is the percentage change in the price of the S&P 500 measured from the close of the first day of the AT40 period to the close on the first day AT40 closes outside the period.
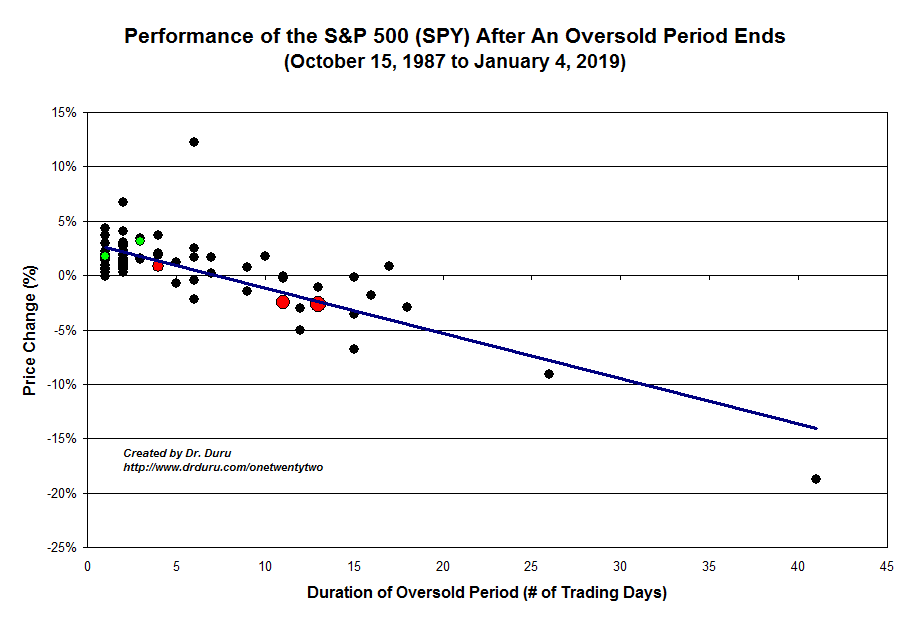
The red dots in the oversold chart indicate the most recent oversold periods. Going from left to right, they represent the oversold period from October 10 to 15, 2018 and the historic oversold periods from October 17 to 31, 2018 and December 14, 2018 to January 3, 2019. The green dots represent the two oversold periods from February, 2018. The trend lines provide a way of projecting in very approximate terms what to expect from the S&P 500 based on the duration of an oversold or overbought period.
Above the 40 Relationships
In prior posts, I have used charts that included projections from a machine learning model. I am in the middle of revising those models. Until I finish the remodeling, I will refer to the above charts and this post for describing the dynamics of a given oversold or overbought period. The most important highlights for now are: 1) the oversold (inverse) relationship between duration and S&P 500 performance is relatively well-behaved, and 2) for overbought periods, the S&P 500 performance becomes strongly biased to the upside after 23 trading days.
Above the 40 – Current Conditions (January 30, 2019)
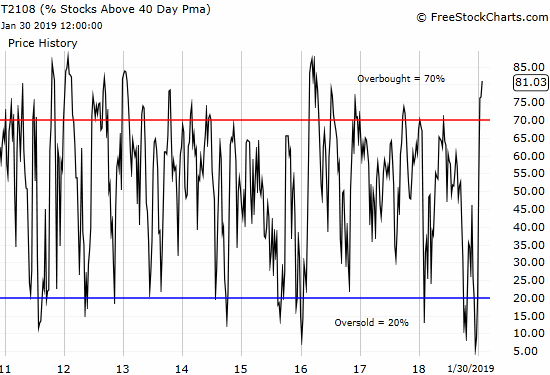
The stock market is currently overbought with AT40 closing at a startling 81.0%.
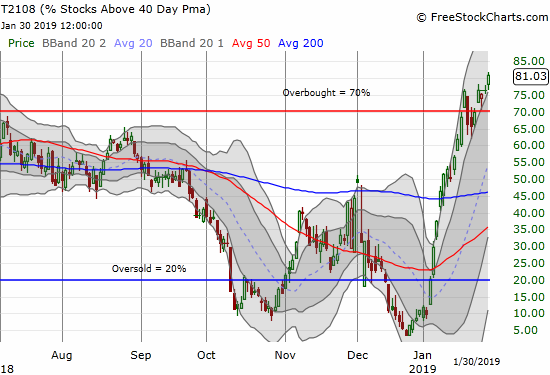
AT40 was last this high on April 27, 2016.
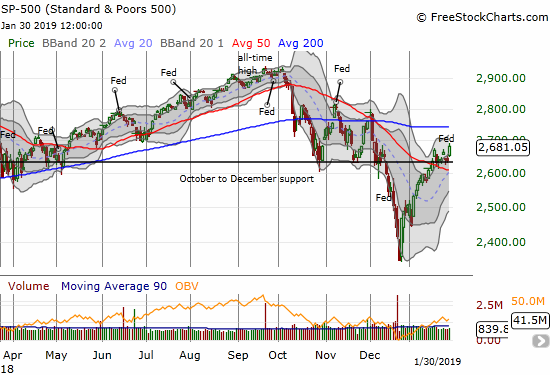
The S&P 500 (SPY) experienced two small setbacks after that overbought period ended on its way to a massive post-election rally. That episode was a reminder of how bullish overbought conditions can be for buying dips, especially following two historic oversold periods. This period not quite similar because this stock market’s overbought period is not happening at or around all-time highs. Moreover, the S&P 500 remains below the critical resistance level of its 200DMA.
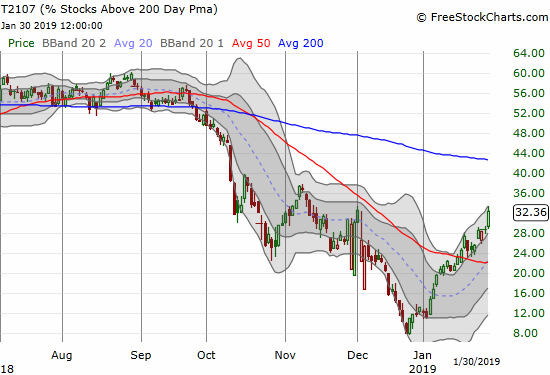
On the positive side, AT200 is only at 32.4%. AT200 just recovered its losses from the December meltdown and needs to get to 46% to erase its losses from the October breakdown.
Be careful out there!
Full disclosure: long UVXY call options
This is a great post – as someone who likes to look at breadth and uses the T2108 as part one piece of data, this gave me lots to think about. I like add a look at the ratio between the number of stocks up 25% in a quarter and stocks down 25% in the quarter. This gives me the longer-term bias of the market. With that, and the T2108 I get a good longer term and shorter term view to help me with my momentum trades.
Hi Jeremy – sorry for the VERY belated response! Thanks for reading. You should also try looking at T2107 for a gauge of the longer-term market bias.