
AT40 = 6.5% of stocks are trading above their respective 40-day moving averages (DMAs) (oversold day #8)
AT200 = 11.0% of stocks are trading above their respective 200DMAs
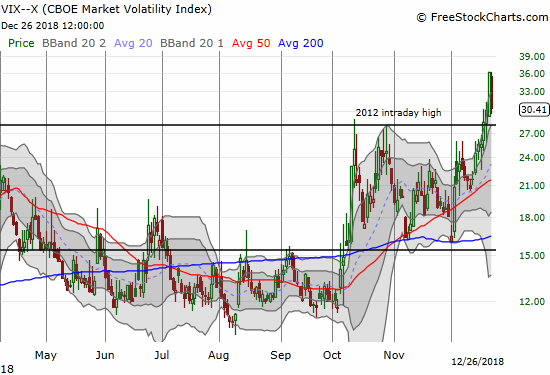
VIX = 30.4 (down 15.7%)
Short-term Trading Call: bullish
Commentary
Pick your favorite catalyst or explanation. I am sure there is good news (or the absence of bad news) out there to serve as a fortuitous launchpad to explain today’s tremendous day-after-Christmas rally. For example, there is President Trump’s Christmas Day reassurance that U.S. companies are a great buy:
“I have great confidence in our companies. We have companies, the greatest in the world, and they’re doing really well. They have record kinds of numbers. So I think it’s a tremendous opportunity to buy.”
Reuters, December 25, 2018
Whatever the reason, the rally seemed to validate my conclusion that it would not take much to spark a sharp rally. I was specifically talking about government action, so I am leaning towards Trump’s proclamation as helping to grease the buying triggers (I somehow missed that news until Wednesday morning). However, the rally was not a straight shot. The stock market first gapped higher, sellers stepped in as has been their habit, and after grinding lower for almost 90 minutes, the buyers took over control for the rest of the day. The Post-Trump Reversal received a major and resounding reprieve. Individual stocks and whole indices recorded eye-popping gains.
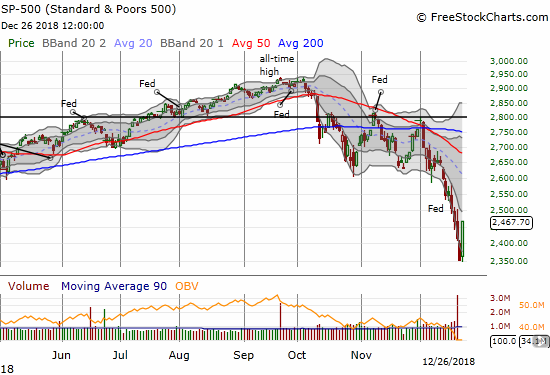
The S&P 500 (SPY) gained a whopping 5.0%. It was a vertical move reminiscent of the wild one-day stock market comebacks during the 2008-2009 financial crisis. Suddenly, the S&P 500 December performance to-date is “only” down 10.6% and year-to-date the index is down 7.7%. Just three more trading days to get back to even for 2018 (2673.21 currently happens to neatly coincide with the rapidly declining 50DMA).
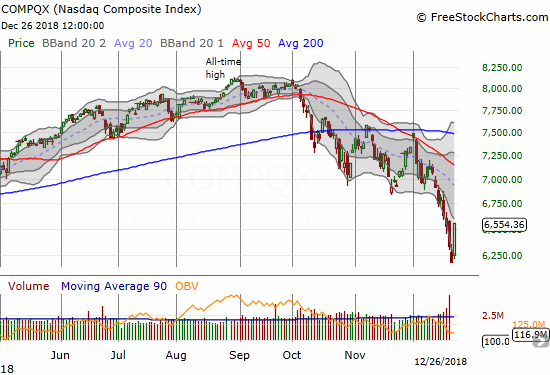
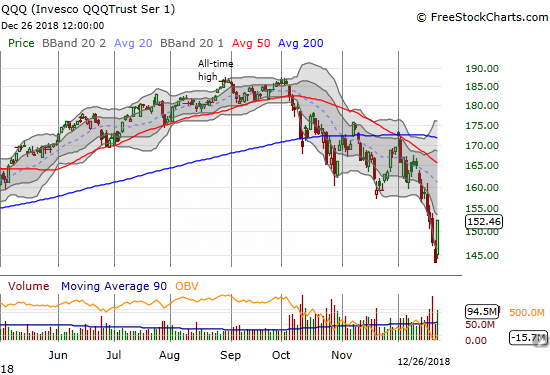
The NASDAQ and the Invesco QQQ Trust (QQQ) jumped to 5.8% and 6.2% gains. Again, this kind of trading action is straight out of the financial crisis playbook.
The volatility index, the VIX lost 15.7% as fear cooled off enough to let the market soar.
Even with all these dramatic moves, AT40 (T2108), the percentage of stocks trading above their respective 40-day moving averages (DMAs), only moved from a rock-bottom 3.6% to 6.5%. The technical damage to the market runs deep indeed. AT200 (T2107), the percentage of stocks trading above their respective 200DMAs, managed to push into double digits. AT200 moved from 8.0% to 11.0%. The S&P 500 is now down 5.1% since closing in oversold territory on December 14th.
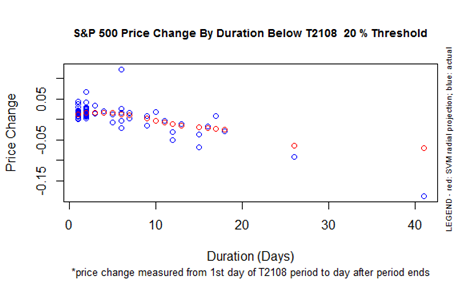
Per the chart below, if the oversold period ended today after its 7th day, the performance of the S&P 500 would be at the lower extremes of historical performance shown by the blue circles. There are three separate paths from here for ending the oversold period according to the projections shown by the red bubbles: 1) a rally in the next three trading days or so to get the S&P 500 close to a flat performance for the oversold period, 2) a lot of churn for as many as 10 more trading days where the downtrending 40DMAs fall low enough for a small rally to push stocks quickly over resistance, or 3) a very extended and historic oversold period that stretches beyond 17 total trading days. The first case sets up the market for a big January fade as the market’s remaining sellers seize the opportunity of higher prices. The second case keeps the market guessing and in suspense until the December jobs numbers are released and perhaps until companies begin releasing early earnings surprises. The third case is a bear market extreme that would be consistent with all the extremes of this month.
I started the morning poised to act. With the market gapping up, I automatically assumed a rally day had finally arrived to take the market out of its historic oversold depths. I mainly focused on making bullish moves. I doubled down on my put options on ProShares Ultra VIX Short-Term Futures (UVXY) which I closed at a profit at the end of the day. I flipped a call option in Nvidia (NVDA). I took profits on my latest round of call options in Splunk (SPLK). I sold the long side of a calendar call spread on AMZN that salvaged a good chunk of the position (if I had waited for AMZN to go from a 7% to a 9% gain, I would have closed out at even but who knew?!?). For good measure, I added puts on Netflix (NFLX) as a new hedge.
I did not make moves on the prime targets I discussed in the last Above the 40. I simply missed Okta (OKTA) and did not want to chase a stock up 11% on the day. I will buy its next dip. Cracker Barrel Old Country Store (CBRL) bounced off 200DMA support with a 1.2% gain. I decided to stay patient and wait for follow-through buying.
My most surprising moves were for longer-term positions (meaning I hope I can hold onto them for at least a year or two, a grade or two below retirement positions). I decided that if I was not going to buy shares in some known consumer names like Apple (AAPL) at this point of market panic, I might never buy them. I was of course pleasantly surprised to see most of these positions deeply profitable by the close. However, I am FAR from comfortable with these buys for all the reasons I discussed in previous posts, especially the last Above the 40.
CHART REVIEWS
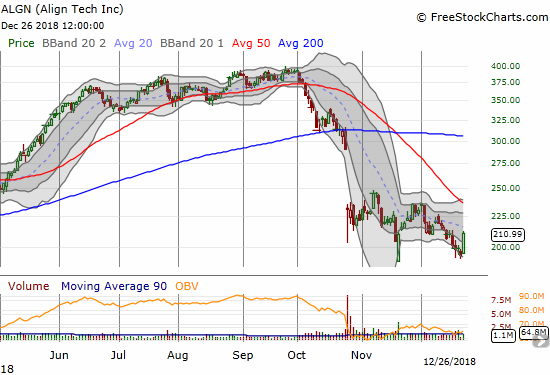
Align Tech (ALGN)
I am still not at the point of buying interest in ALGN. I just like to watch for signs of life in former high-flyers as potential clues on the market’s risk attitudes. ALGN is definitely still a damaged stock. Incredibly, the stock lost 50% in less than three months.
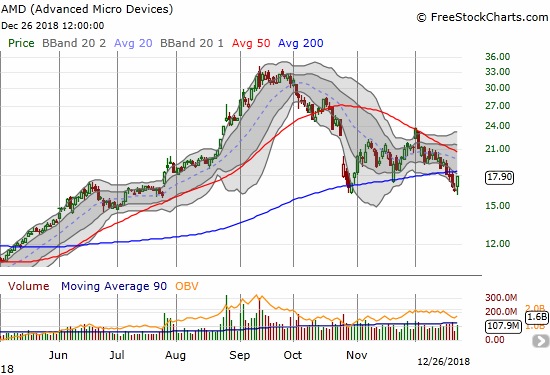
Advanced Micro Devices (AMD)
I am trading AMD again. I took profits on puts last Friday. I thought AMD would drop a LOT lower in the middle of a market sell-off this severe. So that hedge did not work out as well as I wanted. I think AMD is in the middle of a major topping pattern. I am only interested in fading its rallies rather than buying its dips. I expect the rapidly declining resistance from the 50DMA to hold firm, even as AMD held October support. AMD’s one-day pop almost challenged 200DMA resistance.
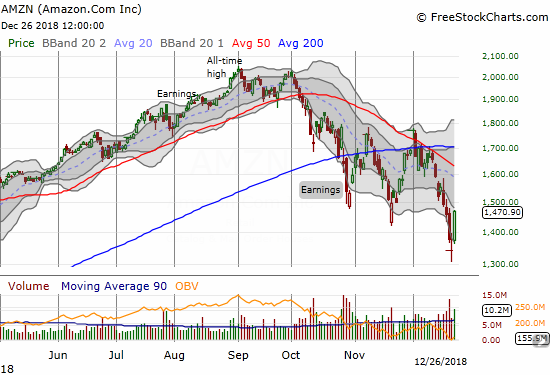
Amazon.com (AMZN)
The big percentage one-day moves in AMZN barely make sense. Only big money players can move such a large stock so far. AMZN rallied 9.5% but still only reversed two days of losses. The gap up and follow-through buying left behind a morning star bottoming pattern that plants AMZN solidly on my buy list for bullish trading periods.
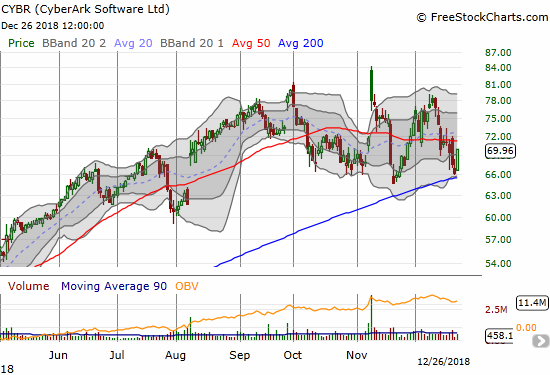
CyberArk Software (CYBR)
I want to use the Post-Trump Reversal to buy back into cybersecurity plays. CYBR is at the top of the list given its impressive resilience in this period. The stock bounced off 200DMA support and left CYBR as one of the very rare stocks which have yet to even trade below its 200DMA during the sell-offs of the last 2 1/2 months.
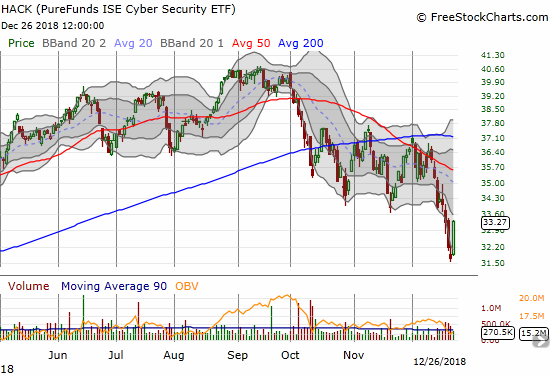
ETFMG Prime Cyber Security ETF (HACK)
HACK has not been as fortunate as CYBR, but it is still better off than the general market on a relative basis. HACK closed nearly flat for the year on Monday. So today’s rally represents almost all of HACK’s year-to-date gains. I am waiting to buy HACK until after I establish a position in CYBR. In a worsening sell-off, I will start accumulating HACK around $30 and below while holding CYBR.
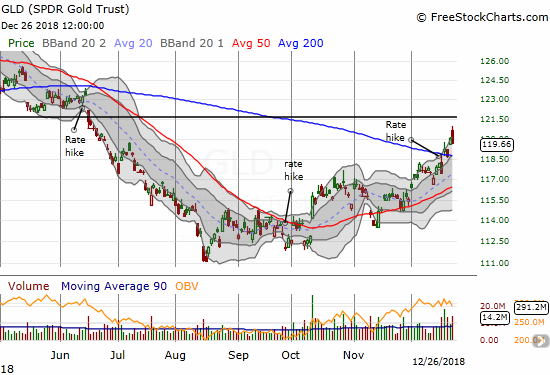
SPDR Gold Trust (GLD)
I sold my GLD call options as the underlying confirmed its 200DMA breakout on Monday. Normally, I would have held on for a presumed extended rally. However, since I associate GLD’s current move with a market panic, I want to take profits at opportune times like this one. I will go back in buying call options on a retest of 200DMA support or even 50DMA support. I am of course still holding tight to my core GLD shares.
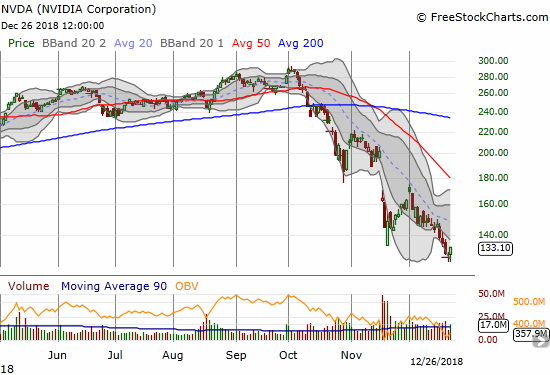
Nvidia (NVDA)
NVDA is a VERY broken stock. Its 4.7% gain on the day barely shows up as a blip on the below 7-month chart. I was fortunate to successfully flip a call option, but NVDA is not yet a good play for an extended swing trade.
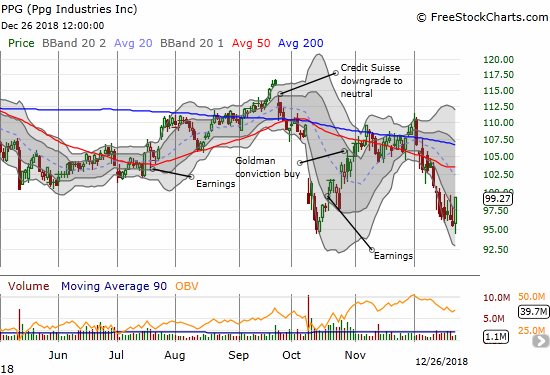
PPG Industries (PPG)
I keep checking in on PPG given its early October post-earnings collapse was an early warning signal for worries over economic growth and inflation. The stock soon recovered and stayed firm in November as if the bull market were still intact. The December sell-off slowed down as PPG approached the post-earnings low. PPG is too tricky to play for the short-term. The stock needs to clear $100 or $101 to confirm this bottom, and those price levels are too close to overhead resistance from the declining 50DMA.
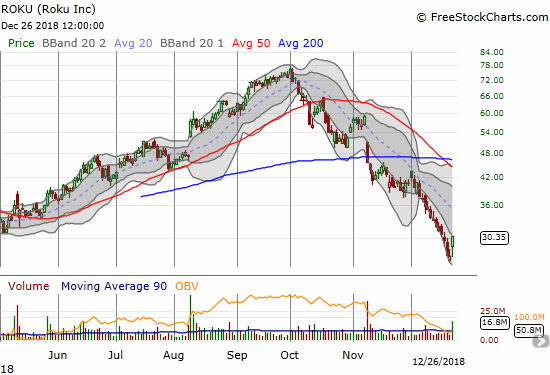
ROKU (Roku)
ROKU received a major boost from Needham as its top pick for 2019. Yet in true bear market style, sellers stepped right into the gap and completely faded the stock. Somehow, buyers returned with enough force to deliver a whopping 11.7% gain. If ROKU can break free of its lower Bollinger Band channel, it could finally mount a serious challenge of overhead resistance.
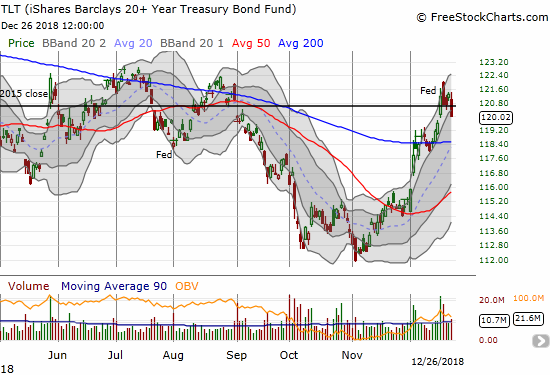
iShares 20+ Year Treasury Bond ETF (TLT)
I bought TLT puts as a fade of post-Fed fear. I did not have much of a thesis except to be contrary at a key point of resistance for TLT. Today’s drop to $120 was sufficient for me to take good profits on the position. I decided not to wait for a test of 200DMA support. I think TLT will drop a lot further in an extended market rally as yields are too low in the context of a belief in a strong economy.
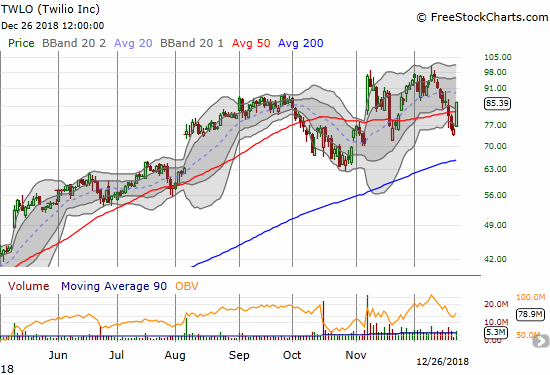
Twilio (TWLO)
With all the technical damage happening in the stock market, TWLO’s ability to stay far above its 200DMA support is almost as astounding as the wild gyrations of the Post-Trump Reversal. TWLO is firmly on my buy list for trades. The last one was a calendar call spread with the short side expiring last Friday. I am now back to even and expecting TWLO to end the week having touched or crossed $90 at some point (yes, a tight window!).
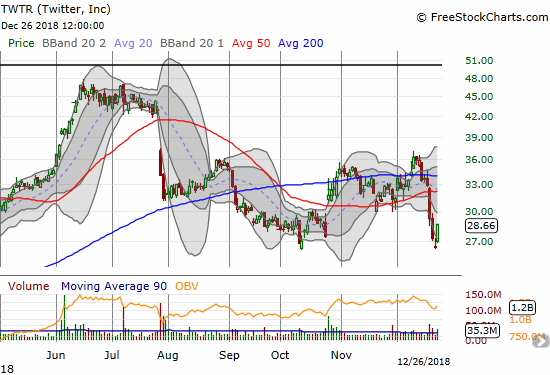
Twitter (TWTR)
TWTR is another stock which managed to hold October (or recent) lows in the December sell-off. I think TWTR demonstrates its value as a public forum over and over with the Treasury’s announcement of a “Plunge Protection Team” being yet one more example. I already own shares, and I am thinking of buying calls to play a bounce back to resistance.
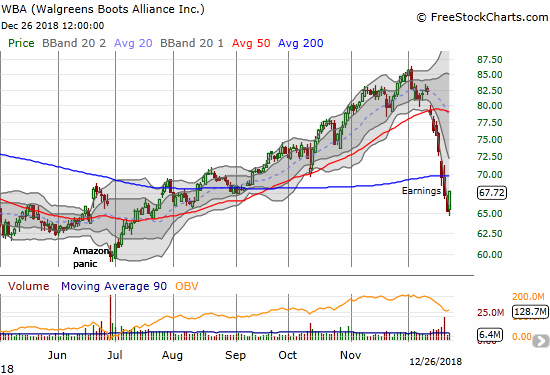
Walgreens Boots Alliance (WBA)
WBA did not tumble off its recent highs based on my bearish thesis, but I will take it. I decided to take profits at the open after realizing it made little sense to hold on so deep in oversold territory. I will look to start accumulating a fresh short position starting at the 200DMA.
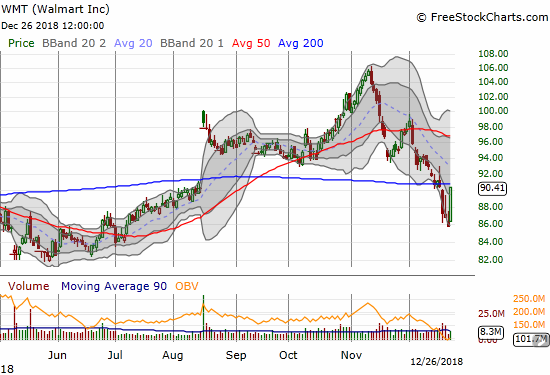
Walmart (WMT)
WMT’s 5.4% pop brought the stock right back to the 200DMA. The 200DMA breakdown makes the October run-up and November peak look like a climactic top. Still, I am holding calls in the expectation that WMT can make another run at 50DMA resistance.
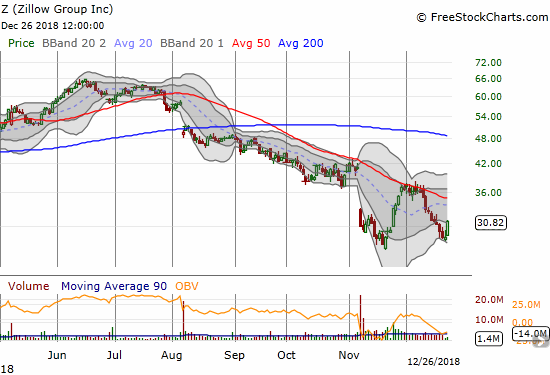
Zillow Group (Z)
Zillow Group held onto its November low as support with today’s 8.8% rally. I used this sell-off to start scaling into the stock. As a reminder, insiders bought a massive amount of stock in November. The news pushed the stock as far as 50DMA resistance. The market-wide sell-off helped people forget about the floor that insiders may have placed in the stock. These are the kinds of opportunities I prefer in a bear market.
— – —
FOLLOW Dr. Duru’s commentary on financial markets via email, StockTwits, Twitter, and even Instagram!
“Above the 40” uses the percentage of stocks trading above their respective 40-day moving averages (DMAs) to assess the technical health of the stock market and to identify extremes in market sentiment that are likely to reverse. Abbreviated as AT40, Above the 40 is an alternative label for “T2108” which was created by Worden. Learn more about T2108 on my T2108 Resource Page. AT200, or T2107, measures the percentage of stocks trading above their respective 200DMAs.
Active AT40 (T2108) periods: Day #8 under 20% (8th oversold day), Day #13 under 30%, Day #15 under 40%, Day #65 under 50%, Day #81 under 60%, Day #136 under 70% {corrected 1/6/19}
Daily AT40 (T2108)
")
Black line: AT40 (T2108) (% measured on the right)
Red line: Overbought threshold (70%); Blue line: Oversold threshold (20%)
Weekly AT40 (T2108)

*All charts created using freestockcharts.com unless otherwise stated
The T2108 charts above are my LATEST updates independent of the date of this given AT40 post. For my latest AT40 post click here.
Related links:
The AT40 (T2108) Resource Page
You can follow real-time T2108 commentary on twitter using the #T2108 or #AT40 hashtags. T2108-related trades and other trades are occasionally posted on twitter using the #120trade hashtag.
Be careful out there!
Full disclosure: long SSO, long CAT calendar put spread, long QQQ puts; long AAPL calls, calendar call spread, and shares; long AMZN put spread and calendar call spread, long GLD, long ROKU shares and puts, long TWLO calls, long TWTR, long WMT calls
*Charting notes: FreeStockCharts.com stock prices are not adjusted for dividends. TradingView.com charts for currencies use Tokyo time as the start of the forex trading day. FreeStockCharts.com currency charts are based on Eastern U.S. time to define the trading day.