
In recent weeks, the trade in the stocks of home builders provided timely reminders in the limited meaning in price action. The market periodically makes key “mistakes” that provide buying (or selling) opportunities.
A Fresh Turning Point
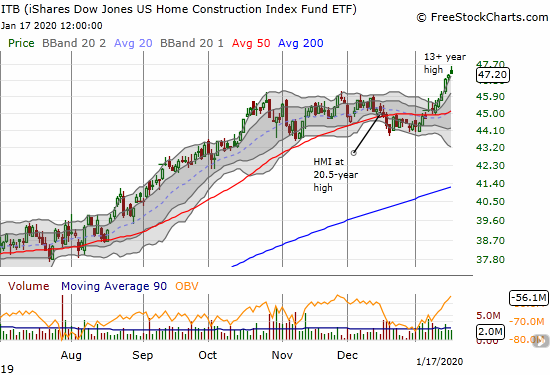
At the end of December, I described a “precarious divergence” between the stocks of home builders and the S&P 500 (SPY). My prime source of concern came from the mild selling in the stocks of home builders in the wake of a 20 1/2 year high in the Housing Market Index (HMI) while the S&P 500 (SPY) maintained a persistent rally. Individual stocks were rolling over in bearish patterns and provided confirming evidence of a topping in the iShares Dow Jones US Home Construction Index Fund ETF (ITB). Given the current cycle is the seasonally strong period for home builders, I remain predisposed to look for buying opportunities. I interpreted the strong price action in mortgage and market servicers as potentially positive signs. I took profits on my ITB call spread as a precaution while I also accumulated call options on KB Home (KBH). So I did not turn bearish on home builders, but I was also not as aggressive as I prefer during this period. I took profits on the KBH call options ahead of the company’s earnings report.
ITB turned the corner on January 8th with both KBH running up into its earnings report as well as a mildly positive response to the earnings of Lennar (LEN). On that day, ITB managed to gap over its 50-day moving average (DMA). ITB has logged just one negative day since. With a 13+ year high, ITB finally cleared the climactic top from January, 2018; ITB churned below that price level from October to December.
Accelerating Housing Starts
Perhaps the lagged animal spirits in the housing sector “sensed” the coming bullish report on housing starts. On Friday, January 17th, we learned that all of the sudden, builders collectively accelerated their start activity. This surge confirmed both the soaring HMI from December as well as the reported eagerness of builders to create supply at the lower price points. Starts for single family homes jumped 11.2% from November and a whopping 29.6% year-over-year.
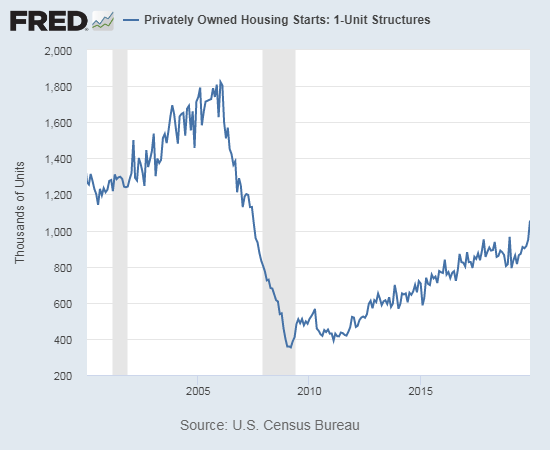
Source: US. Bureau of the Census, Privately Owned Housing Starts: 1-Unit Structures [HOUST1F], retrieved from FRED, Federal Reserve Bank of St. Louis, January 18, 2020.
The next question of course is whether buyers step up to absorb the coming inventory. As usual, I will be reviewing the earnings reports of builders for clues and signs. To date, home builders consistently report strong market demand dynamics at the lower price points.
In the meantime, several stock charts in particular caught my eye last week. Each one represents its own unique buying opportunity. I describe a sample of the charts below.
Toll Brothers (TOL)
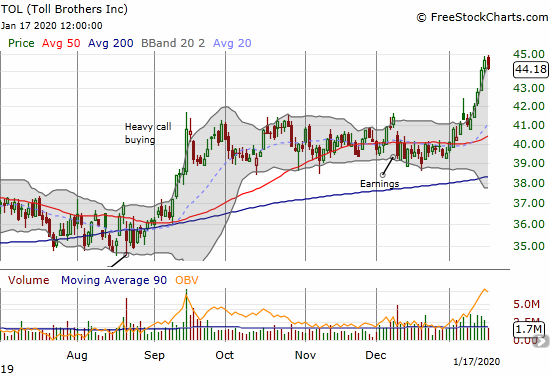
Toll Brothers (TOL) was stuck in a 4-month trading range until the stock broke out in sympathy with Lennar earnings. While sellers faded the gap up and pressured the stock over the next two days, buyers returned with enough force to send TOL to a 21-month high last week. I am especially impressed with this move because TOL is not focused on the affordable price points (at least not affordable to the average buyer). Toll Brothers does not report earnings until February 25th; the stock is a buy on the dips going into that report.
Meritage Homes (MTH)
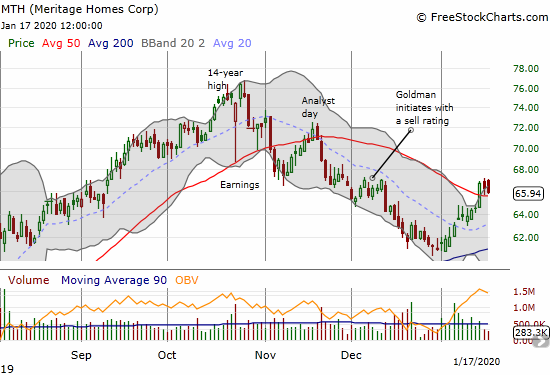
I have focused on Meritage Homes (MTH) as a particular source of concern given the extended selling in the stock and the poor reactions to earnings and an analyst day. Technicals took over as the stock managed to survive a near test with support at its 200DMA. Last week, MTH broke out above its 50DMA. Meritage reports earnings on January 29th. Given the upside potential of a sudden change in sentiment, I like buying call options ahead of that earnings report IF MTH is still above its 50DMA at that time. In the meantime, I am looking to buy MTH on a confirmation of the 50DMA breakout (meaning a second higher close).
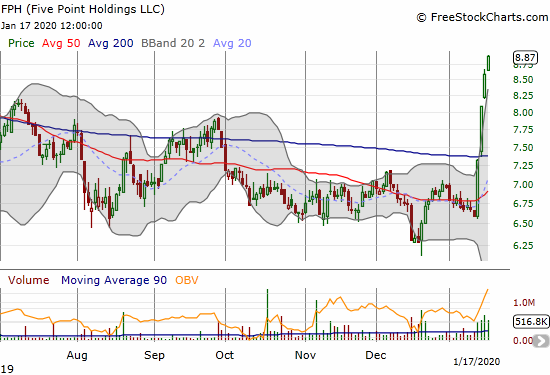
Five Point Holdings (FPH)
I have long wondered about the severe under-performance of Five Point Holdings (FPH). Assuming a gross mis-pricing, I accumulated stock through the entire 2 1/2 year duration of the stock’s existence. Animal spirits raged like a wildfire last week as FPH suddenly jumped 34.6% in the wake of announcing the long anticipated sale of homesites in a master-planned community in Valencia, CA. The close of 711 homesites is the first of a total 21,000 homesite plan. I am looking for this transaction and the corresponding market response to represent a final turning point for Five Point Holdings. FPH should next report earnings in February.
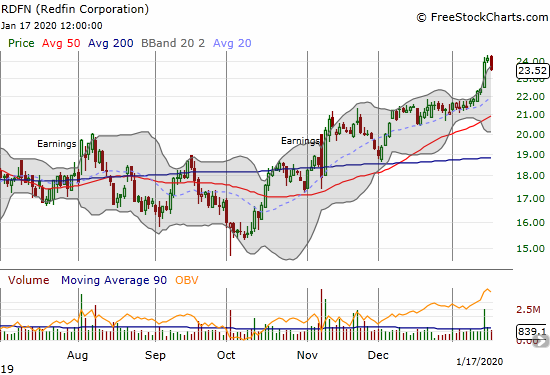
Redfin (RDFN)
Speaking of turning corners, Redfin (RDFN), a housing services company, may have done just that with a breakout last week above the last peak set in April, 2019. While sellers took the stock down 2.9% on Friday, I see the price action as supportive of the follow-through from November earnings and the subsequent uptrend. RDFN looks like a buy on the dips. Note I am no longer using RDFN as part of a pairs trade going long against a short on Zillow Group (Z) (ZG). BOTH Redfin and Zillow are experiencing positive rebounds.
Source for charts: FreeStockCharts
Be careful out there!
Full disclosure: ITB call spread, long FPH