

Stock Market Commentary
At the end of September, I asked skeptically whether an oversold bounce could prevent an October swoon. As I suspected at the time, the answer turned out to be no. The market-moving headlines for October have included weighty, tragic, and alarming news making for a demotivating trading environment. An oversold bounce earlier in the month that attempted to ignore the worst of the headlines fizzled and faded. The resulting stock market is ugly and breaking down, but it is now oversold. Traders once again face the challenge of muting emotions and following the technicals of extremes in market breadth even when everything else insists on fear, foreboding, and frustration. That sliver of hope from extreme market breadth is the best traders can hope for here.
The Stock Market Indices
The S&P 500 (SPY) started the week putting a hopeful spin on the trading action. I held my SPY call options a day too long. Sellers took over the last three days of the week and plunged the index to a near 5-month low. Earlier in October, the S&P 500 barely avoided reversing all its gains from the summer of loving stocks. I strongly suspect the index will not be so lucky this time around. The S&P 500’s 1.5% drawdown for the month is short of the 3.2% average maximum drawdown for October and the 2.1% median. Note how the 50-day moving average (DMA) (the red line) held as overhead resistance.
")
Like the S&P 500, the NASDAQ (COMPQ) failed at 50DMA resistance. The tech-laden index ended the week below its pre Jackson Hole high and looks ready for an overdue test of support at the bear market line. Given the stock market is oversold, I fully expect the trading bots to buy at the bear market line. I have no guesses as to whether those bots remain interested enough to sustain an oversold bounce.
")
The iShares Russell 2000 ETF (IWM) seemingly accelerated to the downside. The ETF of small caps confirmed a breakdown below its pre-pandemic high. This line held as support in March and again in May. Now, IWM is at risk of testing the lows from last year. Still, I jumped into speculative call options as a play for an oversold bounce back to downtrending 20DMA resistance (the dotted line).
")
The Short-Term Trading Call While Ugly and Breaking Down
- AT50 (MMFI) = 19.3% of stocks are trading above their respective 50-day moving averages (first day oversold period)
- AT200 (MMTH) = 27.9% of stocks are trading above their respective 200-day moving averages
- Short-term Trading Call: bullish
AT50 (MMFI), the percentage of stocks trading above their respective 50DMAs, started the week with a 2-day surge to as high as 37%. A warning sign flashed in the form of a subsequent fade to a close of 32.8% in parallel with IWM fading back to its 20DMA resistance. Sellers have yet to relent since then. I rushed into shorts and put options during this time that mostly proved profitable. Those positions ran counter to my intent to prepare for a return to oversold conditions. Yet, their success spoke volumes about a stock market breaking down. The longer-term health of market breadth fell into deeper trouble as AT200, the percentage of stocks trading above their respective 200DMAs, plunged to a 52-week low.
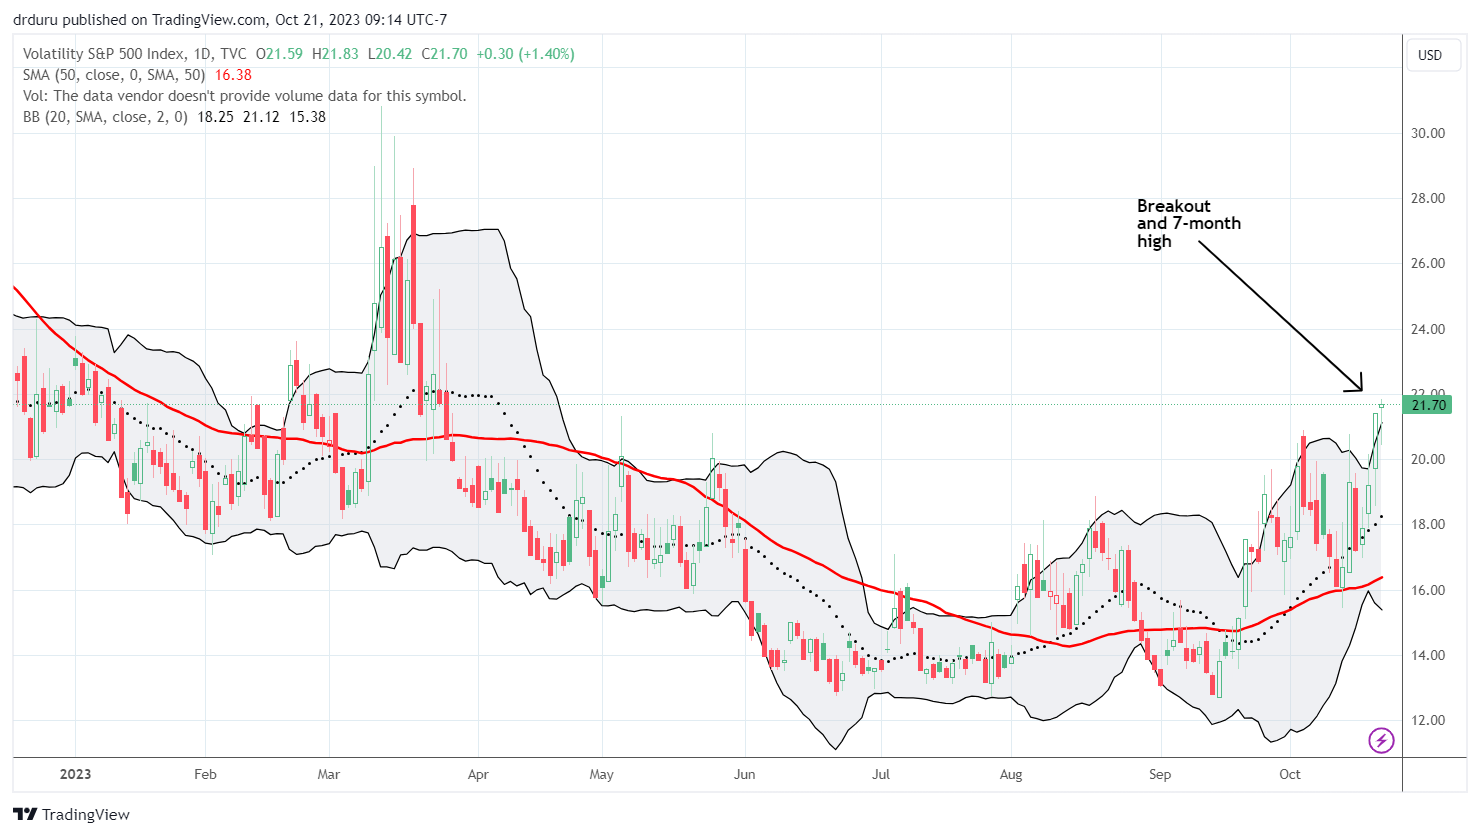
The volatility index (VIX) jumped back into the picture with a breakout to a fresh 7-month high. The stretch above the upper-Bollinger Band (BB) is the exact kind of extreme I want to see during an oversold period. Accordingly, I upgraded my short-term trading call to bullish from cautiously bullish. This positioning aligns with the AT50 trading rules. I also accumulated put options on the iPath Series B S&P 500 VIX Short-Term Futures ETN (VXX).
While market conditions are ugly and breaking down, it is hard to see the path to upside. Yet, I do not need to fully understand or predict the how or the why. I only need to stick with the rules based on the historical tendencies of the ways in which selling exhausts itself at extremes and paves the way for the next buying cycle. Having said that, I am still sitting on the edge of my seat ahead of seeing how the S&P 500 and the NASDAQ perform at the next lines of support!
Tesla, Inc (TSLA) is breaking down after doing its best to hold a pivot around the 50DMA since September. A 9.3% post-earnings loss followed by a 3.7% drop pushed TSLA below its August low. This move definitively brought TSLA’s 2023 breakout to an end. This breakdown is a general warning on the sentiment toward speculation.
")
If the stars somehow magically align, I still hope to buy a Lucid Air when I grow up. However, will Lucid Group, Inc (LCID) still be around when I grow up? A while back, I bought a small number of shares in LCID as a “boom or bust” speculative play. With the stock breaking down and trending down most of this year to an all-time low, the scales look tipped toward bust. Lucid’s production numbers remain tepid, and the company looks nothing like the “Tesla killer” I thought it would become by now. The last burst of (false) optimism came in February with rumors of a potential buyout.
")
NVIDIA Corporation (NVDA) has been one of the big cap tech stocks helping to hold up the S&P 500 and the NASDAQ. Last week’s selling even brought mighty NVDA close to the edge of breaking down. Slowly but surely, NVDA has created the dreaded head and shoulders top. A close below the neck will confirm the top. While this pattern looks ominous, I also acknowledge that the pattern’s rarity makes it difficult to trade. In fact, I have a nagging suspicion that there are traders (and bots) that specialize in counter-trading the dreaded H&S top.
")
I put Caterpillar, Inc (CAT) into play as a hedge against bullishness just in time. CAT’s 50DMA breakdown was the signal, and the bounce into the downtrending 20DMA delivered the opportunity for a fade. I took profits on the put spread on Thursday. I could not find any company-specific news to explain the severity of CAT’s drawdown. Absent such news, CAT is a prime candidate for an oversold bounce (although I will prefer to fade such a bounce at resistance).
")
Modine Manufacturing Company (MOD) was one of the dwindling survivors on my buy list. MOD demonstrated strength in the face of market weakness while holding 50DMA support. That strength came to a definitive end last week. MOD sliced through 50DMA support on Wednesday with an 11.1% loss. Like CAT, I could not find company-specific news to explain the severity of the breakdown. The dots are connecting toward a surge in fear over the health of the industrial economy.
")
Over the summer, I lamented missing the long run-up in First Solar (FSLR). As luck would have it, that point was the calm before solar stocks collectively breaking down. The collapse in solar reached a crescendo with Solaredge Technologies (SEDG) collapsing 27.3% post-earnings. Accordingly, the Invesco Solar ETF (TAN) fell 6.1% on the day to a gut-wrenching 39-month low. TAN’s pre-pandemic high is less than 10% away. Needless to say, I am still not adding more shares to my small FSLR holding!
")
Unsurprisingly, the ARK Innovation funds are in trouble again. This collection of speculative funds relied on easy money for their stratospheric performance during the first year and a half of the pandemic. They are now being crushed by higher rates and soaring bond yields. ARK Genomic Revolution (ARKG) is the current laggard.
ARKG cracked its pandemic low for the first time. Last year, ARKG stopped far short of that nadir. In due time, more ARK funds will likely implode back to and below lows from the pandemic. In the meantime, I speculated on some ARKG shares for an eventual oversold bounce back to the downtrending 20DMA. A rebound to the 50DMA would essentially be a bullish move for ARKG.
")
")
")
Be careful out there!
Footnotes
Subscribe for free to get email notifications of future posts!
“Above the 50” (AT50) uses the percentage of stocks trading above their respective 50-day moving averages (DMAs) to measure breadth in the stock market. Breadth defines the distribution of participation in a rally or sell-off. As a result, AT50 identifies extremes in market sentiment that are likely to reverse. Above the 50 is my alternative name for “MMFI” which is a symbol TradingView.com and other chart vendors use for this breadth indicator. Learn more about AT50 on my Market Breadth Resource Page. AT200, or MMTH, measures the percentage of stocks trading above their respective 200DMAs.
Active AT50 (MMFI) periods: Day #1 under 20% (ending 10 days over 20%), Day #24 under 30%, Day #34 under 40%, Day #48 under 50%, Day #53 under 60%, Day #56 under 70%
Source for charts unless otherwise noted: TradingView.com
Full disclosure: long IWM calls, long S&P 500 calendar call spread, long ARKG, long LCID, long VXX puts
FOLLOW Dr. Duru’s commentary on financial markets via StockTwits, Twitter, and even Instagram!
*Charting notes: Stock prices are not adjusted for dividends. Candlestick charts use hollow bodies: open candles indicate a close higher than the open, filled candles indicate an open higher than the close.
“Summer of loving stocks”
Ha! Love the title. I noticed some of the M7 stocks had downward gaps, which, if filled, brought the prices back down to Apr-May-Jun levels. https://twitter.com/ced1106/status/1709230314026062259
Waiting for the CNN Fear and Greed Index to turn to Extreme Greed. Almost there.
The index also uses breadth and VIX as indicators, at Extreme Fear for both.
Thanks for the commentary!
Alot of duration bonds for sale this week….
And thus the on-going pressure on the bond market and stocks!
Thanks for the reminder on this index (I think you meant extreme fear). I need to use this as a complement to my own market breadth assessment.