Stock Market Commentary
Get used to the sentiment shifts. One day the stock market went oversold and over hard. The next day, an oversold bounce shows signs of life for stocks. In particular a classic bottoming signal came in the form of the “hammer” candlestick. Together, the bounce from oversold territory and the bottoming hammer candlestick, create a powerful tailwind for a short-term bullish narrative.
The Stock Market Indices
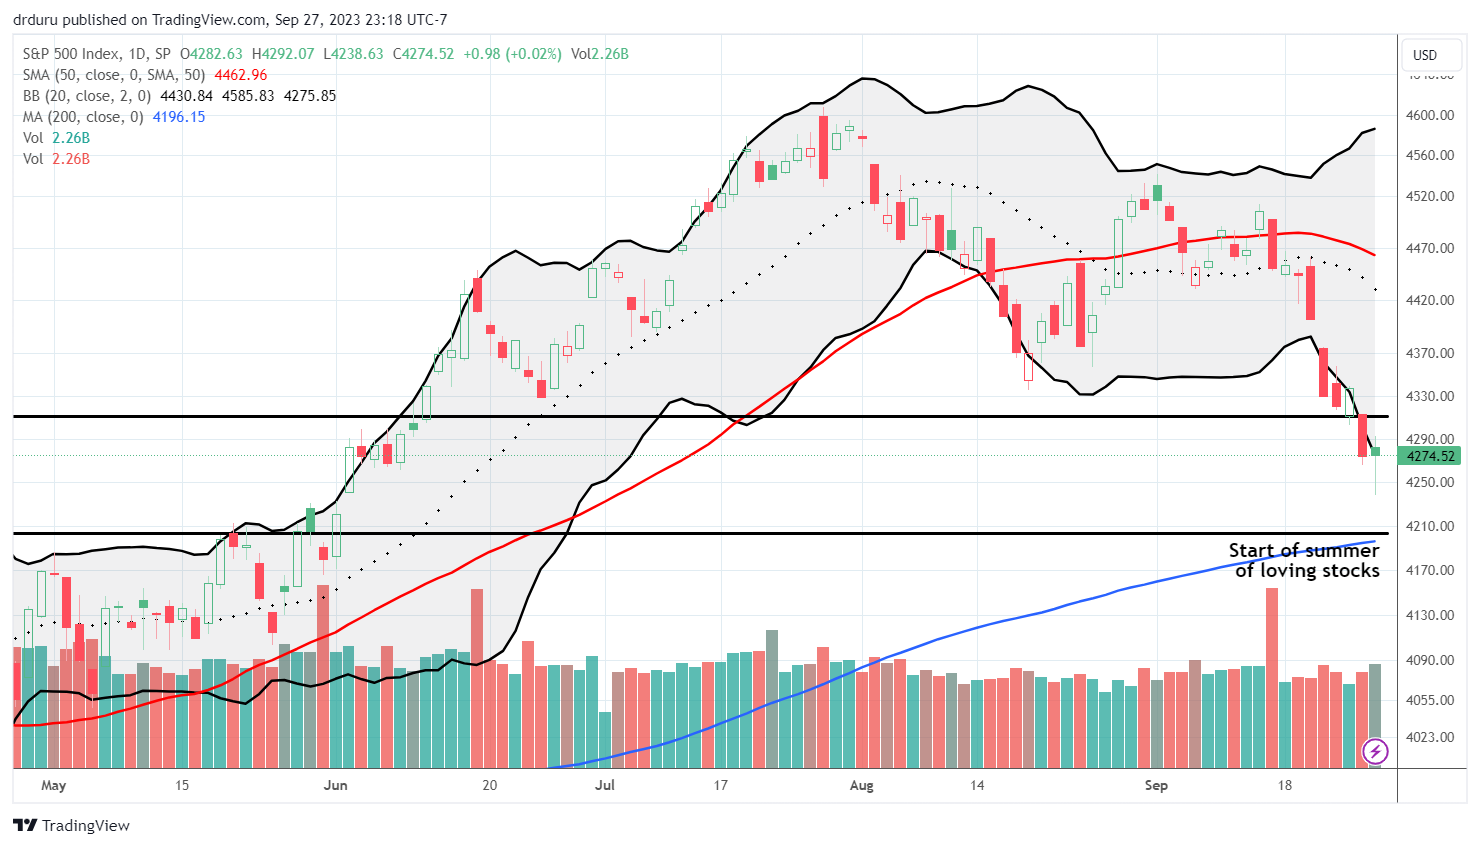
The S&P 500 (SPY) almost confirmed a breakdown below its support from last year’s pre Jackson Hole high. Buyers came to the rescue with an intraday bounce strong enough to form a hammer candlestick. This pattern signals the potential end of a downtrend in price. These signs of life are coming just in time as the index closes in on critical support at the converging 200-day moving average (DMA) (the bluish line below) and the price level that launched the summer of loving stocks.
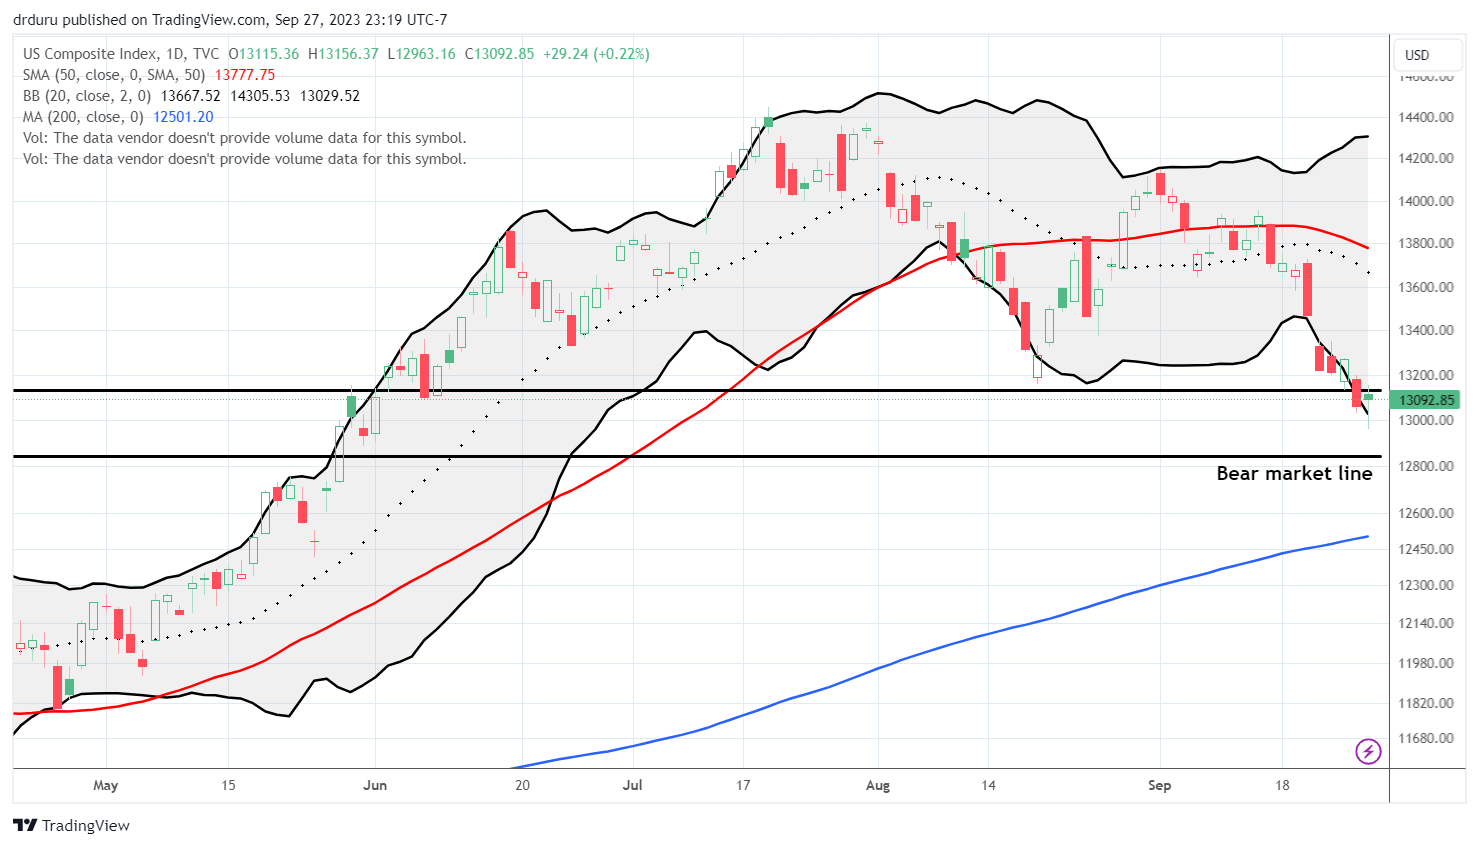
The NASDAQ (COMPQ) got precariously close to its bear market line at the day’s lows. Buyers saved the day and rallied the tech laden index to a 0.2% gain on the day. The fade from the intraday high did not allow the NASDAQ to qualify for hammer status. Note carefully how the March intraday low and the pre Jackson Hole high from 2022 are forming potential resistance to a continuation of an oversold bounce.
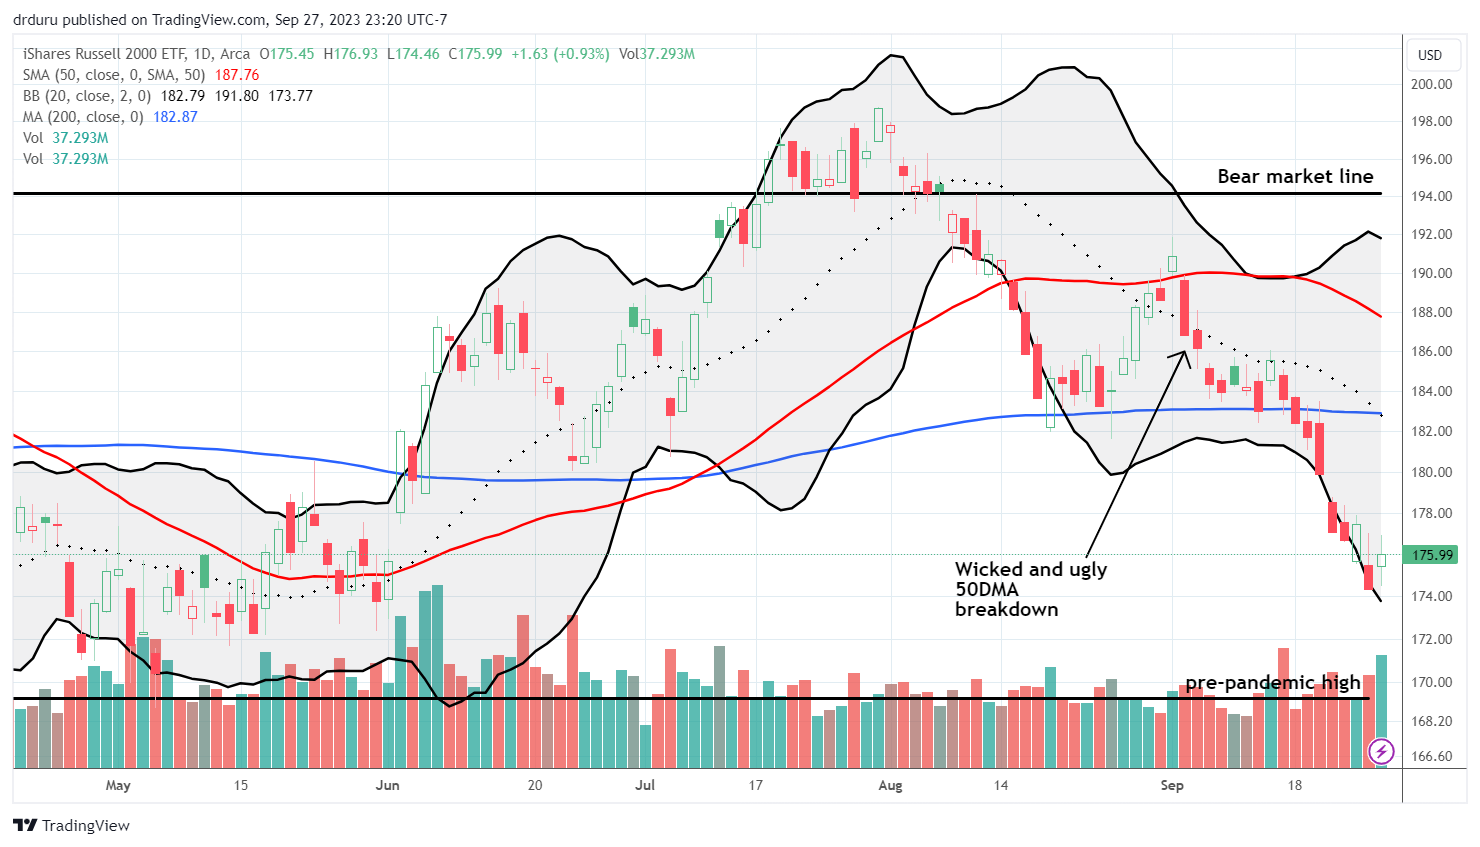
The iShares Russell 2000 ETF (IWM) inexplicably out-performed on the day with a 0.9% gain. The gap up at the open trapped some bears that over-extended themselves on the previous day’s over-stretched selling.
The Short-Term Trading Call With Signs of Life
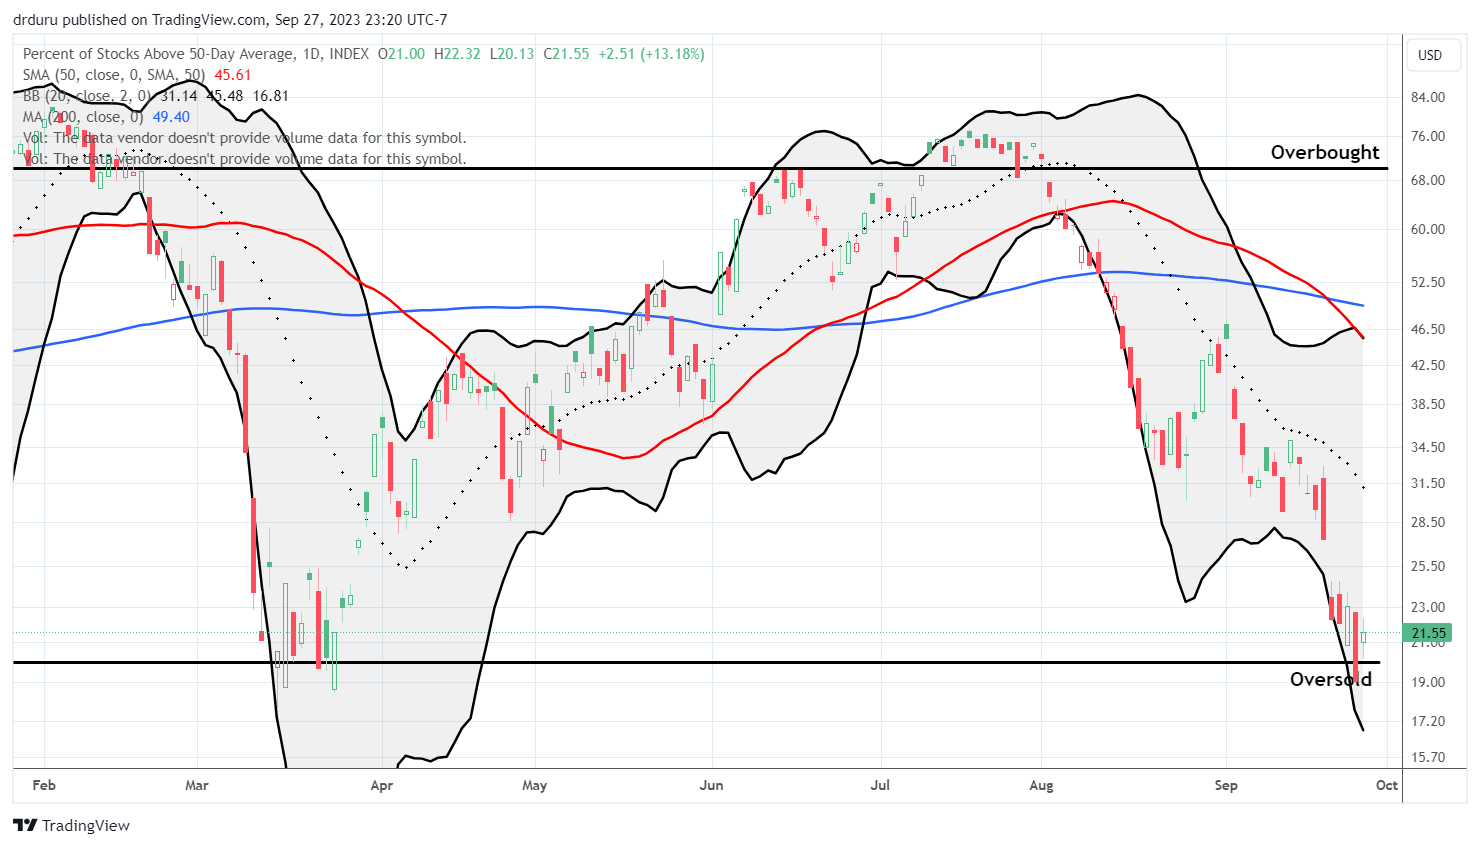
- AT50 (MMFI) = 21.6% of stocks are trading above their respective 50-day moving averages (ending a 1-day oversold period)
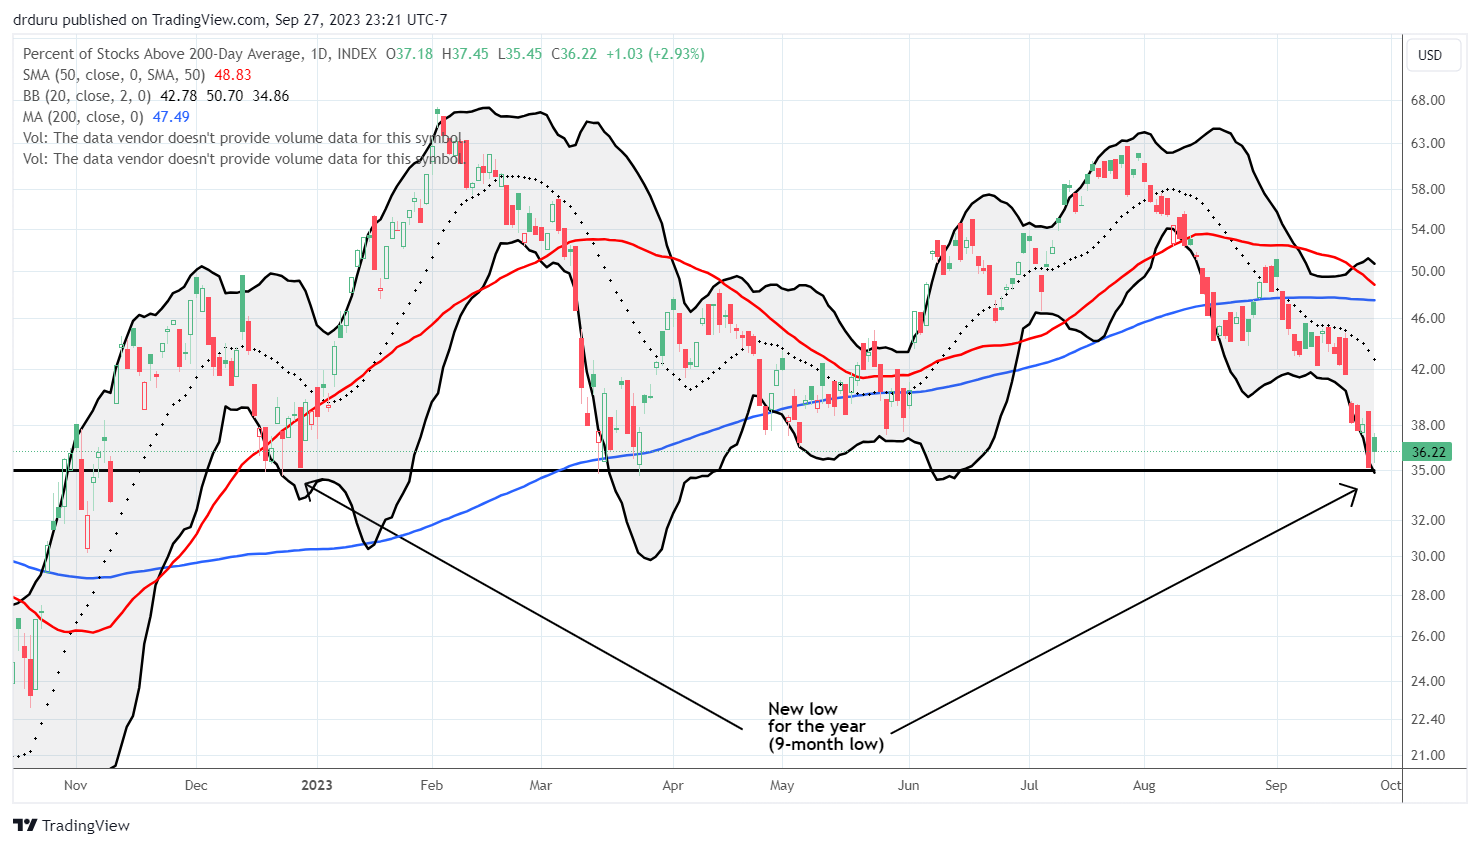
- AT200 (MMTH) = 36.2% of stocks are trading above their respective 200-day moving averages
- Short-term Trading Call: bullish
AT50 (MMFI), the percentage of stocks trading above their respective 50DMAs, rebounded from oversold trading conditions. My favorite technical indicator ended the oversold period at 1 day in duration. While the majority of oversold periods last just one or two days, I am not ready to believe that the pain of September’s selling has just ended in one cathartic plunge into oversold territory and a bottoming hammer pattern. Of course, since my short-term trading call is now bullish, I will not complain if we look back to see how these powerful signs of life carved out a sustained bottom!
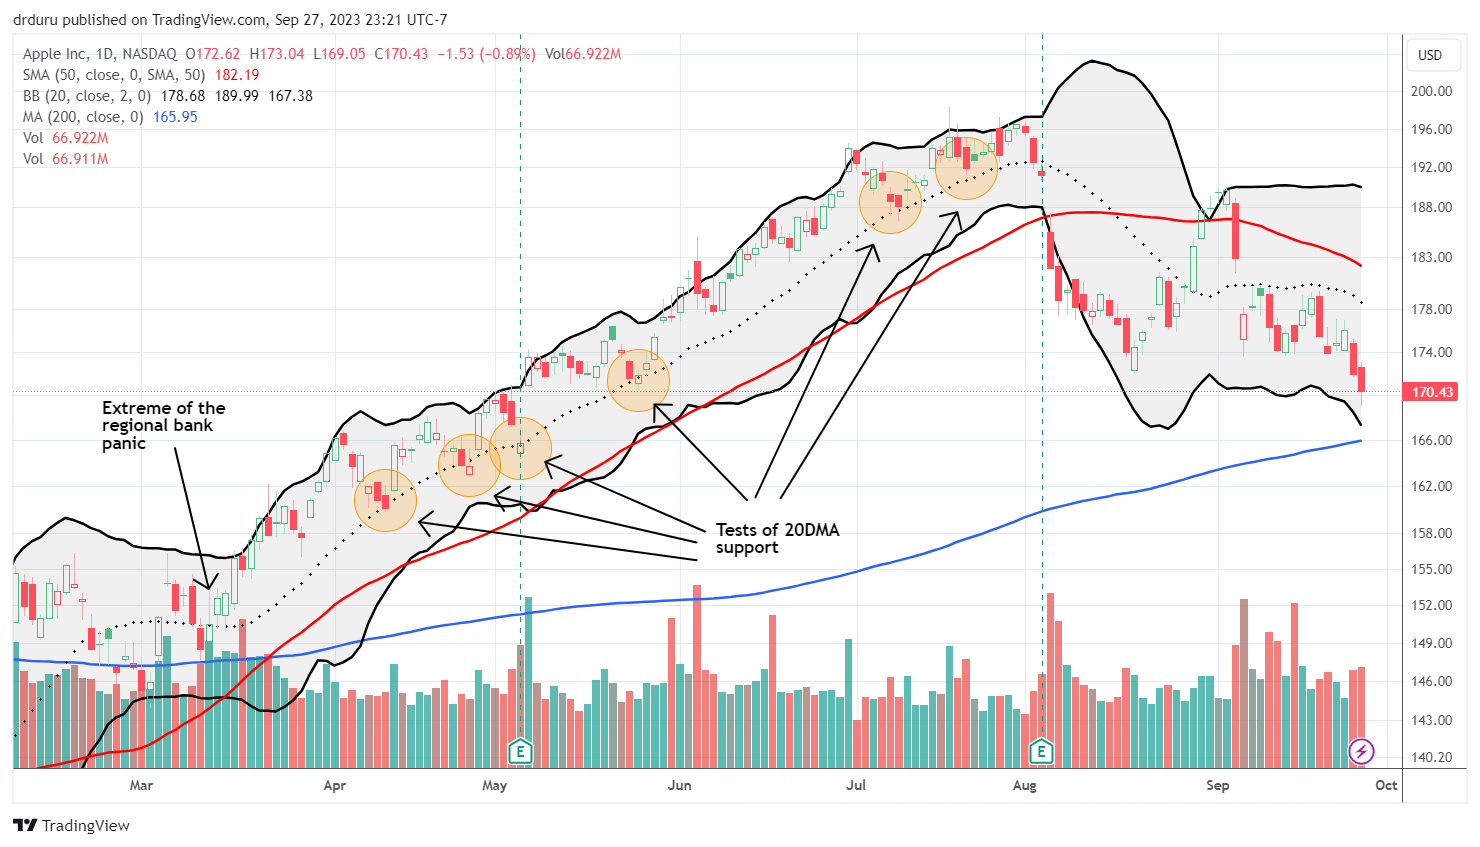
Apple Inc (AAPL) gives me a reason or wariness. One of America’s favorite stocks under-performed the stock market with a 0.9% loss. AAPL even looks ready to test its 200DMA support. I assume the good news here is that such a test in oversold conditions should produce very high odds for a sustained bounce.
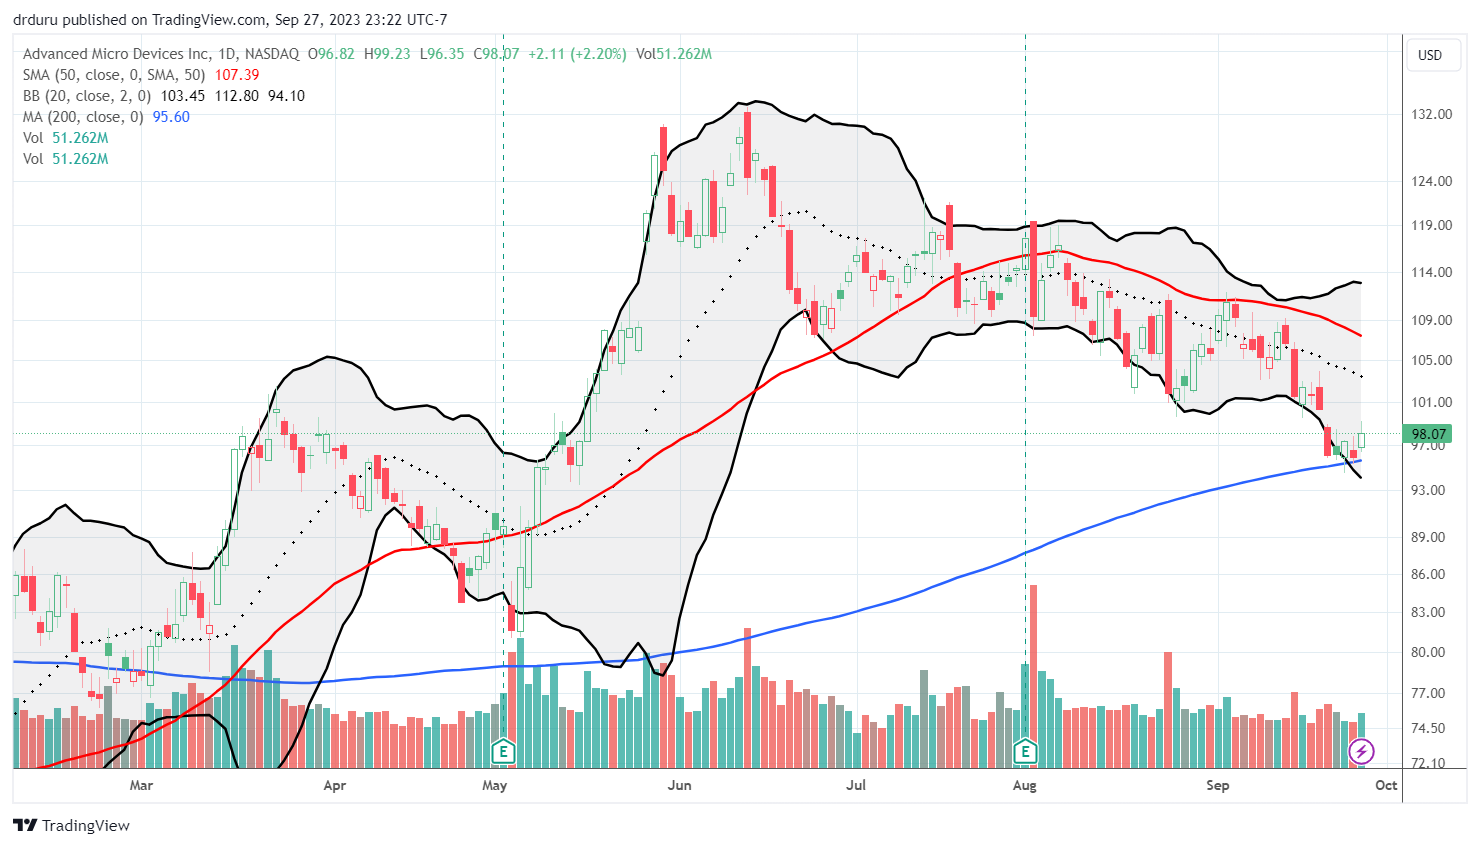
While I am looking for stocks that conquered 50DMA resistance (the red line) or held 50DMA support, there are some interesting stocks toying with 200DMA support. Advanced Micro Devices Inc (AMD) has spent the last 5 trading days toying with 200DMA support while never closing below. Today’s 2.2% gain makes this generative AI play look ready to at least bounce back to the top of its down-trending channel.
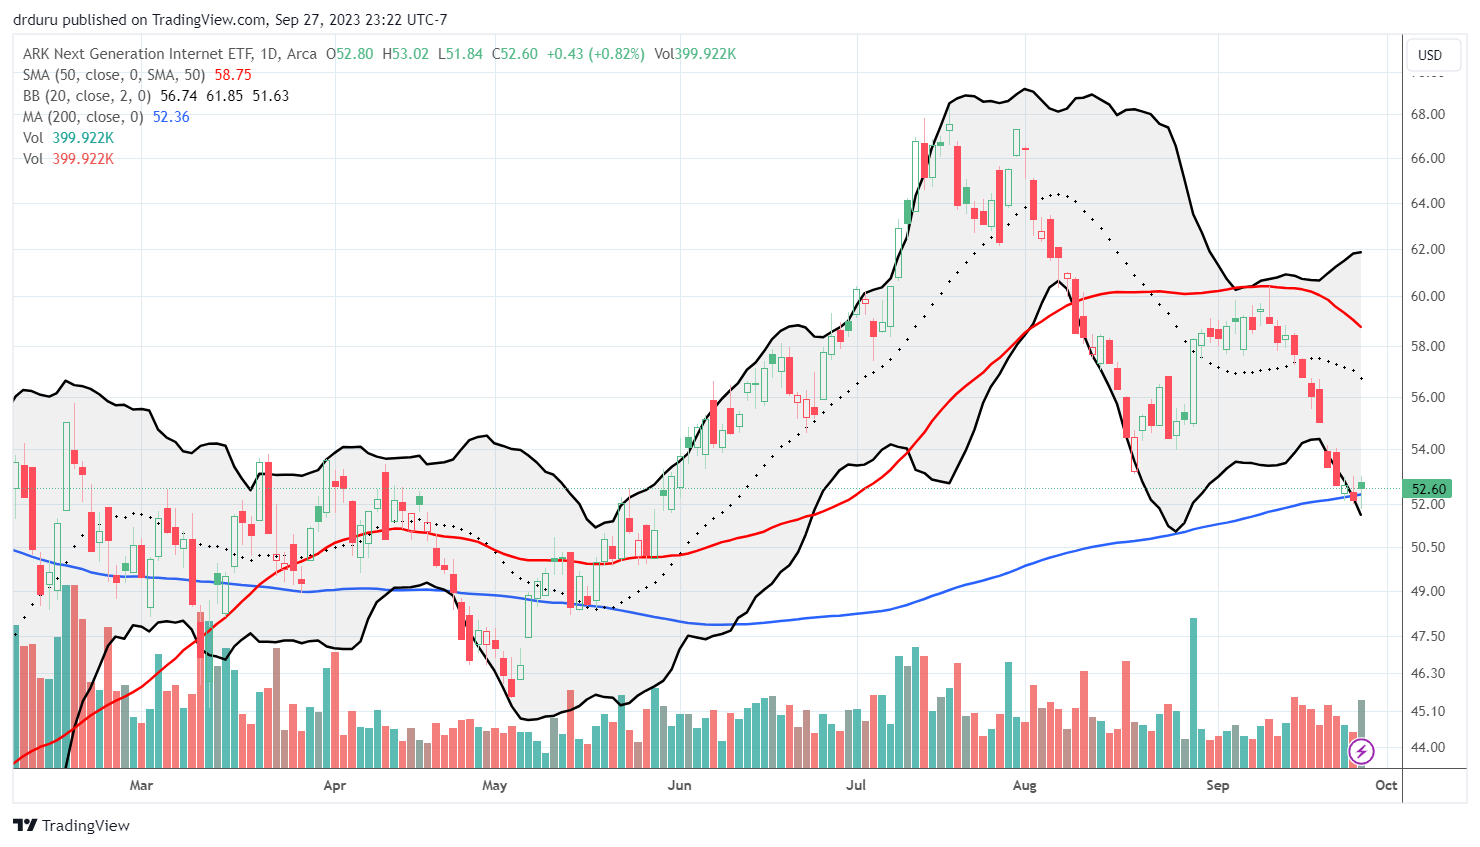
The speculative ARK funds have taken outsized hits the past two months. Higher rates are killers for Cathie Wood’s investment strategy and each of the ARK funds shows the scars. ARK Next Generation Internet ETF (ARKW) has given up all its gains from the May breakout. Yet, ARKW is clinging to signs of life at its 200DMA. I am a buyer here with a tight stop and a quick trigger to profit on a rally to resistance, say, at the 20DMA (the dotted line below).
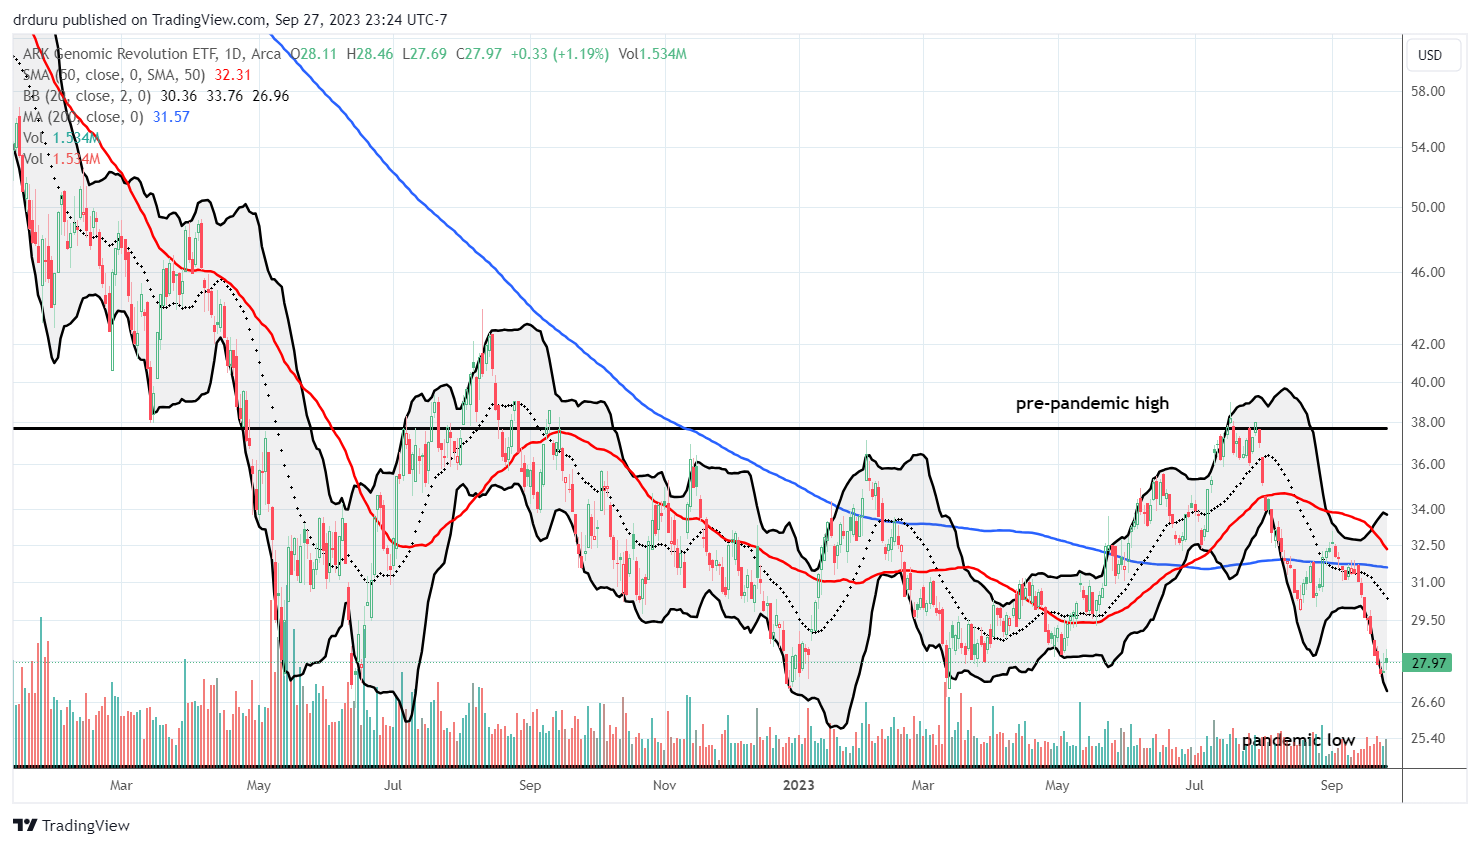
ARK Genomic Revolution ETF (ARKG) shined for a brief moment this summer. The breakout had all the makings of a continuing recovery. Instead, ARKG was slammed with the rest of the market these past two months and is right back to the lows of the year. This potential support is the only reason to speculate in ARKG. I am a buyer at the next sign of higher buying interest. Note well that the pandemic low is not far away!
I recorded a “show and tell” video for other ideas on trading this potentially powerful moment combining oversold conditions with a bottoming hammer. As usual, I used swingtradebot as the stock scanning platform.
Be careful out there!
Footnotes
Subscribe for free to get email notifications of future posts!
“Above the 50” (AT50) uses the percentage of stocks trading above their respective 50-day moving averages (DMAs) to measure breadth in the stock market. Breadth defines the distribution of participation in a rally or sell-off. As a result, AT50 identifies extremes in market sentiment that are likely to reverse. Above the 50 is my alternative name for “MMFI” which is a symbol TradingView.com and other chart vendors use for this breadth indicator. Learn more about AT50 on my Market Breadth Resource Page. AT200, or MMTH, measures the percentage of stocks trading above their respective 200DMAs.
Active AT50 (MMFI) periods: Day #1 over 20% (overperiod ended 1 day oversold), Day #7 under 30%, Day #17 under 40%, Day #31 under 50%, Day #36 under 60%, Day #39 under 70%
Source for charts unless otherwise noted: TradingView.com
Full disclosure: long IWM calls, long S&P 500 call spread and call
FOLLOW Dr. Duru’s commentary on financial markets via StockTwits, Twitter, and even Instagram!
*Charting notes: Stock prices are not adjusted for dividends. Candlestick charts use hollow bodies: open candles indicate a close higher than the open, filled candles indicate an open higher than the close.


