
The Market Breadth Summary
- Damage from the AI trade drove the NASDAQ down 4.5% for the week and pushed the S&P 500 below its 50-day moving average.
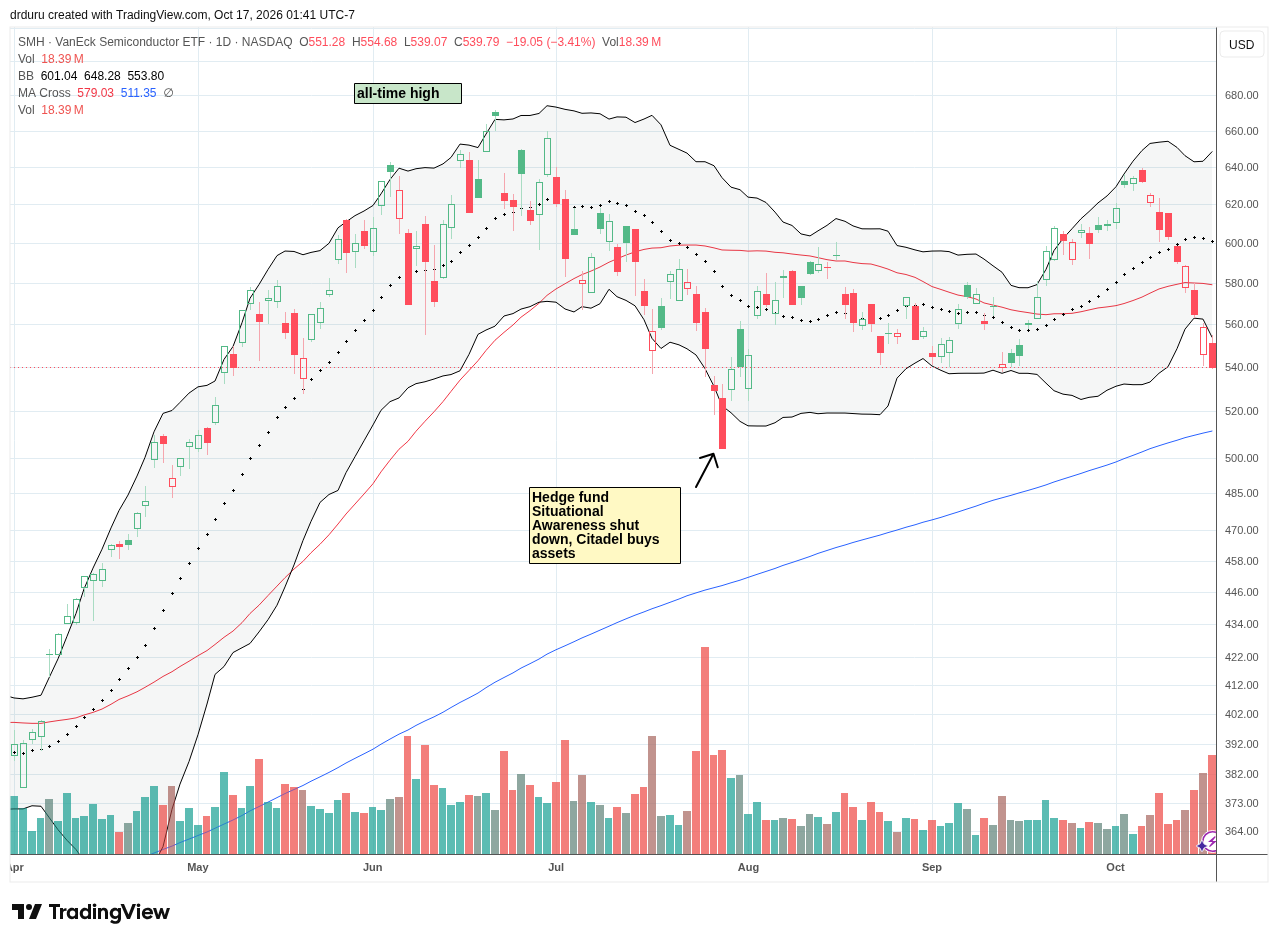
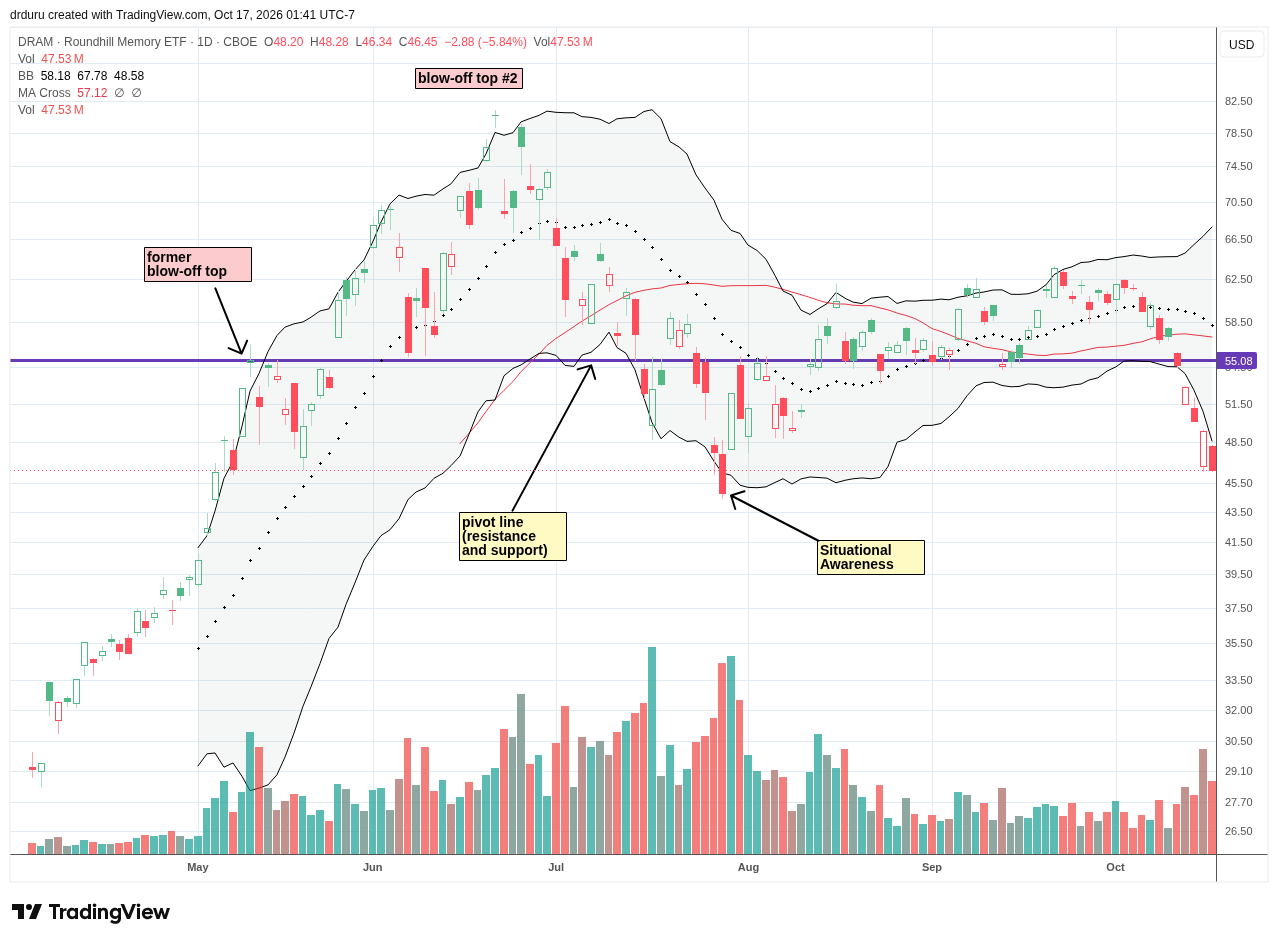
- Semiconductor and memory ETFs suffered sharp declines, with SMH losing 10.5% and DRAM falling 18.8% for the week.
- September core CPI inflation rose to 2.6% annually, while the PPI for final-demand goods increased 2.6% for the month.
- Market breadth showed mixed signals as AT50 closed at 28.3% and AT200 fell briefly to a new low for the year.
- Equal-weight stocks and financials showed relative resilience, but Friday’s widespread technology selling challenged the emerging market breadth bottom.
- The short-term trading call remained neutral as AI-related damage intensified and key support levels still could provide a source of price stabilization.
The Stock Market Summary
Damage from the AI trade drove the NASDAQ to its worst weekly decline since June. A convergence of events and headlines has brought the market to another critical juncture, this time in the last of the stock market’s most dangerous months of the year. The renewed tech optimism in late September that accompanied the release of Meta Platforms’ consumer-facing AI agent Muse has given way to fresh fears about the viability of the AI investment boom.
In the prior week, questions arose about OpenAI missing revenue expectations. OpenAI’s position in the center of aggressive AI infrastructure investments means any hiccup with the company’s business model can trigger large and cascading ripple effects. Anthropic’s reported sequential revenue growth disappointed high expectations. Last week, Anthropic’s sequential decline in revenue growth rekindled fears even though the company reported cash flow positive financials. Anthropic also occupies a critically central role in AI investments. On October 14th, as Gartner released a warning about AI infrastructure impairments by the end of 2030, a post on X from venture capitalist Chamath Palihapitiya showed how CRWV’s debt conditions had deteriorated severely. The CEO’s protests fell on deaf ears until an analyst-generated rebound the next day. The rebound proved fleeting although the technicals looked promising. Last week ended with renewed selling that spread beyond the AI trade and throughout high tech.
These pressures were amplified by strong economic and inflation data that reinforced concerns about further Federal Reserve rate hikes and tighter financial conditions. These expectations are further bolstered by an economy demonstrating consistent strength through measures such as the ISM Services PMI®.
On October 14, the core Consumer Price Index (CPI) delivered an annual inflation rate of 2.6% in September, up from 2.4% in August. The next day, the Producer Price Index (PPI) came in hot. According to the Bureau of Labor Statistics (BLS), “prices for final demand goods advanced 2.6 percent in September, the largest increase since data were first calculated in December 2009.” Over 80% of the 2.6% monthly increase in final-demand goods prices came from higher energy prices. This kind of inflation at the producer level can easily cascade throughout the economy in the form of higher prices for finished goods and services. As if to emphasize the risks, oil prices rallied all week long.
Despite these cumulative pressures, market breadth remained resilient. While downtrends remain in place for my favorite indicators of market breadth, signs of bottoming remain in place. Still, with earnings season underway, I am not taking for granted the small signs of optimism in slowly changing market breadth. The damage in the AI trade will stay contained only as long as money rotates to other sufficiently large sectors. Friday’s broadly based weakness in technology stocks raised the specter of an October-style flush to oversold trading conditions, an event that I would actually welcome as a prime buying opportunity per the seasonal weakness of the stock market and my trading rules for oversold conditions.
S&P 500 (SPY)
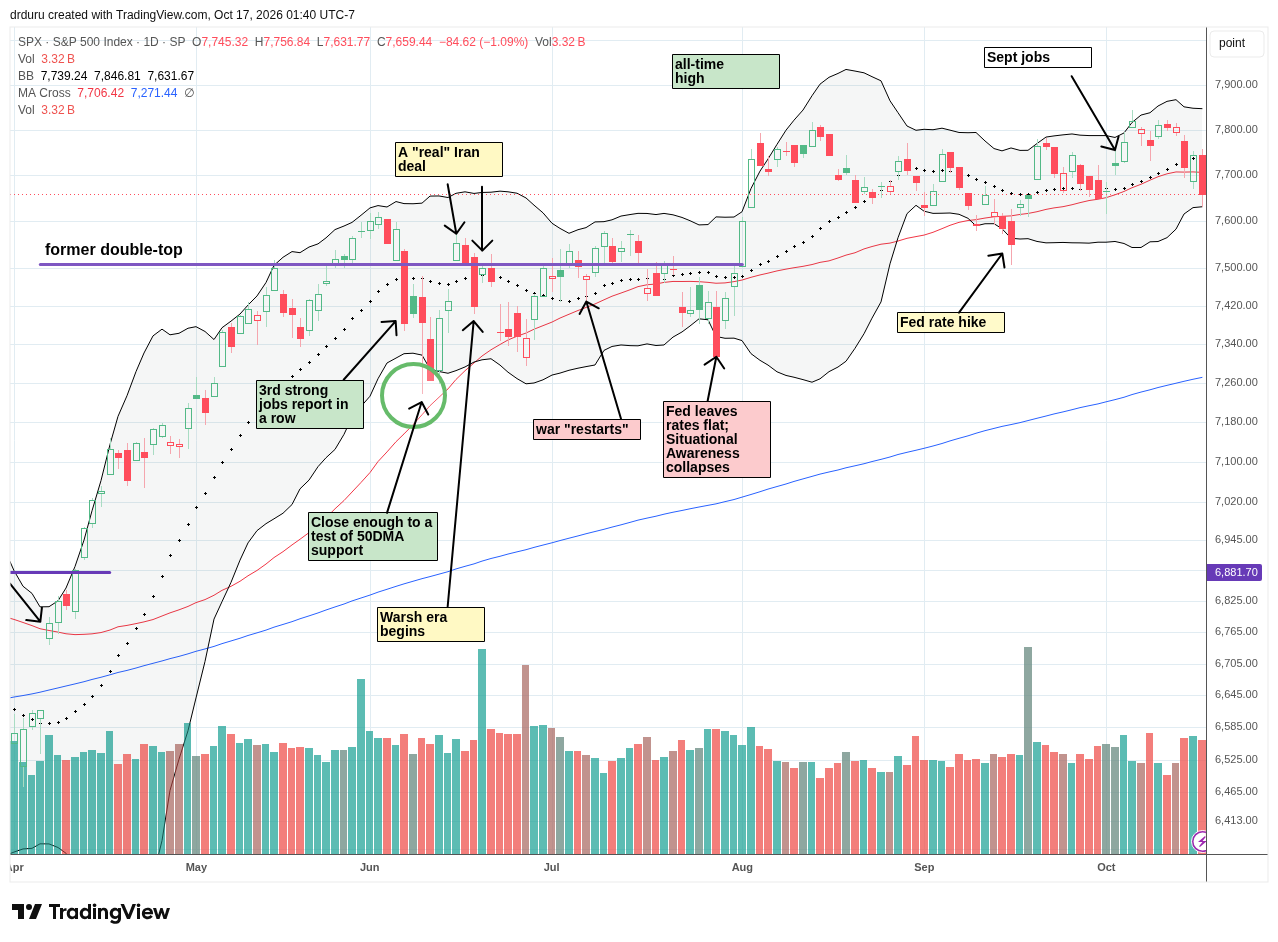
The S&P 500 (SPY) fell 1.1% on Friday and suffered its first breakdown below its 50-day moving average (DMA) (red line) since the day before the Fed’s September rate hike. The index leaves behind a false breakout to an all-time high in early October. While I did not draw it, the resulting technical pattern is a double-top. The S&P 500 looks bearish, but this juncture makes things difficult for chasing the index to the downside. Market breadth is near oversold levels and potentially bottoming (see below), and the September lows offer potentially strong support. With damage mainly coming from AI-related trades, more targeted market calls make the most sense.
NASDAQ (COMPQ)
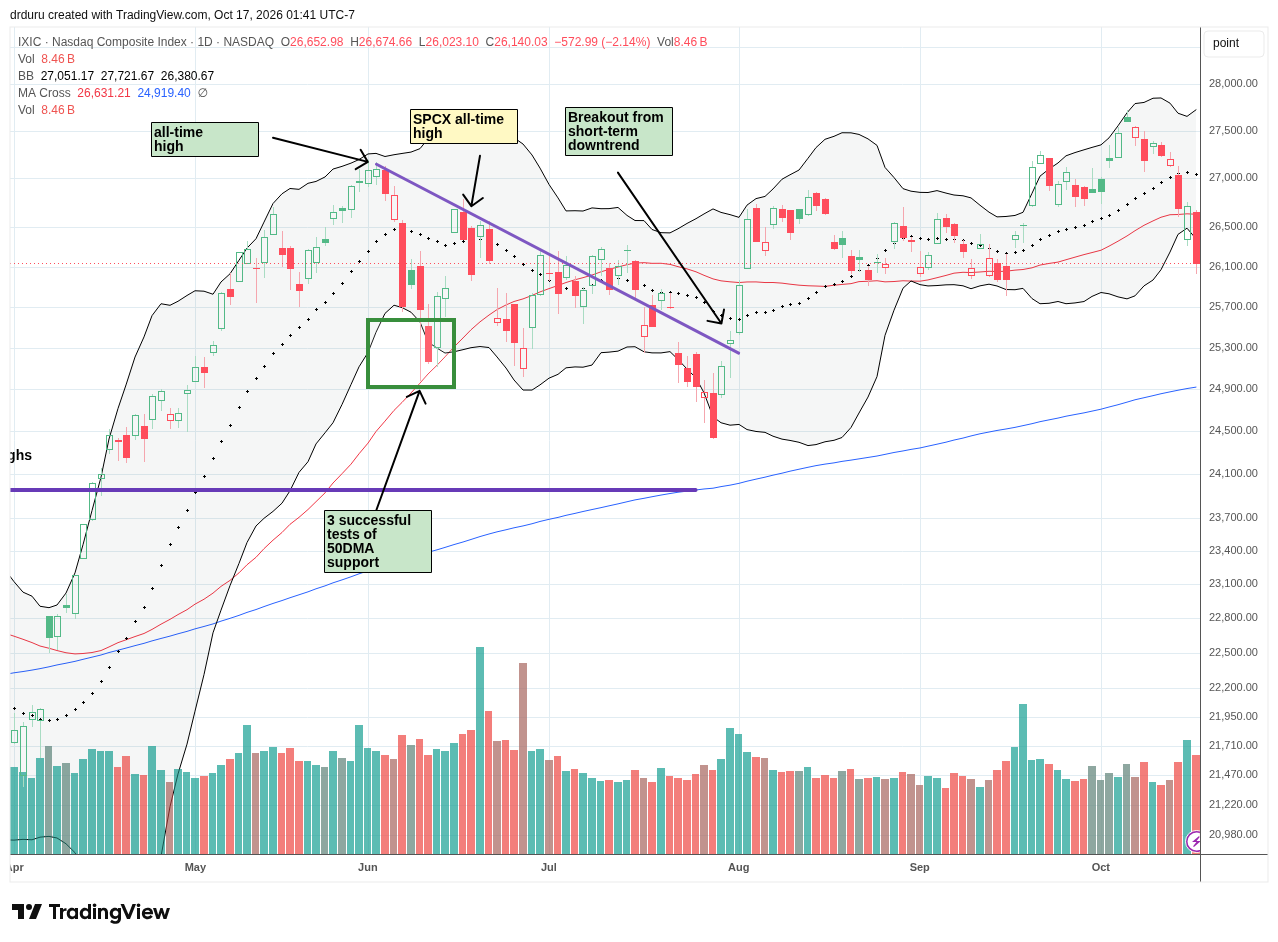
With its heavy weighting in tech stocks, the NASDAQ of course got hit hardest by the damage in AI trades. The tech-laden index fell 2.1% on Friday and 4.5% for the week. The NASDAQ’s false breakout is more clear than the S&P 500’s fake-out. Bears can also make a better case to go short tech IF the NASDAQ breaks below the September lows. I am making that assessment because the August and September lows should offer firm support since they held for a long duration. A breach would confirm expanding weakness and bearishness and would put 200DMA support (the blue line) in play.
iShares Russell 2000 ETF (IWM)
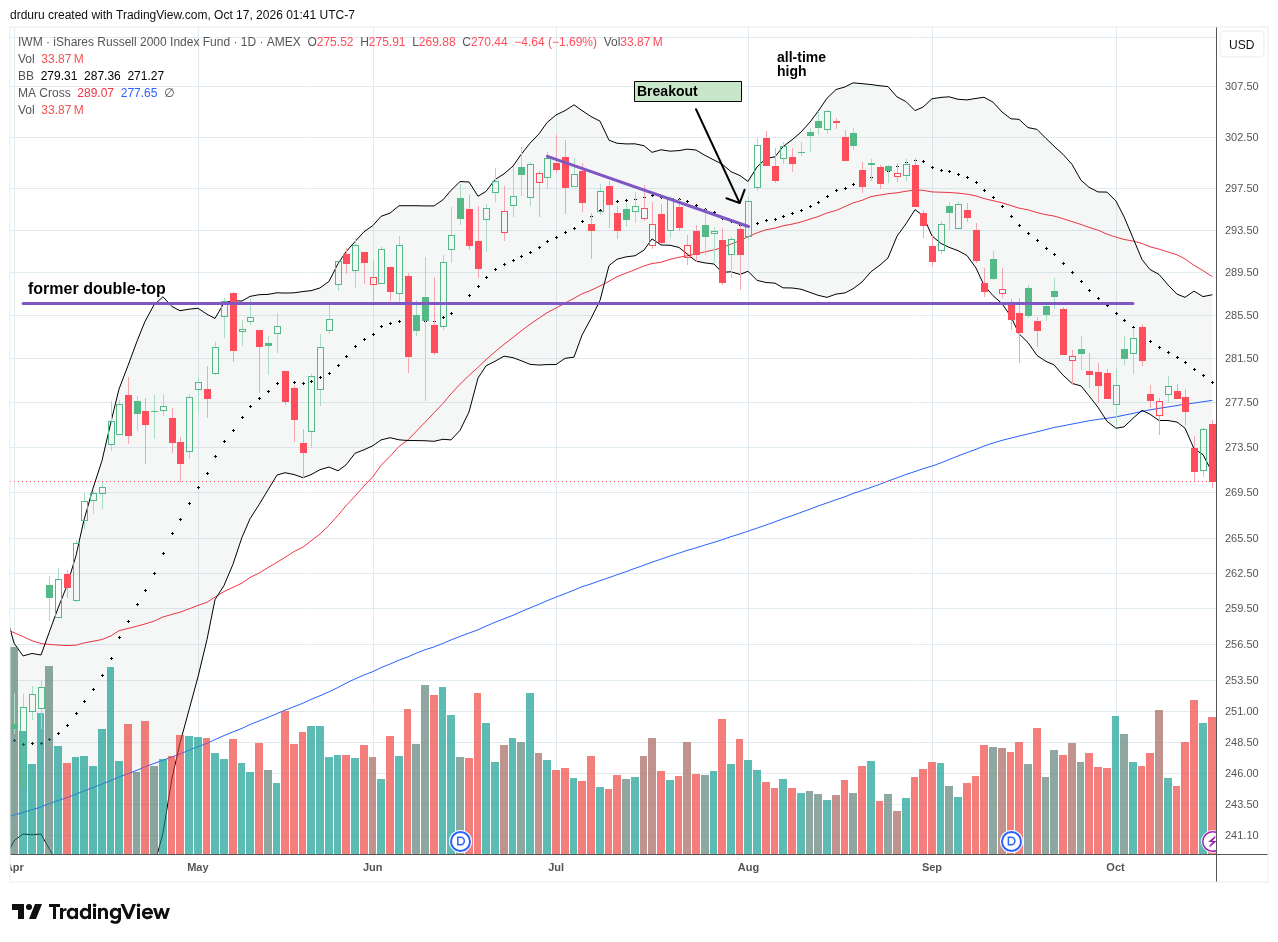
The iShares Russell 2000 ETF (IWM) is in full bearish position. Not only has the ETF of small caps confirmed a 200DMA breakdown, but it also remains trapped in a primary downtrend defined by its 20DMA (dashed line). Thus, I have suspended the weekly call option trade on IWM. I am now watching for IWM to break out above its converging resistance at the 20 and 200DMAs. To the downside, I would get interested with market breadth in oversold conditions.
The Short-Term Trading Call With Damage
- AT50 (MMFI) = 28.3% of stocks are trading above their respective 50-day moving averages
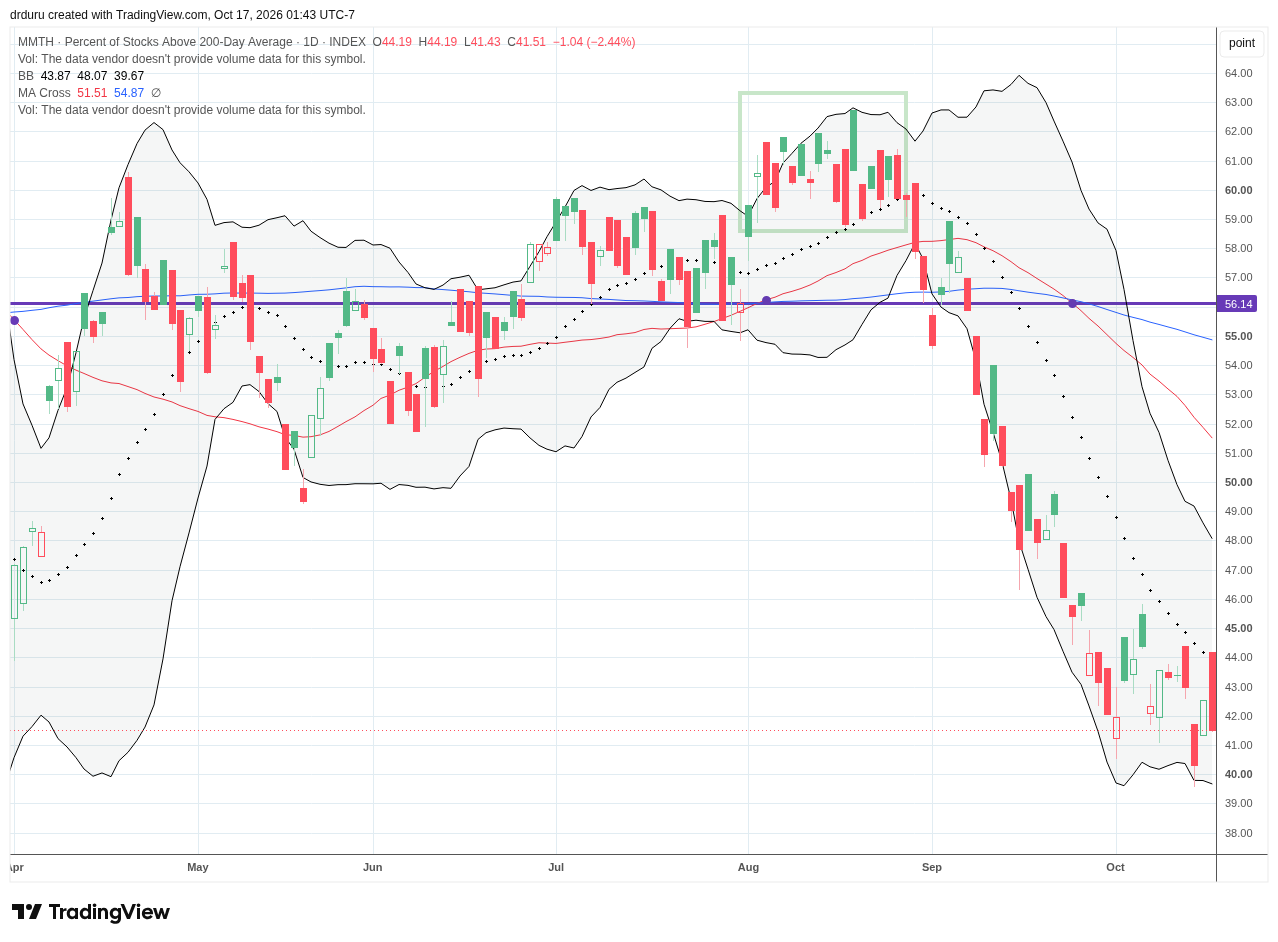
- AT200 (MMTH) = 41.5% of stocks are trading above their respective 200-day moving averages
- Short-term Trading Call: neutral
AT50 (MMFI), the percentage of stocks trading above their respective 50DMAs, closed the week at 28.3%. The one percentage point drop belies major churn. On Tuesday, my favorite technical indicator made a continuation move that seemed to confirm the bullish implications for the previous week’s slowly changing bearish divergence. On Wednesday, AT50 plunged back to 25.6% as the damage from the AI trade took its toll. A rebound reversed all the market breadth losses the very next day. A swift rotation away from the AI trade pushed AT50 to a convincing breakout at Friday’s open. But Friday’s close took market breadth below the downtrend and left the bottoming in market breadth in doubt. Still, my default assumption here is that AT50 is bottoming above the oversold threshold.
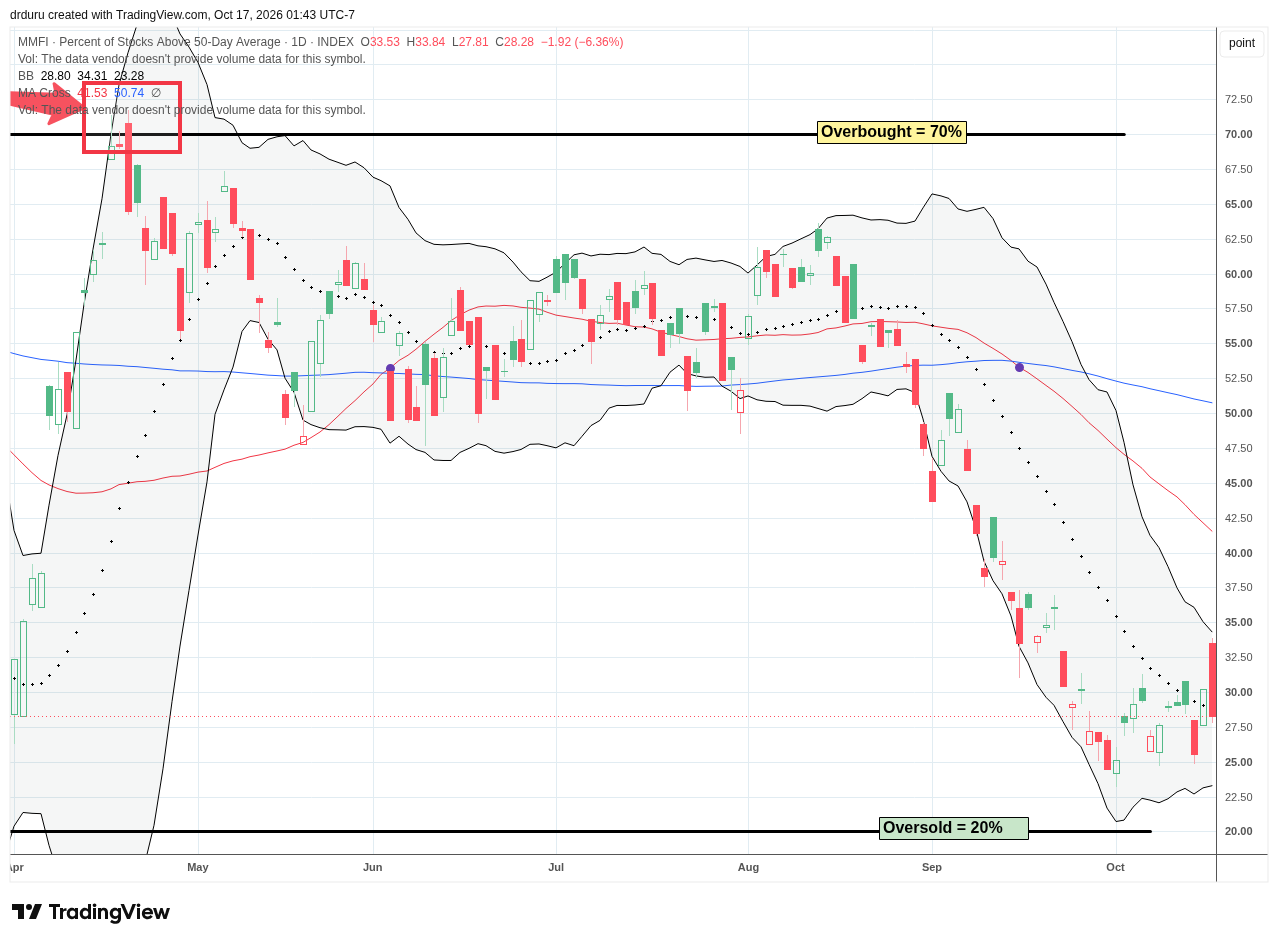
AT200, the percentage of stocks trading above their respective 200DMAs, made a new low for the year on Friday’s selling. A sharp rebound failed right at the downtrend line. Thus, this longer-term indicator of the health of market breadth is still flashing a yellow warning flag.
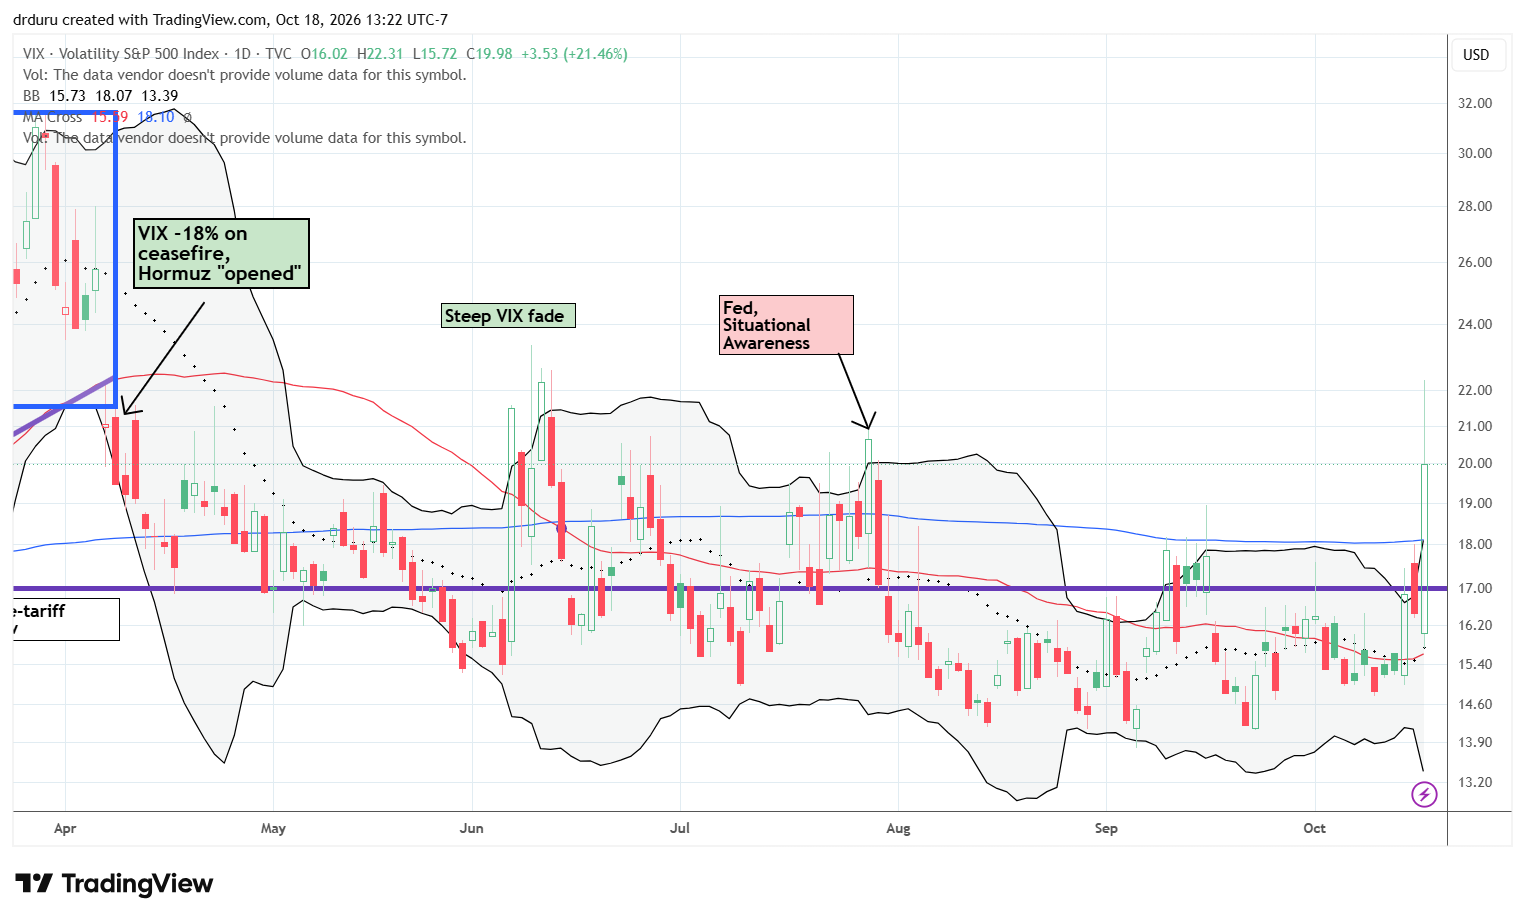
The volatility index (VIX) gained 21.5% after fading from 22.3 at the intraday high. Notably, the VIX’s fade reversed a breakout above the Situational Awareness level. This behavior suggests that the awakening in volatility could be the beginning of the end of the selling instead of an indicator confirming the beginning of a larger sell-off. Some new catalyst could of course revive selling momentum. Until then, the VIX’s behavior supports a bottoming in market breadth.
The Equities
CoreWeave (CRWV)
Description: CoreWeave is an AI-native cloud infrastructure provider built to run large-scale AI training and inference workloads.
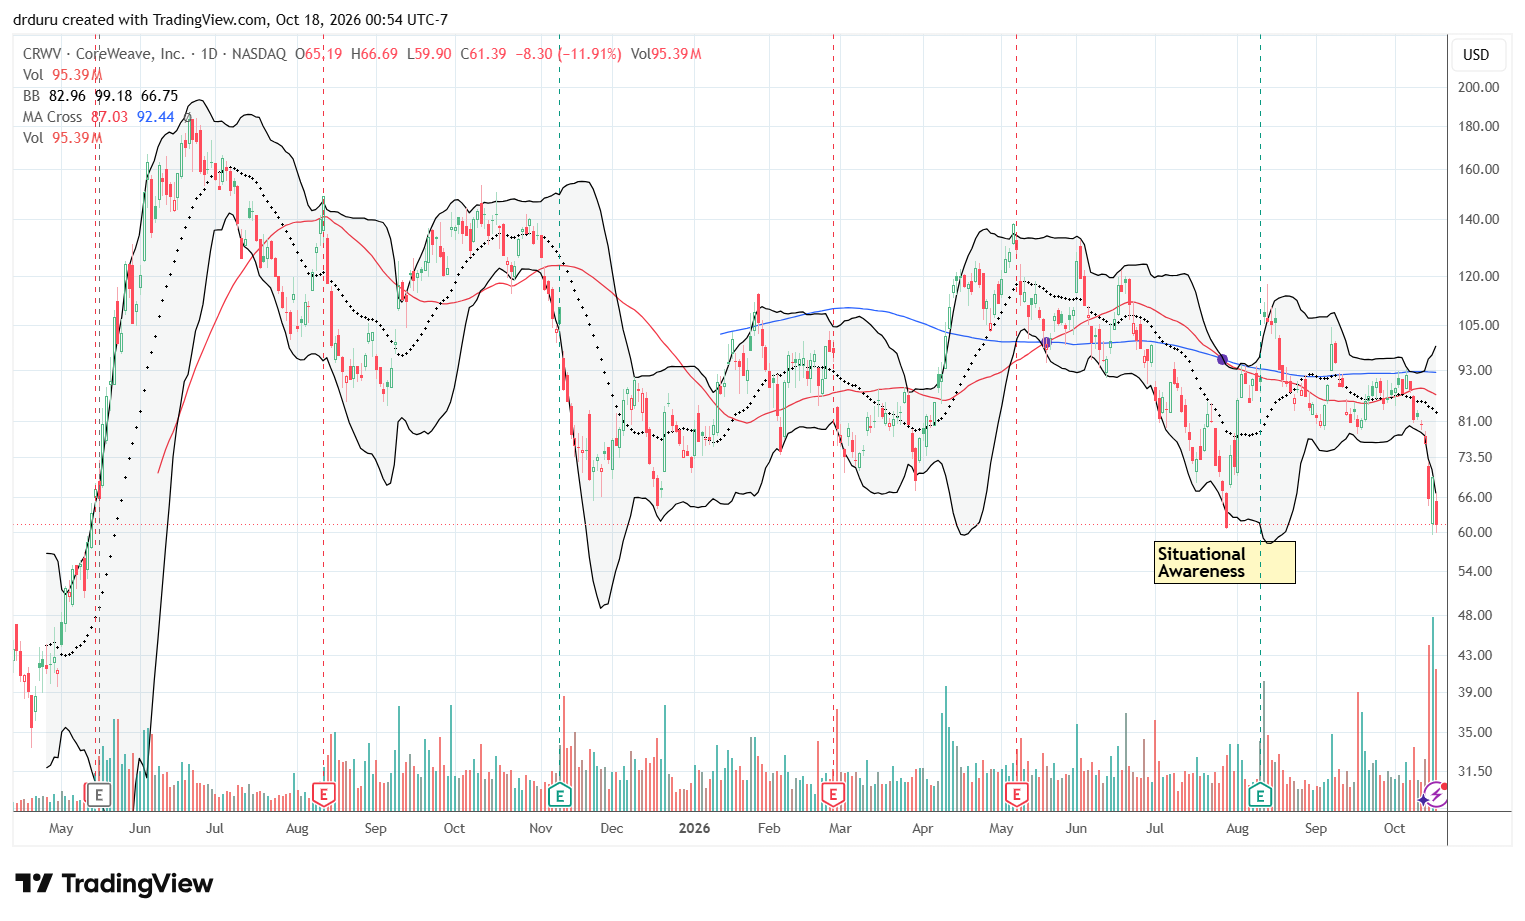
Technical Status: CoreWeave (CRWV) plunged 15.5% on debt concerns and fell another 11.9% on Friday to its Situational Awareness low.
Trade Commentary: CRWV is suffering from a debt scare directly related to soaring interest rates and increasing worries that revenues will fall short of servicing the company’s high debt levels. Yields on some CoreWeave bonds briefly exceeded 15%, and the cost of insuring its debt against default reached record highs. The chart below shows the critical technical juncture for the stock. A close below the Situational Awareness low in July would put in play a complete reversal of the sharp run-up in May and June of 2025. The stock has gone nowhere since that run-up.
CRWV enjoyed a temporary reprieve on Thursday as NVIDIA’s CEO Jensen Huang insisted that CoreWeave is in fine financial condition. Those reassurances followed CoreWeave’s CEO defending the company’s “financial engine.” The stock gained 5.9%. Analysts also did their best to save the stock from a collapse with Bank of America and Cantor Fitzgerald rushing out positive notes. Yet, CRWV remained below its lower Bollinger Band going into a tenuous trading week.
VistaShares Artificial Intelligence Supercycle ETF (AIS)
Description: The VistaShares Artificial Intelligence Supercycle ETF (AIS) is an actively managed exchange-traded fund that invests in global artificial intelligence companies. It focuses on the AI supply chain, targeting businesses that derive significant revenue from high-performance semiconductors, data center infrastructure, and AI-enabled applications.
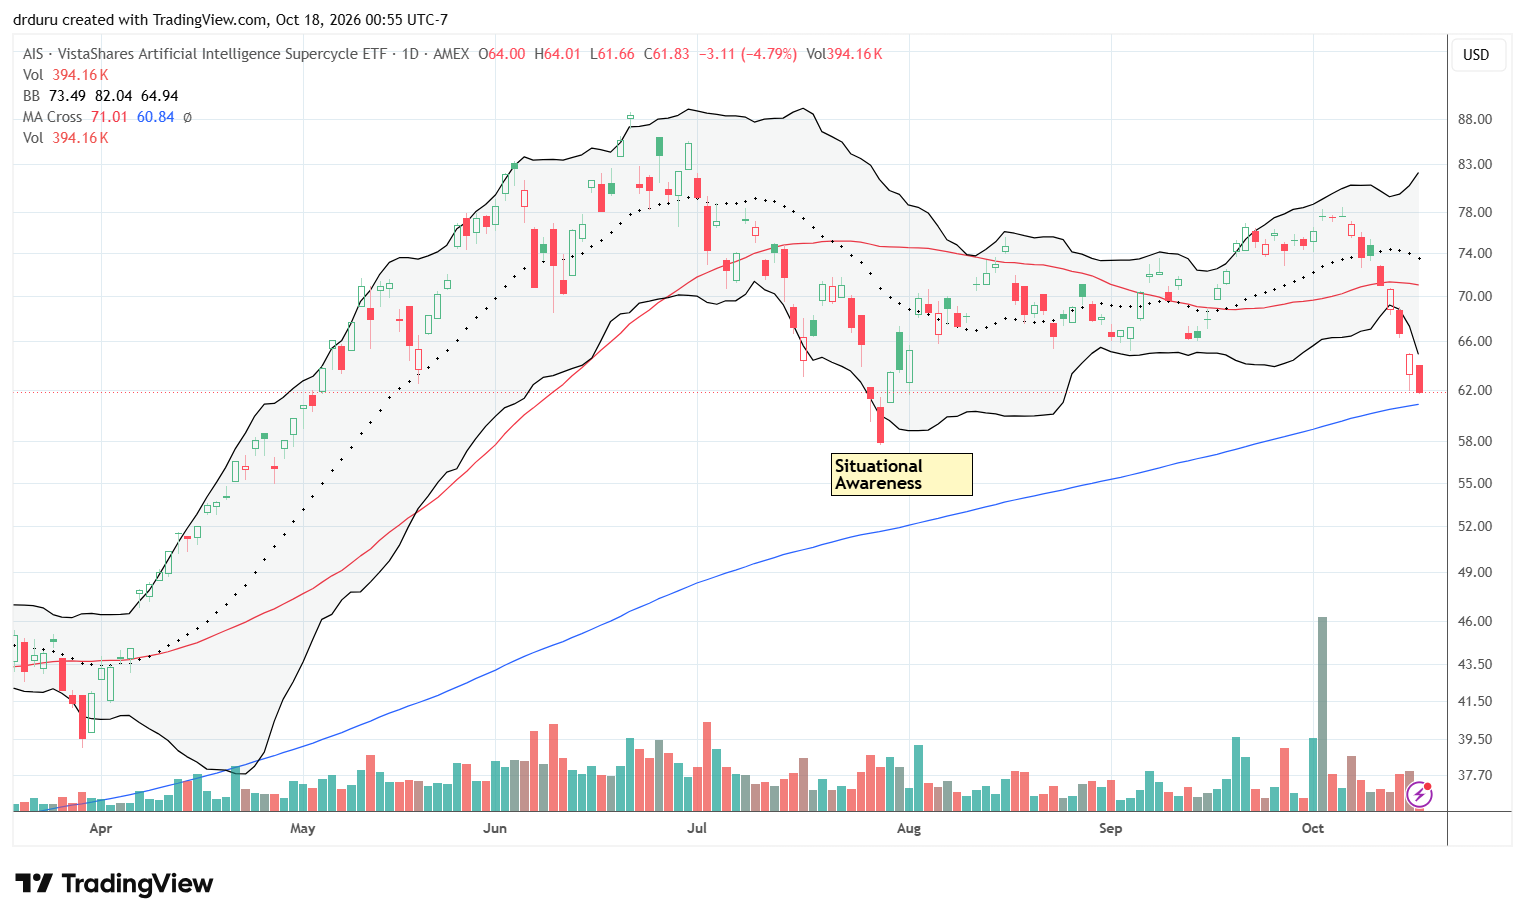
Technical Status: VistaShares Artificial Intelligence Supercycle ETF (AIS) confirmed a 50DMA breakdown on its way to testing 200DMA support.
Trade Commentary: The technicals for AIS demonstrate the high stakes juncture for the AI trade. AIS is down 17.3% for the month and Friday’s 4.8% pullback put 200DMA support into play. This third consecutive close below the lower Bollinger Band (BB) means AIS is over-extended to the downside and primed to rebound sharply. If the 200DMA gives way, then only the Situational Awareness low in July stands as a blocker to a complete reversal of the rally since April. There are no other “natural” points of support below that level thanks to the near-relentless 3-month rally from April.
VanEck Semiconductor ETF (SMH)
Description: The VanEck Semiconductor ETF tracks U.S.-listed companies involved primarily in semiconductor production and semiconductor equipment.
Technical Status: The VanEck Semiconductor ETF (SMH) has sold off almost all of October straight down to its September lows.
Trade Commentary: SMH fell 10.5% for the week as traders and investors aggressively reduced exposure to the AI-driven trade. The breadth of the decline across chip designers, memory producers and equipment suppliers made semiconductors the clearest pocket of AI-related damage during the week. If weakness continues, SMH will test 200DMA support before it challenges support from the Situational Awareness low. If a 200DMA test coincides with oversold trading conditions, I will dip my toe into more semiconductor trades. I am not eager to buy here given the looming double top forming.
Roundhill Memory ETF (DRAM)
Description: The Roundhill Memory ETF is an actively managed ETF focused on global companies involved in semiconductor memory and storage, including HBM, DRAM and NAND.
Technical Status: The Roundhill Memory ETF (DRAM) has returned to its Situational Awareness low after persistent follow-through to its 50DMA breakdown.
Trade Commentary: DRAM declined 18.8% for the week, making memory one of the most damaged sectors of the AI trade. Sentiment accelerated to the downside on Tuesday October 13 after China’s CXMT disclosed progress on a denser memory architecture, raising questions about future competition even though commercial viability remains uncertain. The selloff was amplified by broader concerns over AI spending. With DRAM dropping to its Situational Awareness low, I was tempted to start nibbling, but I decided to wait and buy on strength. A reversal of Friday’s 5.8% loss will make me more interested in speculating.
Invesco S&P 500 Equal Weight ETF (RSP)
Description: The Invesco S&P 500 Equal Weight ETF tracks an index that gives each S&P 500 constituent the same portfolio weight at rebalancing.
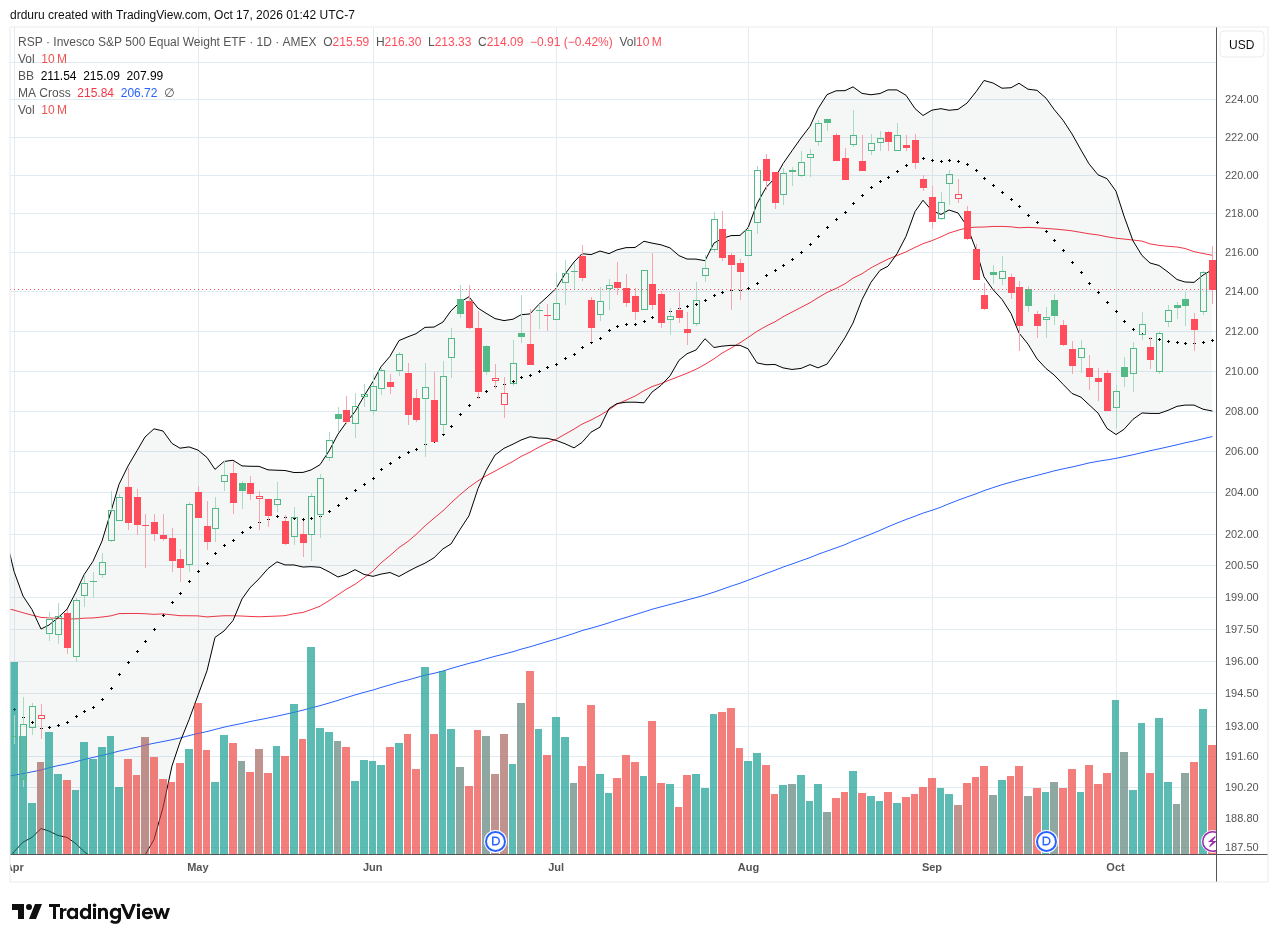
Technical Status: The Invesco S&P 500 Equal Weight ETF (RSP) failed at 50DMA resistance but the 20DMA breakout and uptrend from recent lows remain intact.
Trade Commentary: RSP stood in strong contrast to the damage in the AI trade. RSP only gained 0.5% for the week, but it confirmed a 20DMA breakout despite a failure at 50DMA resistance. The resilience in this ETF demonstrates the targeted nature of the latest selling in the market. This coming week, I will be looking for signs of a rotation out of the equal-weight S&P 500 stocks, small caps in IWM, and financials and back to AI trades.
Cerebras Systems (CBRS)
Description: Cerebras Systems designs artificial-intelligence computing systems based on wafer-scale processors and related hardware and software.
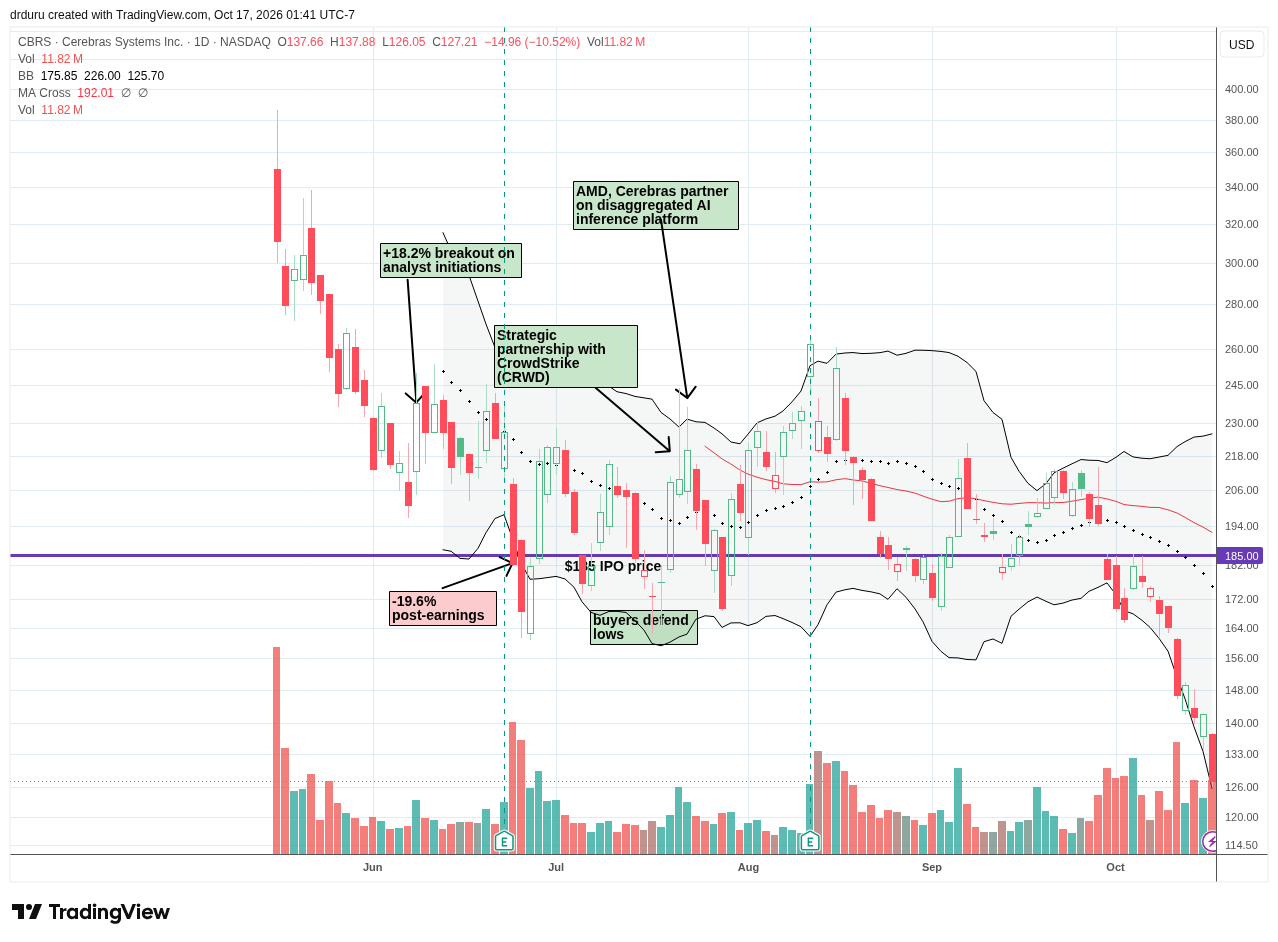
Technical Status: Cerebras Systems (CBRS) completely broke down in October with new all-time lows nearly every day for the last two weeks.
Trade Commentary: CBRS fell 22.5% during the week as traders retreated from risks in specialized AI computing companies. Microsoft added a fresh competitive concern on Monday by detailing plans for large-scale deployment of its own Maia AI chips beginning in 2027, while a scheduled post-IPO share unlock added another potential source of supply. I dropped the ball on CBRS as I continued to hold the stock despite its acceleration to the downside starting with Monday’s 10.6% decline. Now, I am looking to take my loss on a rebound back to resistance at the previous all-time low of $164.
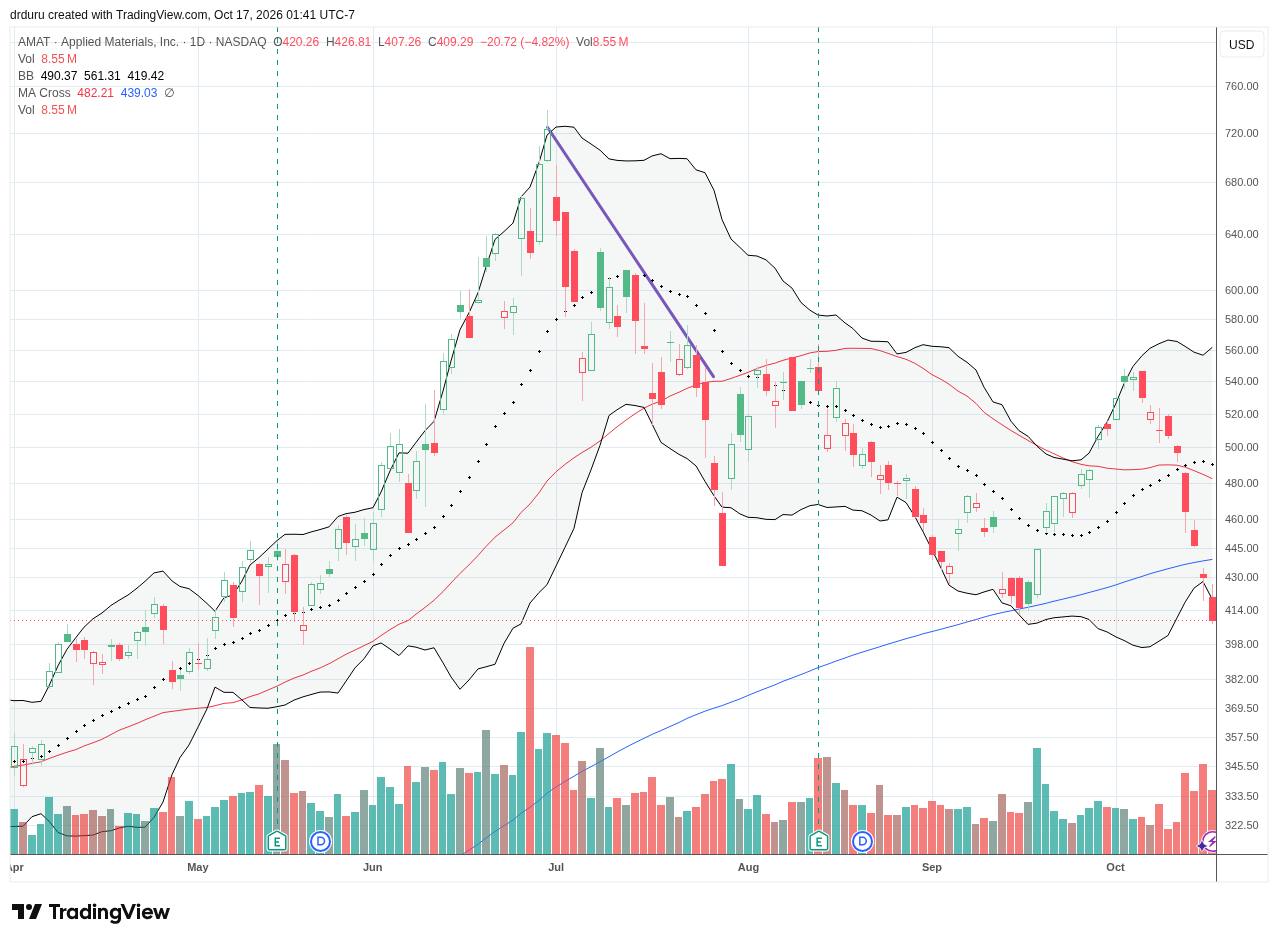
Applied Materials (AMAT)
Description: Applied Materials supplies semiconductor manufacturing equipment, services and materials-engineering technology to chipmakers and display manufacturers.
Technical Status: Applied Materials (AMAT) sliced through 50DMA and 200DMA support on its way to a 5-month low.
Trade Commentary: AMAT lost 19.3% for the week as semiconductor-equipment stocks were swept into the AI damage. The decline came even as Applied Materials unveiled its $5 billion EPIC Center on Monday October 12, a major semiconductor research and development investment explicitly aimed at accelerating AI-era chip innovation. My gains in AMAT are gone and then some thanks to this major reversal and breakdown. Given I want to hold AMAT over a longer horizon, I did not take profits as the stock teetered on 50DMA support the previous week, and I did not take a loss on the 200DMA breakdown. If AMAT falls below the previous all-time high at $395, then I will be forced to bail and live to trade another day.
Applied Optoelectronics (AAOI)
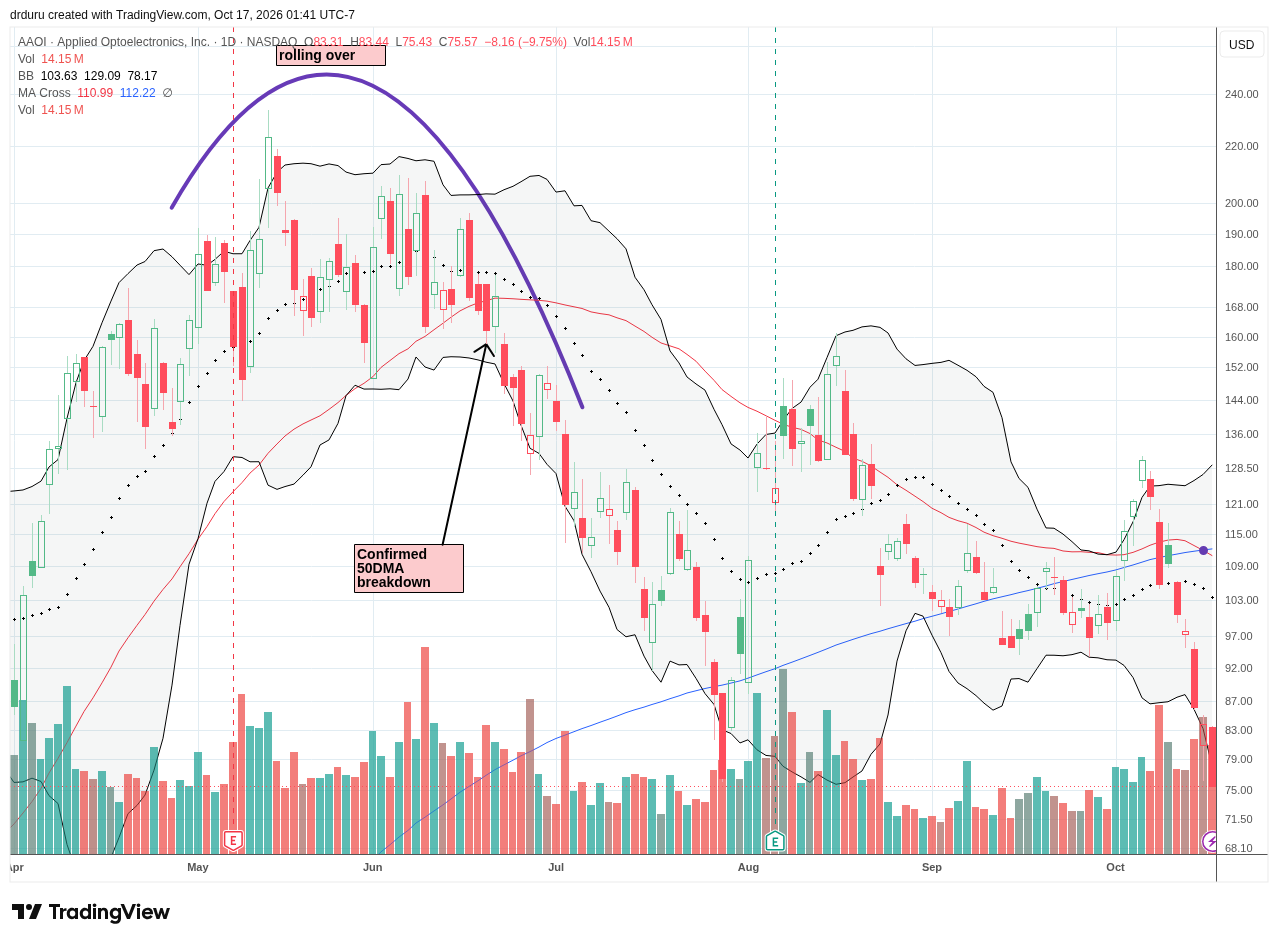
Description: Applied Optoelectronics designs and manufactures optical networking products, including lasers and transceivers, for data centers, broadband and telecommunications networks.
Technical Status: Applied Optoelectronics (AAOI) quickly reversed its early October breakout into a fake-out taking the stock to an 8-month low.
Trade Commentary: AAOI fell a whopping 31% for the week, one of the most damaged stocks in the universe of AI-related stocks that I track. Optical-networking stocks were likely hit as investors and traders questioned whether hyperscalers and other AI infrastructure customers could maintain the pace of spending that had driven expectations for high-speed connectivity demand. I bought AAOI earlier on its 50DMA breakout, but I made a timely exit after AAOI pulled back from its overextension about its upper Bollinger Band.
Hewlett Packard Enterprise (HPE)
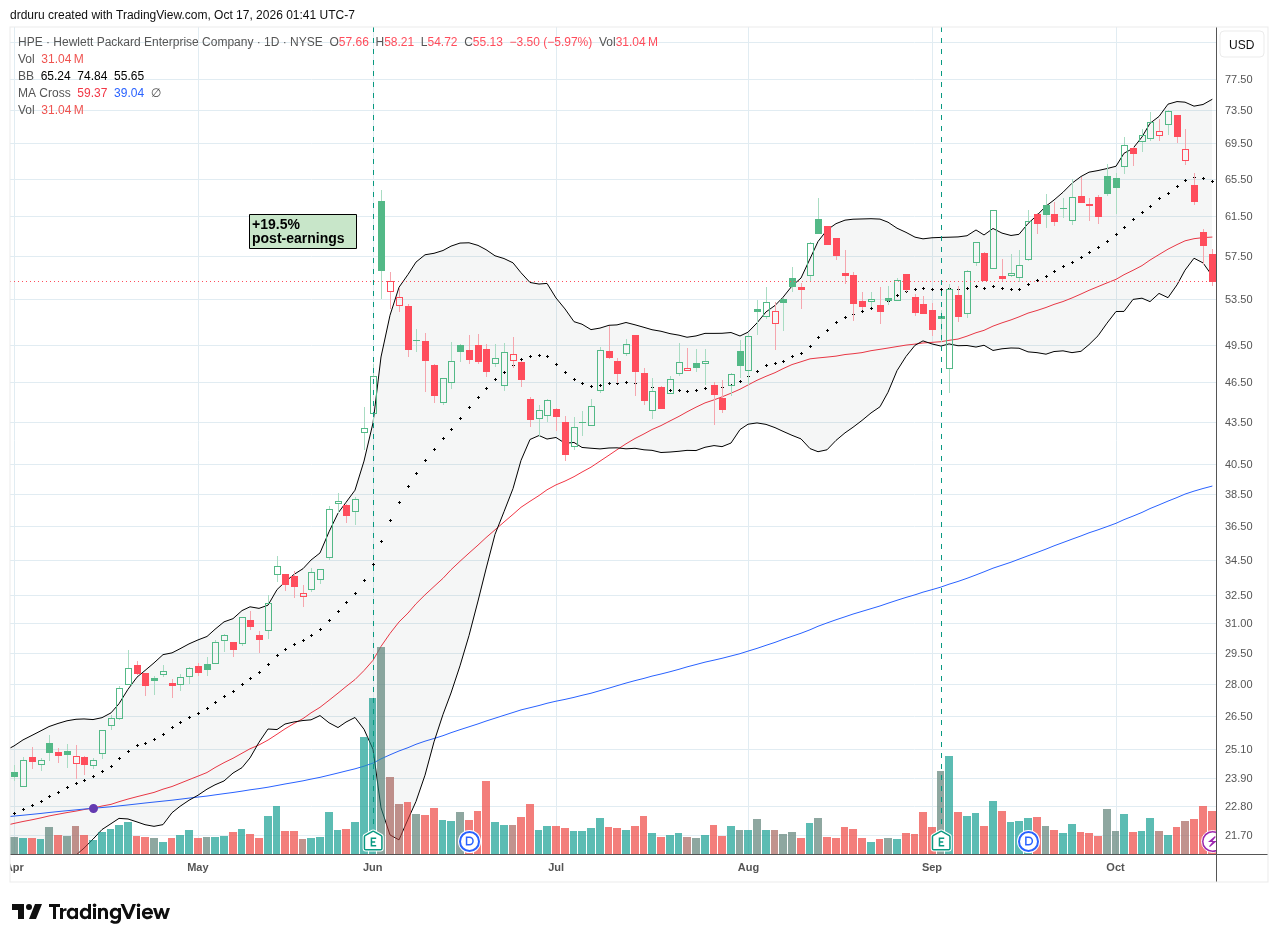
Description: Hewlett Packard Enterprise provides enterprise servers, storage, networking, hybrid-cloud infrastructure and related technology services.
Technical Status: Hewlett Packard Enterprise (HPE) lost 25.0% for the week and confirmed a 50DMA breakdown.
Trade Commentary: HPE fell 25% for the week and recorded its worst week as a publicly traded company. Barclays downgraded HPE alongside Dell and NetApp after questioning whether recent hardware revenue strength represented a meaningful acceleration in enterprise AI adoption or was being supported largely by higher memory prices. I jumped into an HPE put option soon after HPE gapped down on Friday. If the damage continues in the AI trade, HPE could rapidly fall to its post-earnings intraday low from last month.
iShares Expanded Tech-Software Sector ETF (IGV)
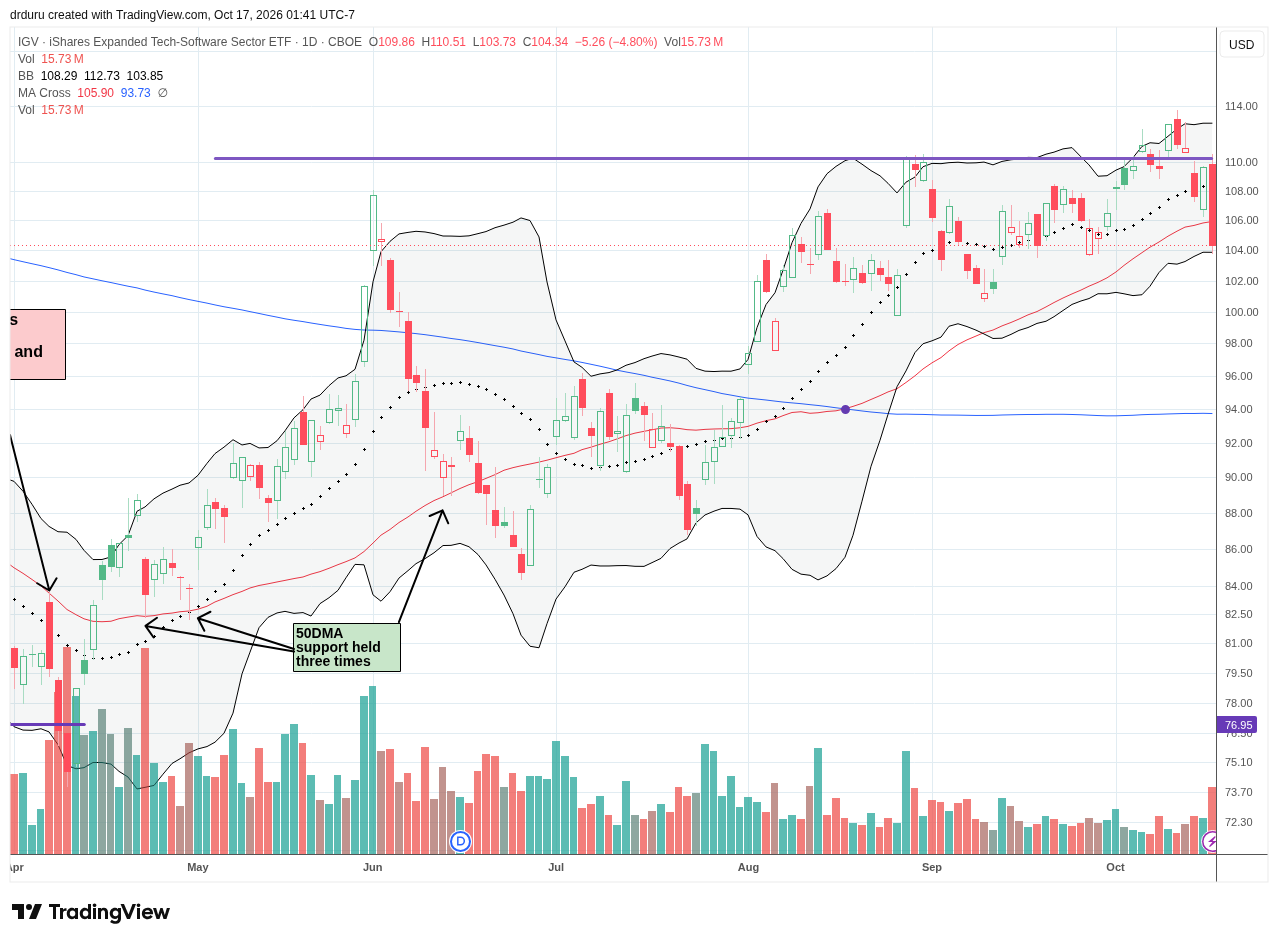
Description: The iShares Expanded Tech-Software Sector ETF tracks North American software companies along with select interactive media and services companies.
Technical Status: The iShares Expanded Tech-Software Sector ETF (IGV) lost 7.4% for the week, suffered a 50DMA breakdown, and left behind a false breakout to a high for the year.
Trade Commentary: Surprisingly, software did not benefit from the money fleeing from the damage in the AI trade. Friday’s 4.8% plunge was particularly damaging. Given the false breakout, I am assuming the software trade has topped out for the time being.
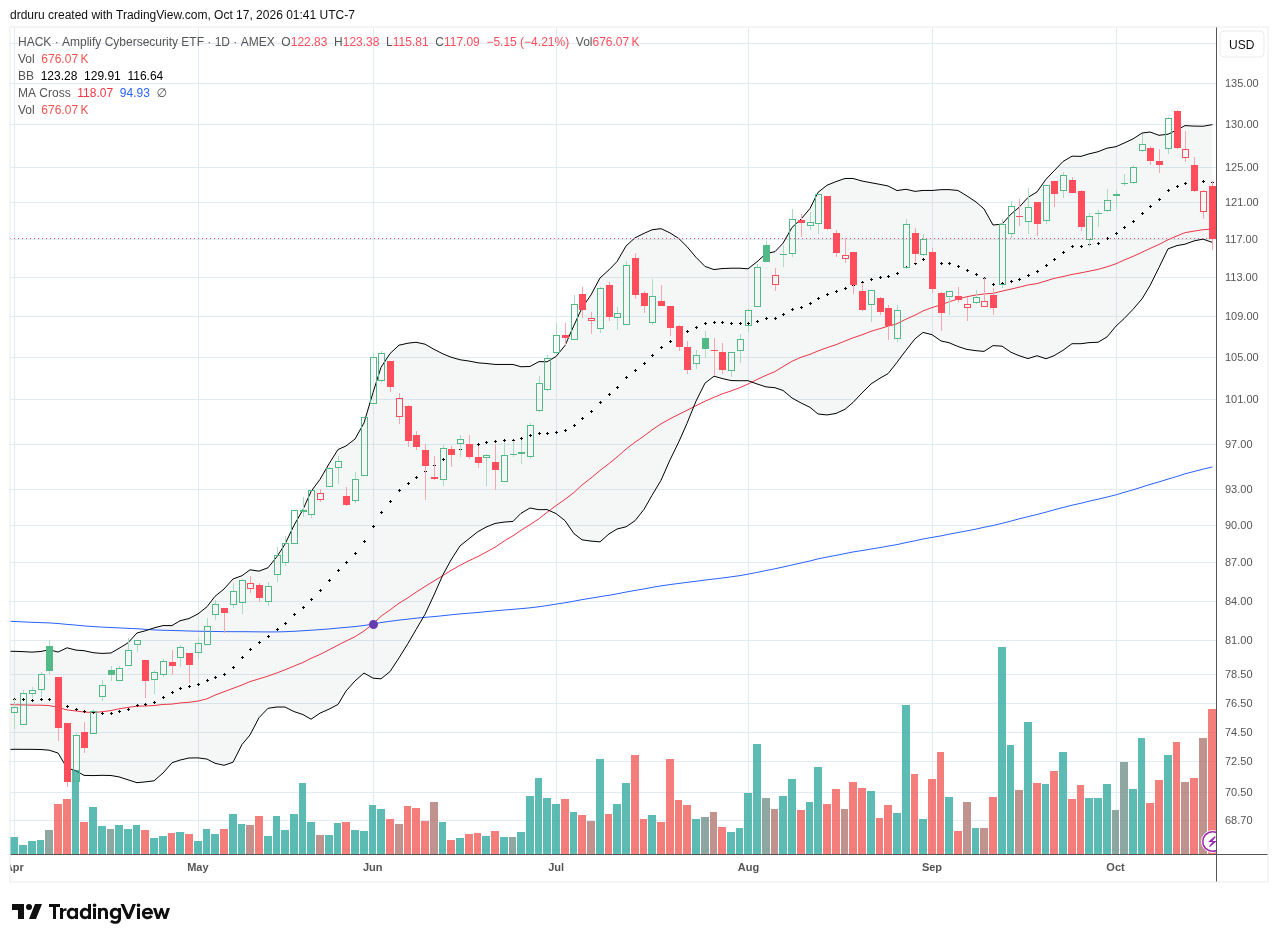
Amplify Cybersecurity ETF (HACK)
Description: The Amplify Cybersecurity ETF tracks companies that provide cybersecurity hardware, software and related security services.
Technical Status: Amplify Cybersecurity ETF (HACK) slipped below its 50DMA support on increasing selling volume.
Trade Commentary: HACK declined 10.5% for the week as cybersecurity stocks also failed to benefit from money fleeing the damage in the AI trade. I opened a fresh trade on HACK shares as the ETF fell to its 50DMA. My near-term profit target sits at $126 right under the launch point of HACK’s stretch above its upper Bollinger Band to an all-time high.
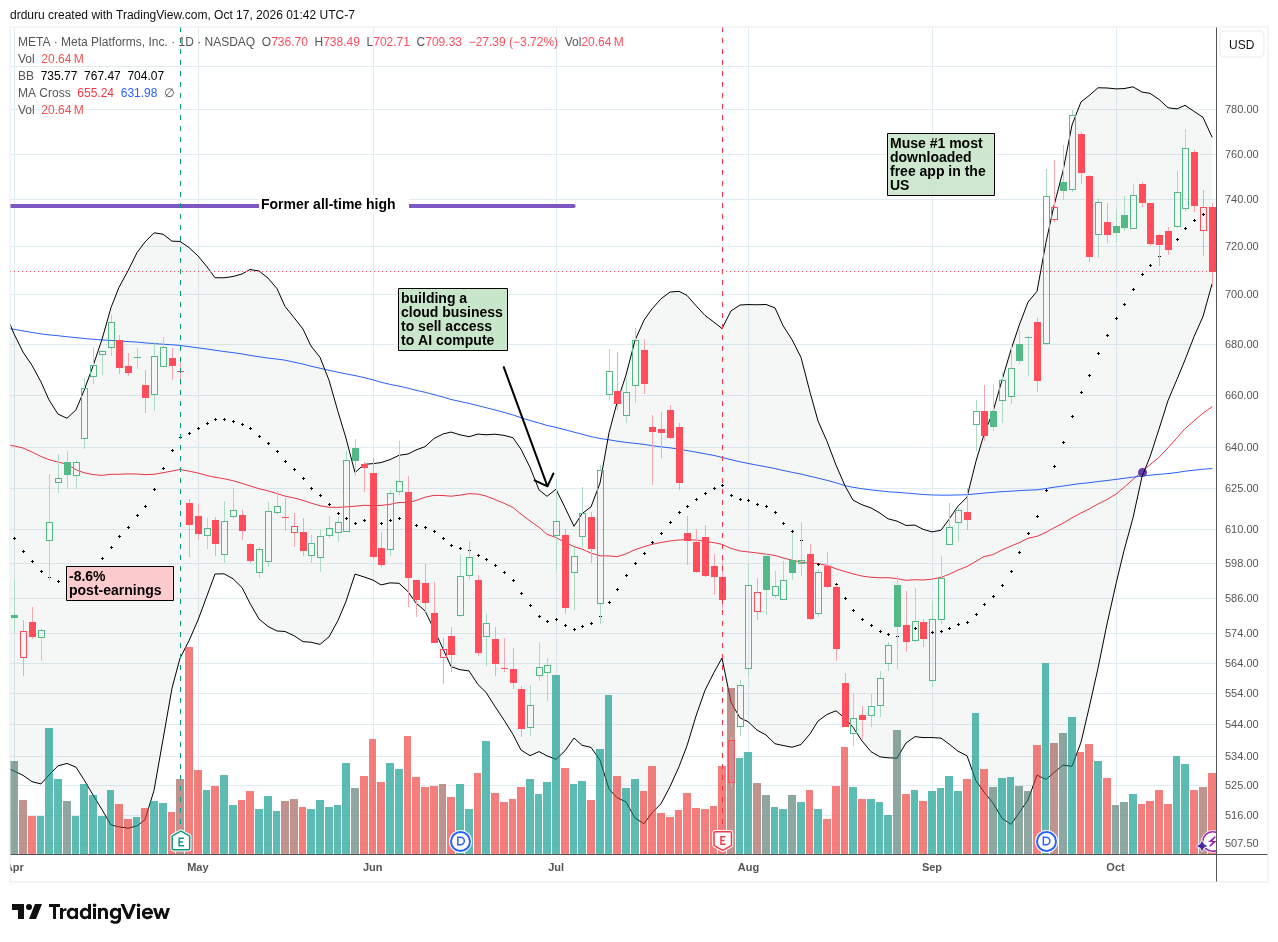
Meta Platforms (META)
Description: Meta Platforms operates Facebook, Instagram, WhatsApp and other digital platforms while developing advertising, artificial-intelligence and immersive-technology products.
Technical Status: Meta Platforms (META) lost its breakout to new all-time highs and now looks set to reverse its last Muse-driven surge.
Trade Commentary: META started the week strong after the company introduced its Muse Wonder and Muse Wonder Full agentic AI models on October 12. The subsequent fade from last month’s all-time high makes META look toppy all over again. Friday’s 3.7% decline and close below the uptrending 20DMA confirmed the technical signs of a top. I have META on my list this week to short as a hedge against any longs I take on in tech. I also remain skeptical that META will hold a lasting advantage with consumer-facing agentic tools.
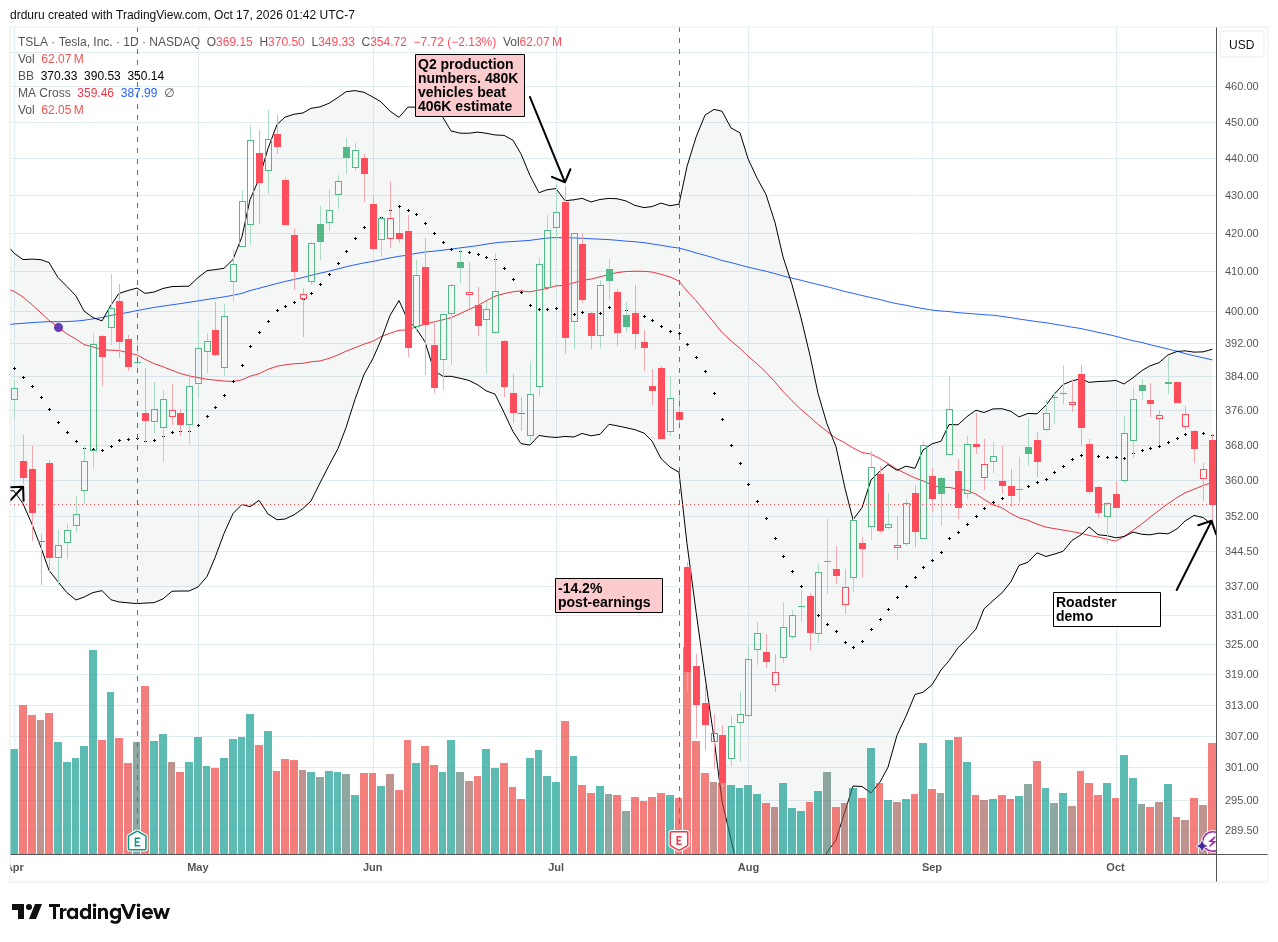
Tesla (TSLA)
Description: Tesla designs and sells electric vehicles, energy-storage systems and related charging, autonomy and robotics technologies.
Technical Status: Tesla (TSLA) suffered a sharp fade from 20DMA resistance and a 50DMA breakdown after initially gapping up in response to the company’s Roadster demo.
Trade Commentary: The Musk/Tesla hype machine ramped up in epic form on Friday with the big reveal of a “flying”, high-performance Roadster. The stock market responded positively gapping the stock higher and, for a moment, confirming 50DMA support. However, sellers immediately took over and sent TSLA into a fresh 50DMA breakdown. This move also confirms 200DMA resistance. For bears, TSLA is not a short until it closes below $346 where the stock perfectly bounced off 50DMA support last month. For bulls, TSLA is not a buy until it closes above 200DMA resistance.
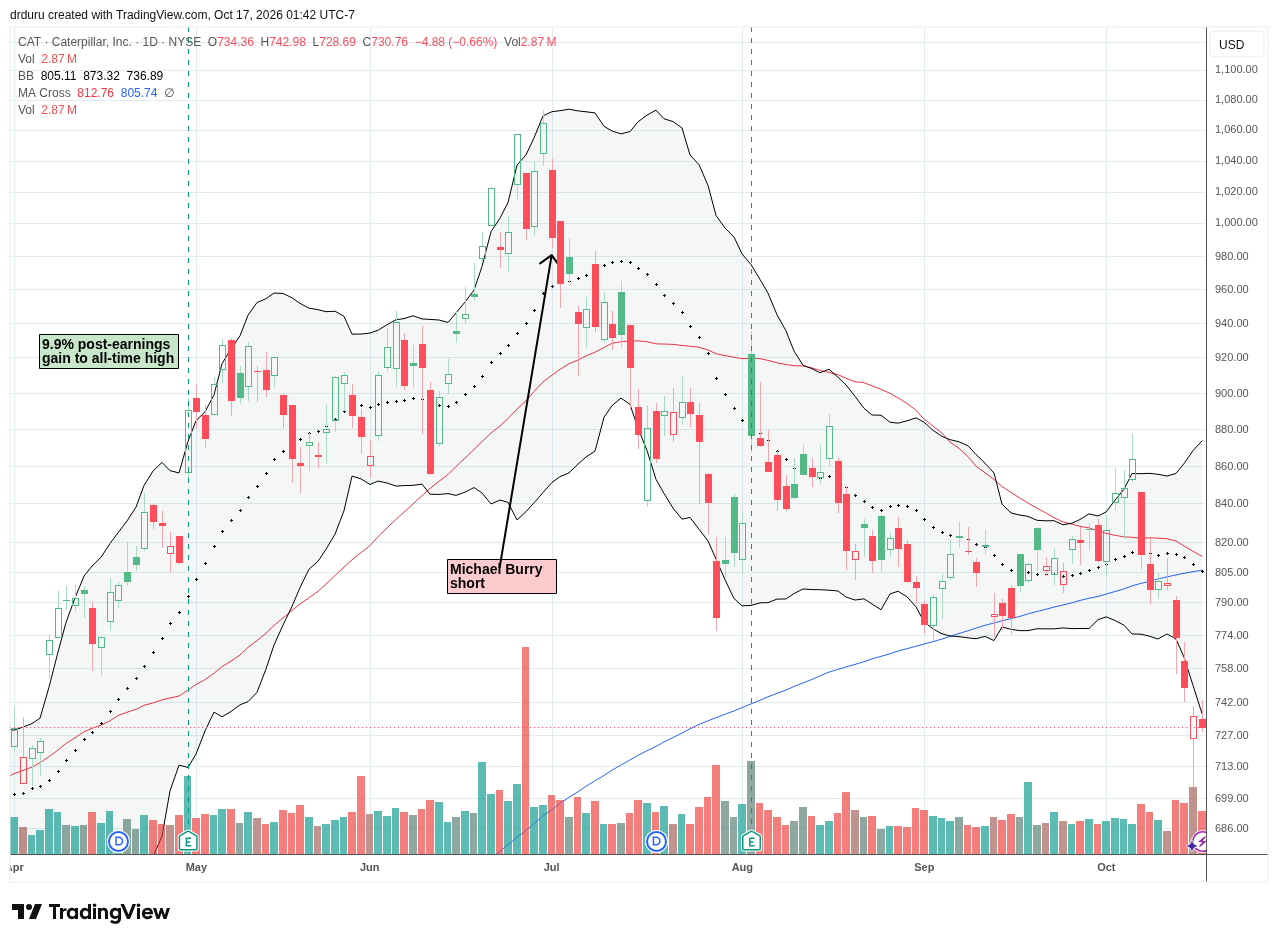
Caterpillar (CAT)
Description: Caterpillar manufactures construction and mining equipment, engines, industrial turbines and related power systems.
Technical Status: Caterpillar (CAT) suffered a bearish 200DMA breakdown and finished reversing its April breakout. A hammer candle sets up a potential end to the sharp selling.
Trade Commentary: Caterpillar has benefited from enthusiasm around the physical buildout required for data centers and power generation, making concerns over AI project financing a source of damage for CAT. My earlier optimism over CAT’s 50DMA breakout quickly deteriorated into disappointment. The stock is now in bearish territory with accelerated selling on the 200DMA breakdown. I stopped out of my shares at a loss on Tuesday’s decline. Thursday’s selling extended CAT well below its lower Bollinger Band and a bounce from the intraday low created a bottoming pattern. Friday’s reversal weakened the case for a bottom, but I am a buyer on a move above Friday’s intraday high of $743.
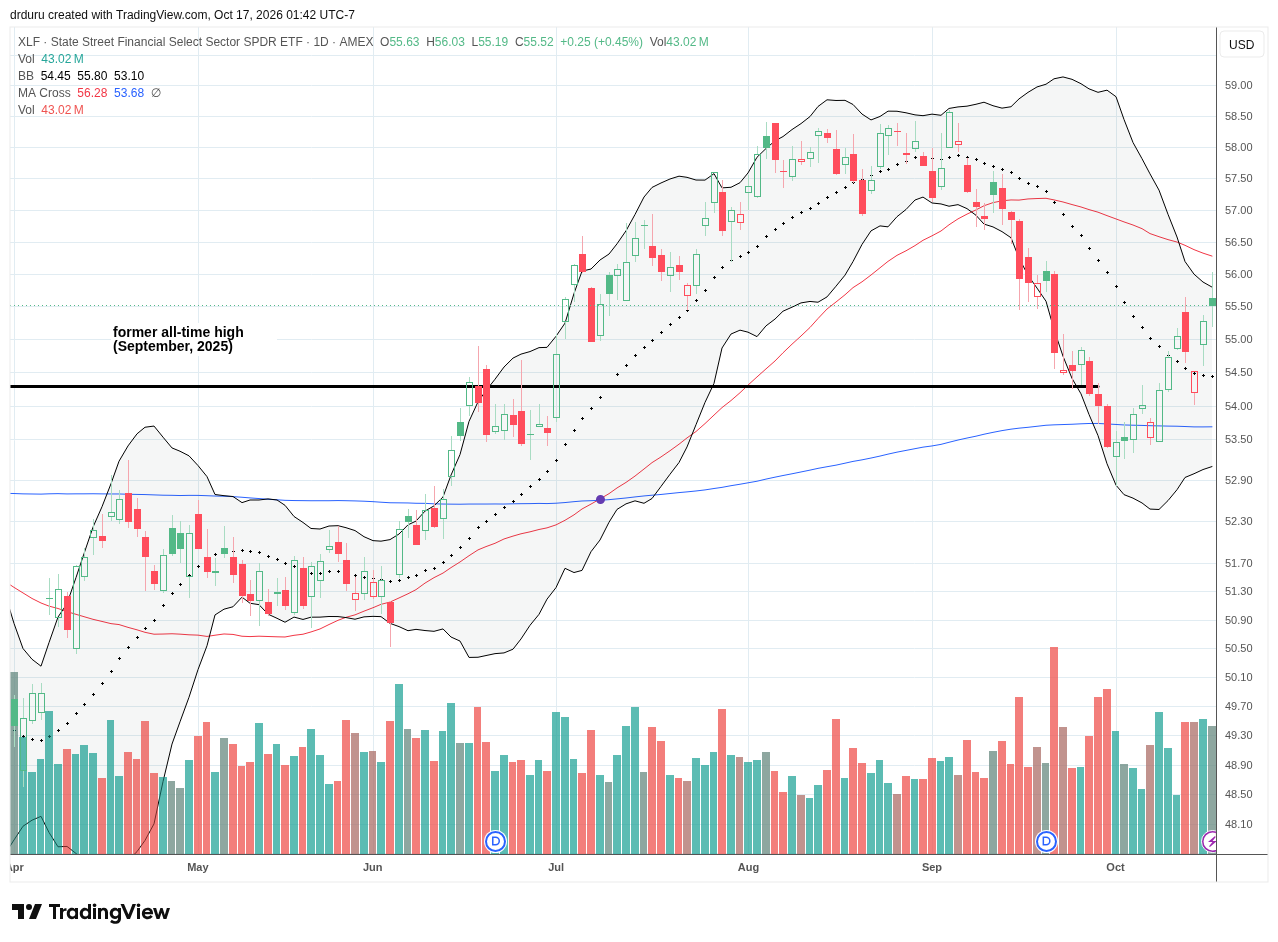
State Street Financial Select Sector SPDR ETF (XLF)
Description: The State Street Financial Select Sector SPDR ETF tracks large U.S. financial companies represented in the Financial Select Sector Index.
Technical Status: The State Street Financial Select Sector SPDR ETF (XLF) showed resilience for the week but stopped short of challenging 50DMA resistance.
Trade Commentary: It took some chop to get there, but the weakness in financials cleared the way for a relief rally toward 50DMA resistance. The recovery in financials stands in notable contrast to the decline in market breadth thanks to the damage in the AI trade.
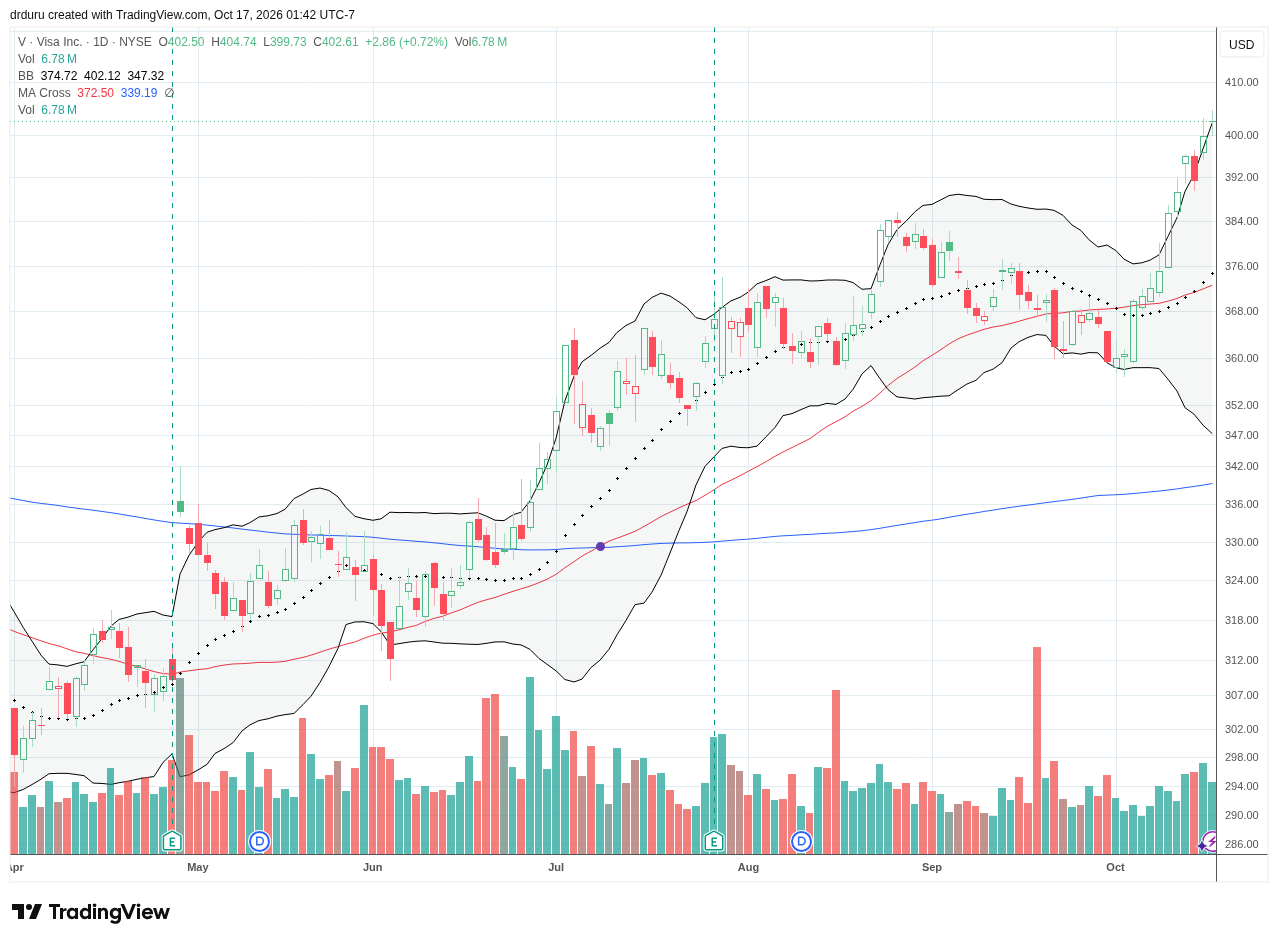
Visa (V)
Description: Visa operates a global electronic-payments network that facilitates transactions among consumers, merchants and financial institutions.
Technical Status: Visa (V) remains in an extended uptrend for the month of October, rising to successive all-time highs.
Trade Commentary: On October 13, Visa announced that the People’s Bank of China had approved its application to begin preparations for a domestic bankcard clearing business in China. The stock’s 1.7% gain in the wake of that news created fresh fuel for a relentless rally. V helped power XLF and provided a bullish counter to the damage in the AI trade.
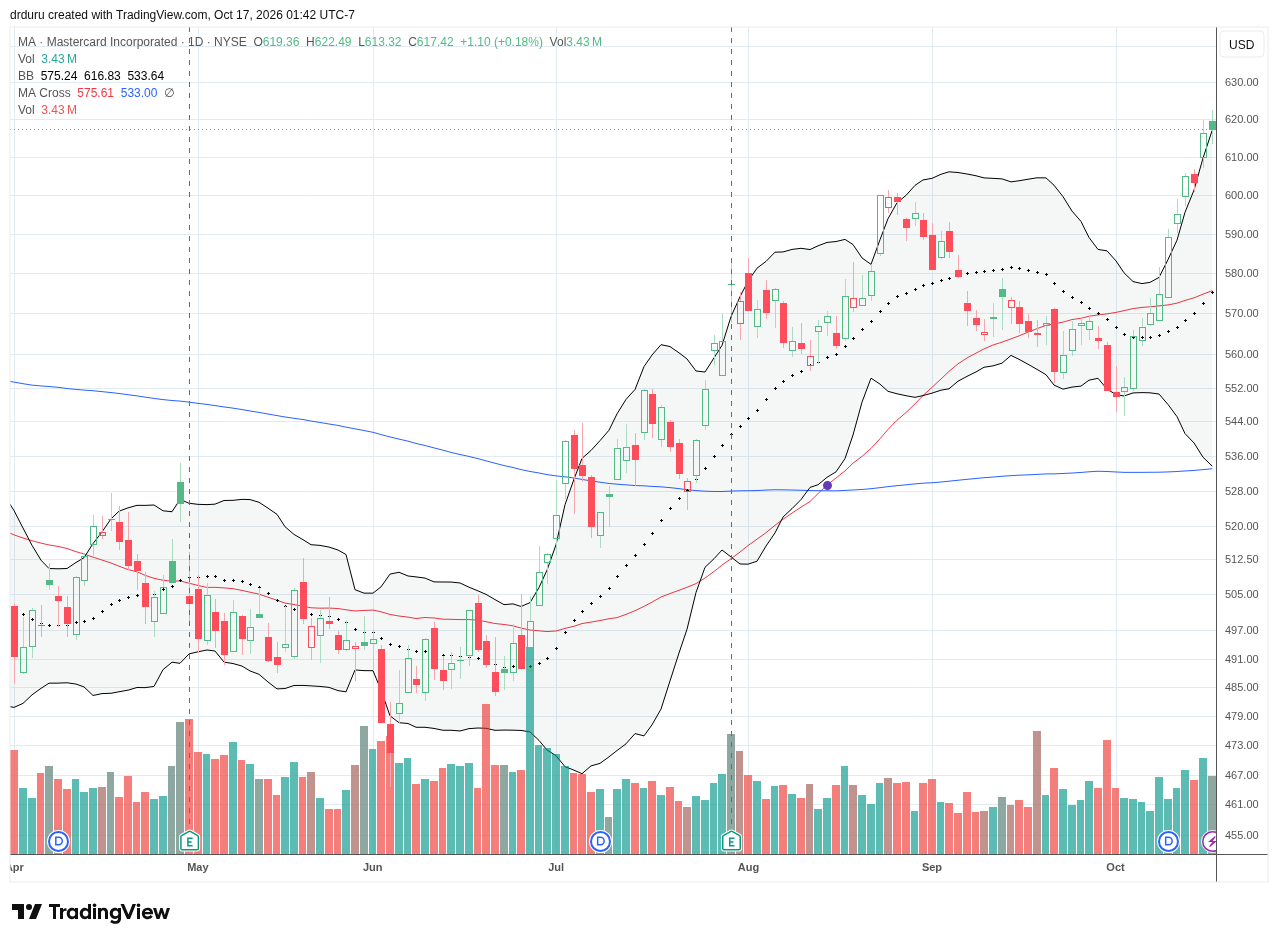
Mastercard (MA)
Description: Mastercard operates a global payments network that connects consumers, merchants, financial institutions and other participants in electronic commerce.
Technical Status: Like V, Mastercard (MA) has shot nearly straight up for the month of October to successive all-time highs.
Trade Commentary: Mastercard started the week announcing an Asia-Pacific fleet-payments partnership with WEX. Like V, MA streaked higher almost the entire week to new all-time highs. The rally in credit card stocks suggests investors are surprisingly confident in payments-related businesses and perhaps consumer spending more broadly.
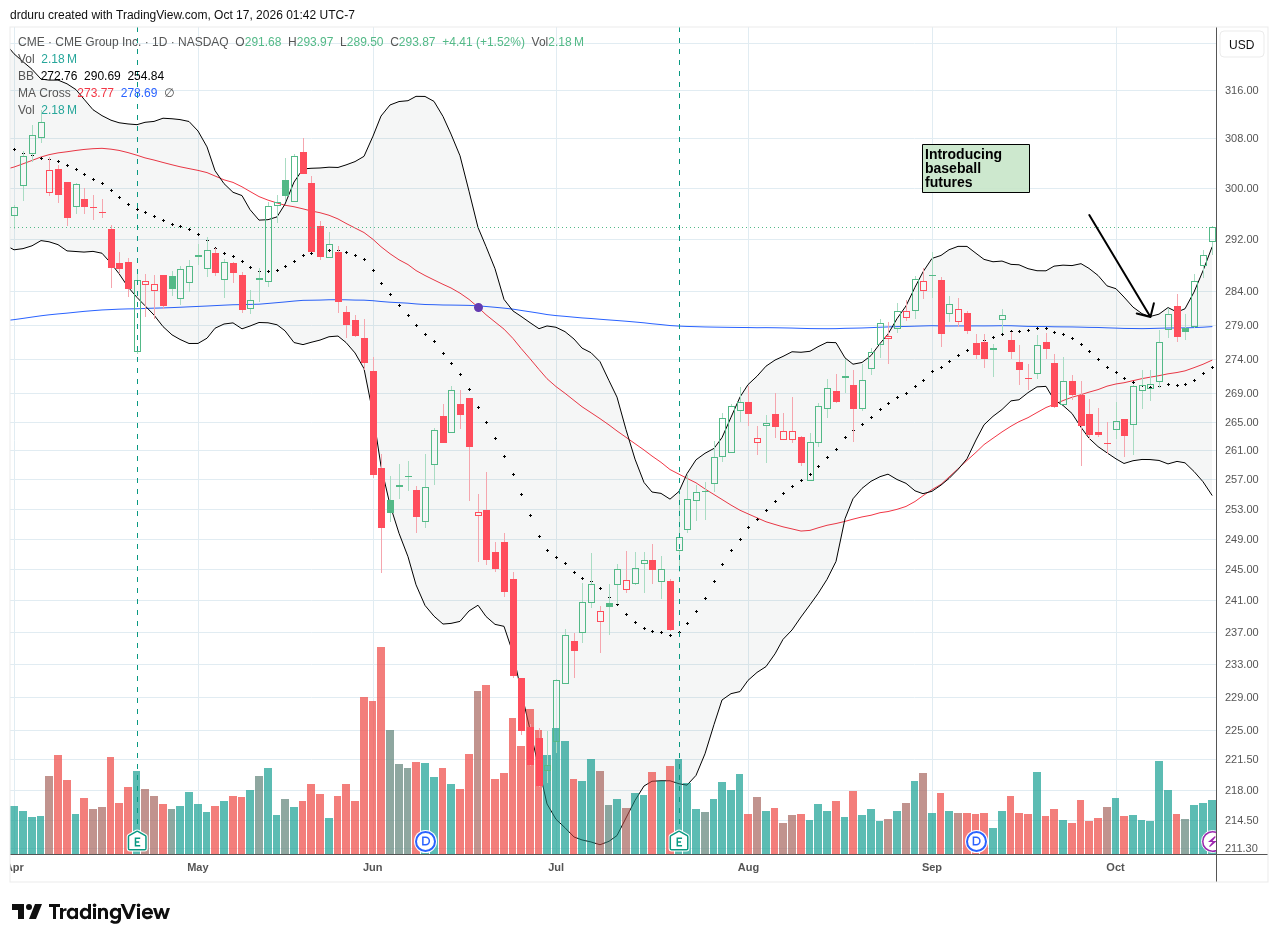
CME Group (CME)
Description: CME Group operates derivatives exchanges and clearing venues for futures and options across interest rates, equity indexes, foreign exchange, energy, agricultural products and metals.
Technical Status: CME Group (CME) confirmed a 200DMA breakout and rode its upper Bollinger Band to a 5-month high.
Trade Commentary: In July, I used weakness in CME to expand my position. The decision paid off quickly and now CME is back into bullish position with this confirmed 200DMA breakout.
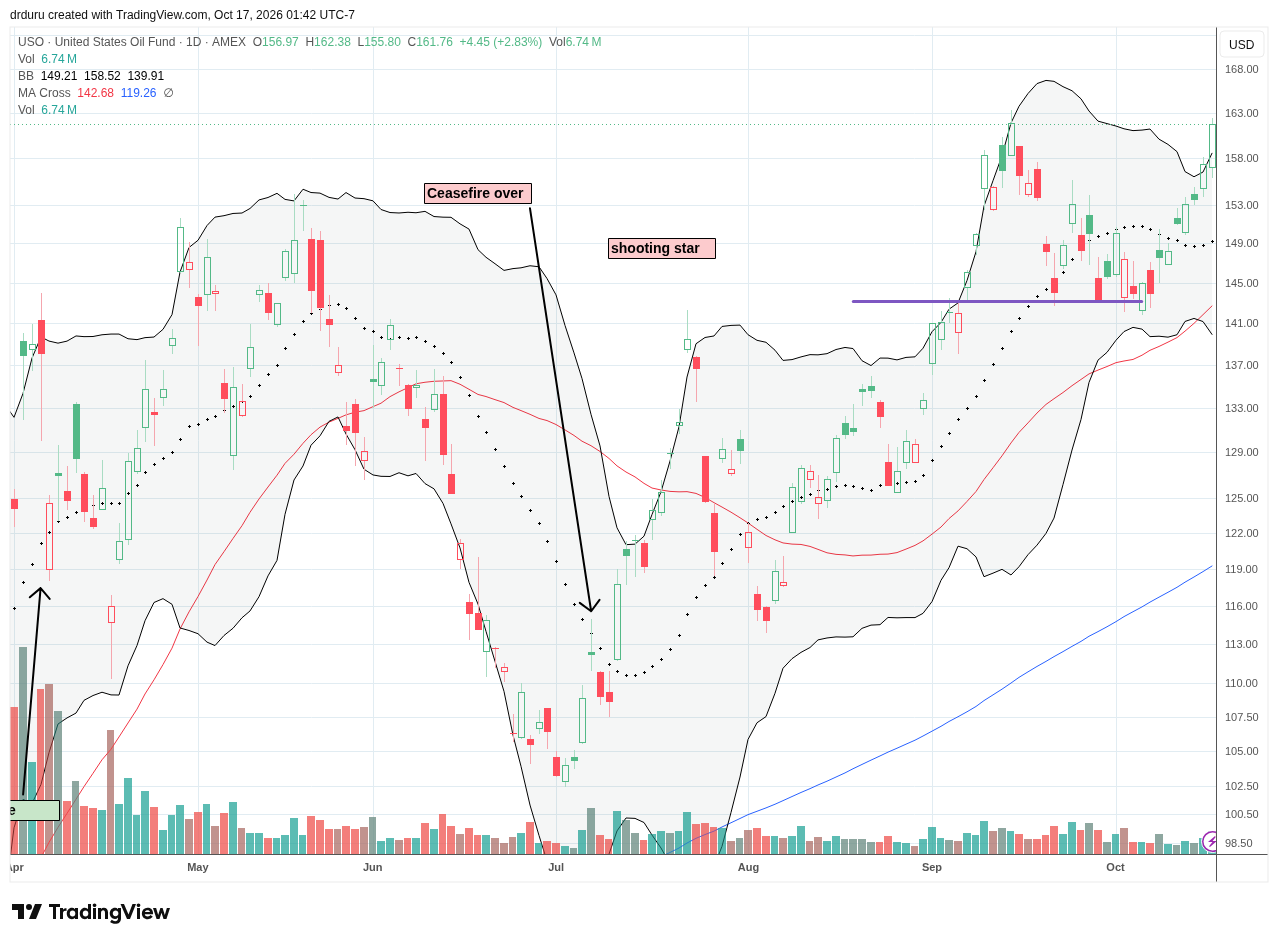
United States Oil Fund (USO)
Description: The United States Oil Fund is an exchange-traded commodity pool designed to reflect daily moves in light, sweet crude oil through benchmark futures contracts.
Technical Status: The United States Oil Fund (USO) surged for almost 2 weeks to an 11+ year high, closing well above its upper Bollinger Band.
Trade Commentary: I overplayed my hand with USO. I let profits on a put spread evaporate as I waited for a test of 50DMA support. The proxy for oil prices found support around $143. I should have closed the position after my position went back to flat the third time! Ever stubborn on my thesis for oil volatility, I opened a fresh put spread as USO extended above its upper Bollinger Band and matched September’s multi-year high.
Oil prices spiraled higher after increased attacks on shipping near the Strait of Hormuz, the interception of a missile headed toward Saudi Arabia’s Yanbu oil hub, and a Ukrainian strike that disrupted operations at Russia’s Ryazan refinery. An unexpectedly large 8.6-million-barrel decline in U.S. crude inventories also supported WTI. Oil remains a large wildcard to any trading thesis, bullish or bearish.
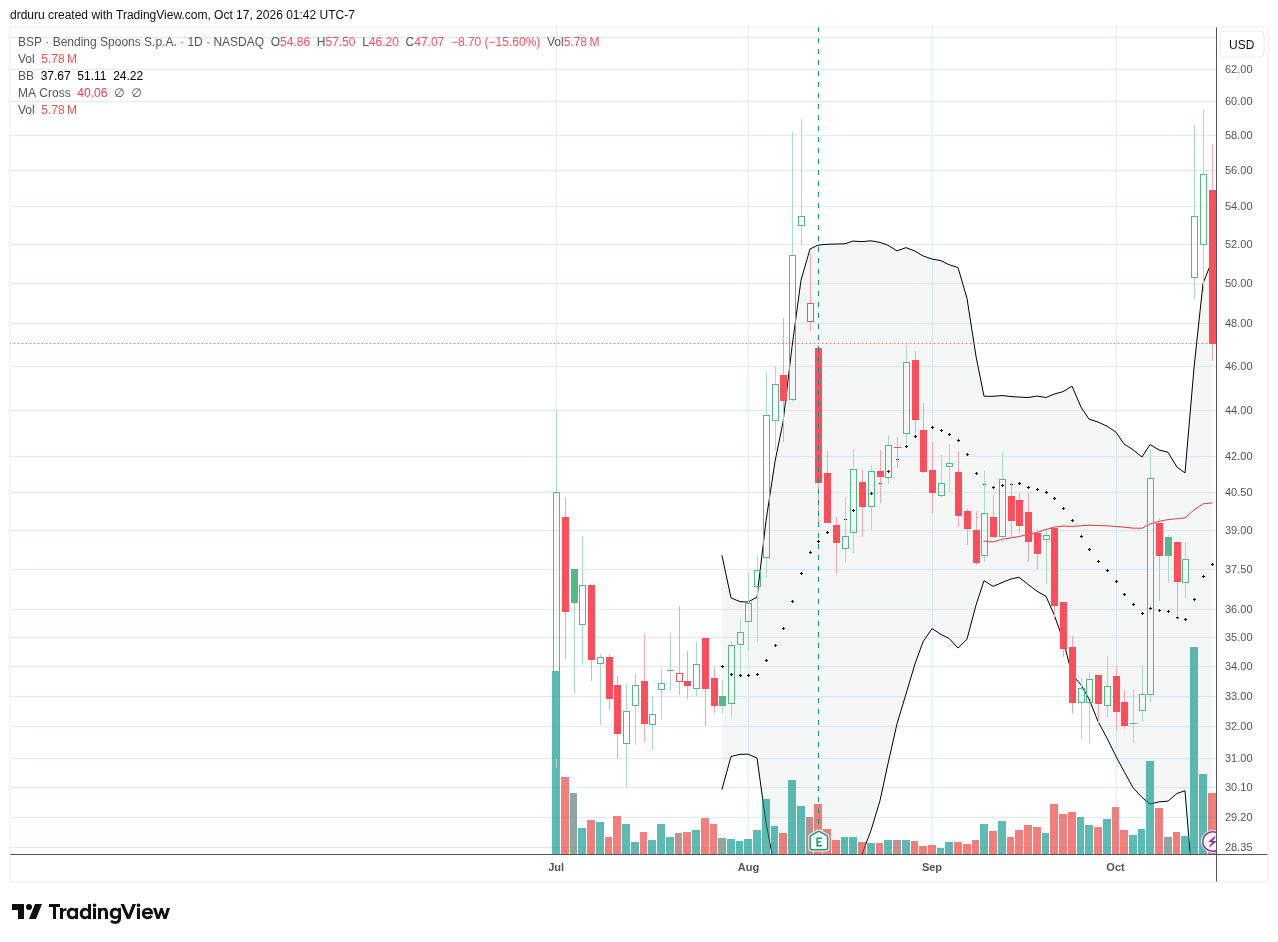
Bending Spoons (BSP)
Description: Bending Spoons is a technology company that acquires and operates digital businesses and subscription-based software products.
Technical Status: Bending Spoons (BSP) confirmed a double-top after plunging 15.6% on Friday as excitement over Berkshire’s investment starts to fade.
Trade Commentary: BSP surged after Bending Spoons announced on October 14 that Berkshire Hathaway would invest an additional $330 million through a private placement, increasing Berkshire’s ownership to 4%. For some reason, the stock surged 41.2% in response, including a fade from an intraday high that challenged the previous all-time intraday high. Buyers made a second attempt the next day. Fresh all-time intraday and closing highs came to naught after Friday’s reversal. While the stock looks topped out, I am keeping my eye out for a buy if the stock fills most of Wednesday’s gap higher.
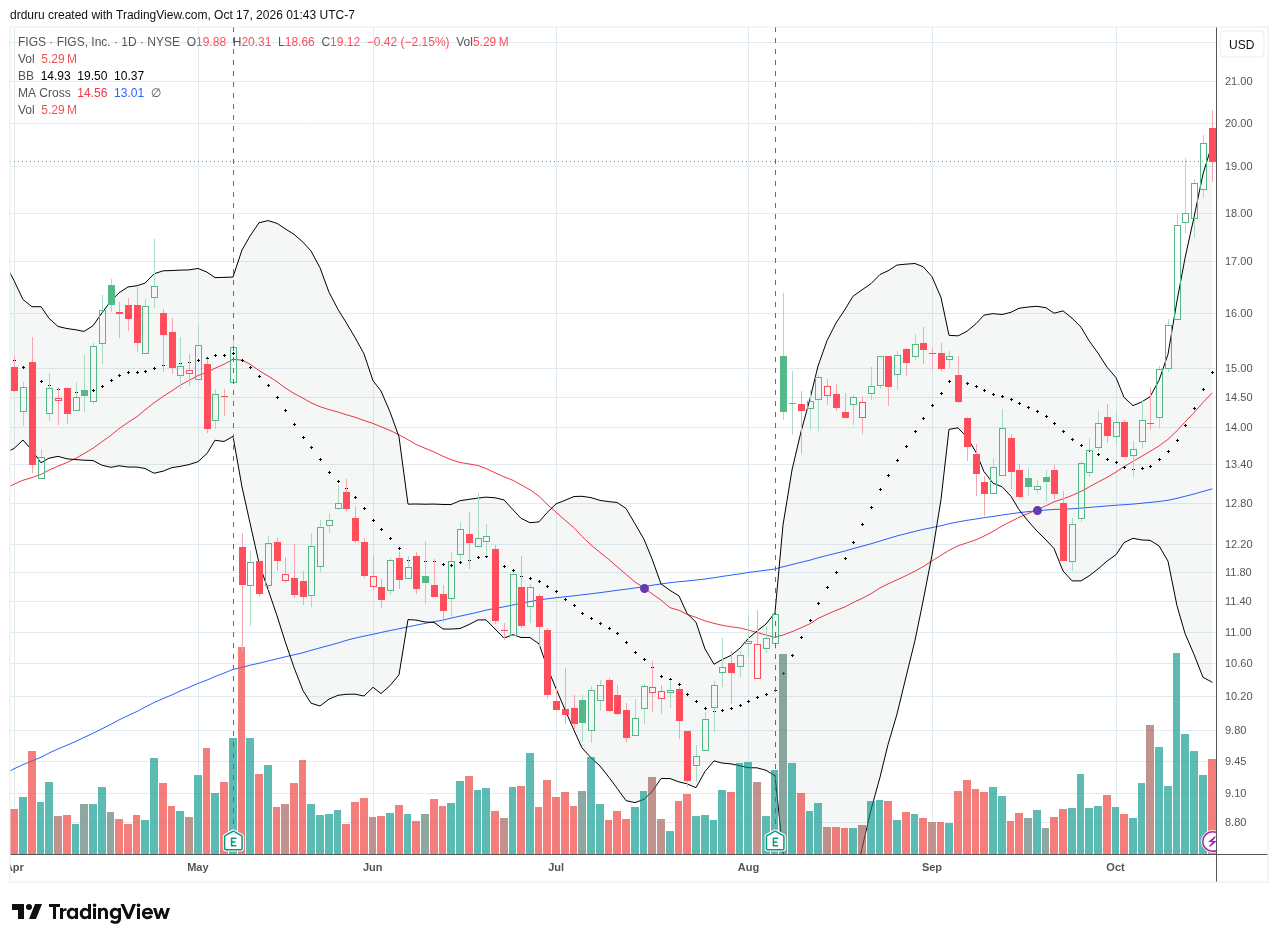
FIGS (FIGS)
Description: FIGS is a direct-to-consumer healthcare apparel and lifestyle company focused on scrubs and related products for healthcare professionals.
Technical Status: A strong October has taken Figs, Inc (FIGS) to a 4-1/2 year high.
Trade Commentary: I took profit in my FIGS position as it streaked above its upper Bollinger Band. Without any known news catalyst, I did not want to put the profit at risk in the middle of an upper Bollinger Band walk that could fall apart at any time, for any reason. I laid out the case in August, and the stock pulled back as I had hoped and provided a good risk/reward entry.
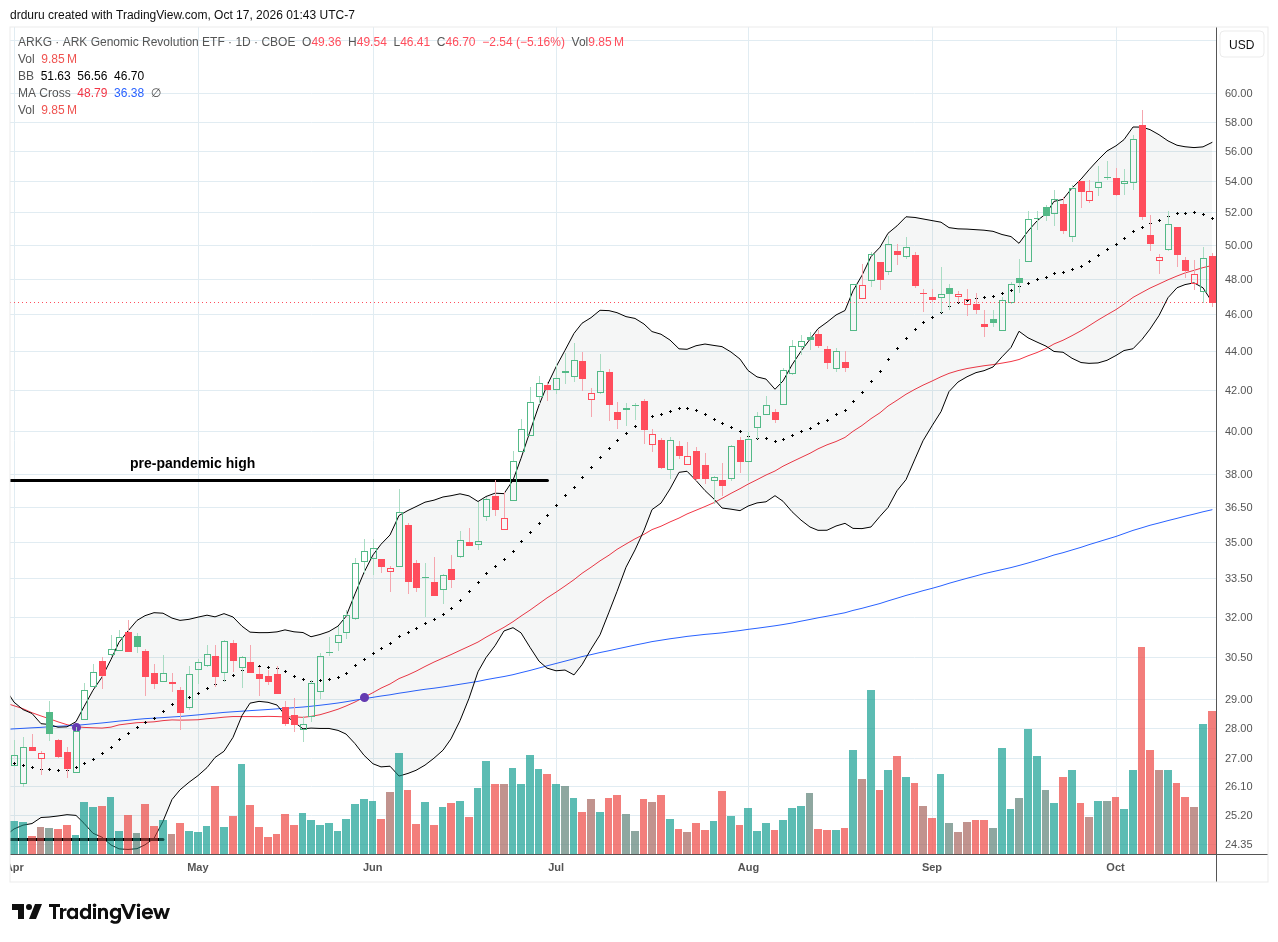
ARK Genomic Revolution ETF (ARKG)
Description: The ARK Genomic Revolution ETF is an actively managed ETF investing in companies tied to genomics, gene editing, molecular diagnostics and related healthcare technologies.
Technical Status: The ARK Genomic Revolution ETF (ARKG) confirmed a 50DMA breakdown and ended a primary uptrend in place since April’s breakout.
Trade Commentary: ARKG printed a bearish engulfing topping pattern at the beginning of October. The 8.8% plunge was swiftly followed by a 20DMA breakdown and then a 50DMA breakdown which confirmed the top. I am looking to short ARKG this coming week with a tight stop above $50. A close above $50 would end the breakdown and restore the uptrend defined by the 50DMA.
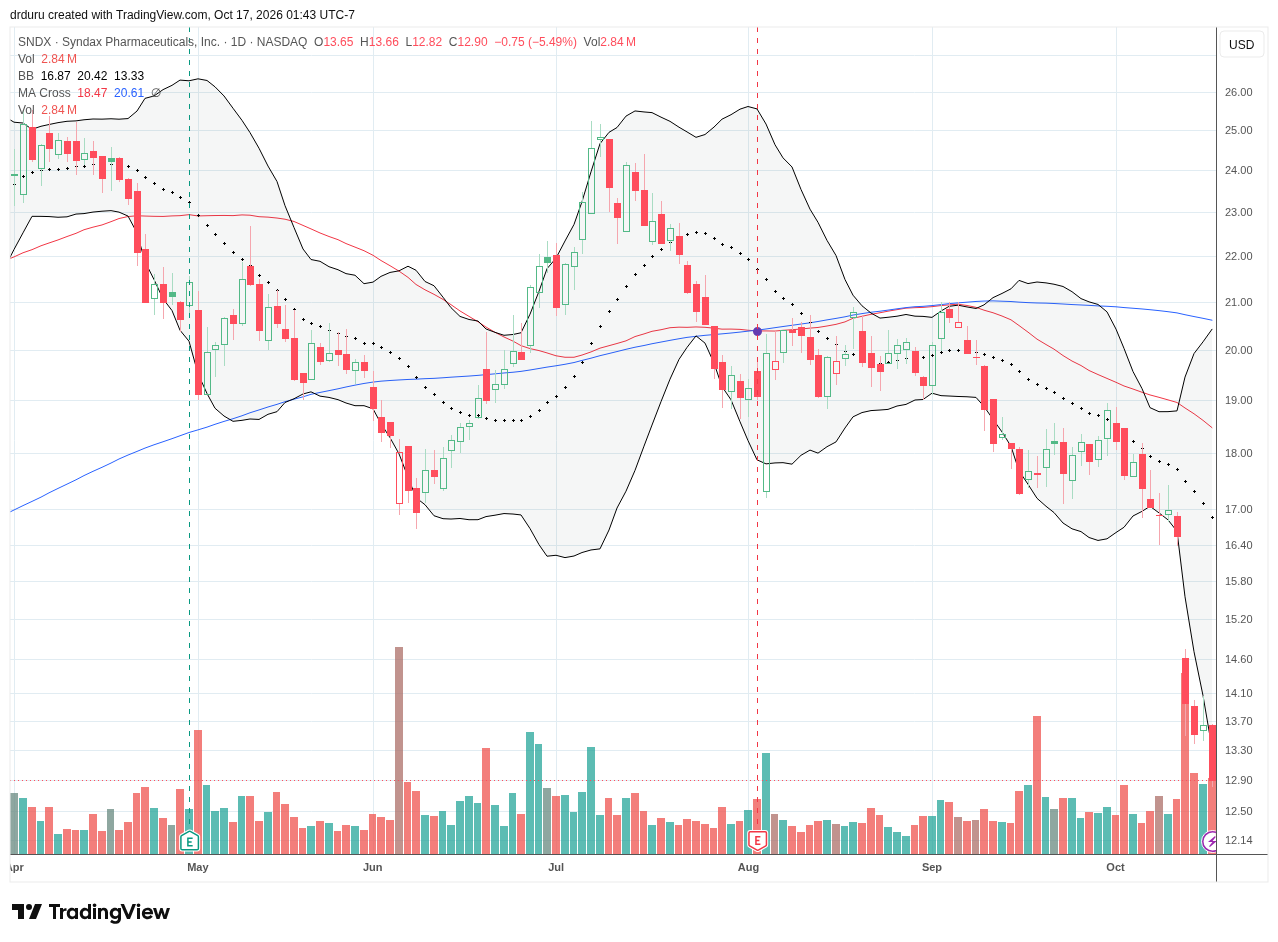
Syndax Pharmaceuticals (SNDX)
Description: Syndax Pharmaceuticals is a commercial-stage biopharmaceutical company developing and commercializing therapies for cancer and related diseases.
Technical Status: Syndax Pharmaceuticals (SNDX) has lost nearly 50% since summer’s peak and now sits at a 14-month low.
Trade Commentary: SNDX plunged 24% last week after reporting that its Phase 2 MAXPIRe trial of axatilimab in idiopathic pulmonary fibrosis did not meet its primary endpoint. Syndax said it would not continue development of axatilimab in IPF, although the result does not affect ongoing trials in other indications. This breakdown is quite a turnaround from the promising setup at the end of last year following significant insider buying. Now the stock has roundtripped to a 14-month low. I am looking to buy back into the stock after some signs of stabilization.
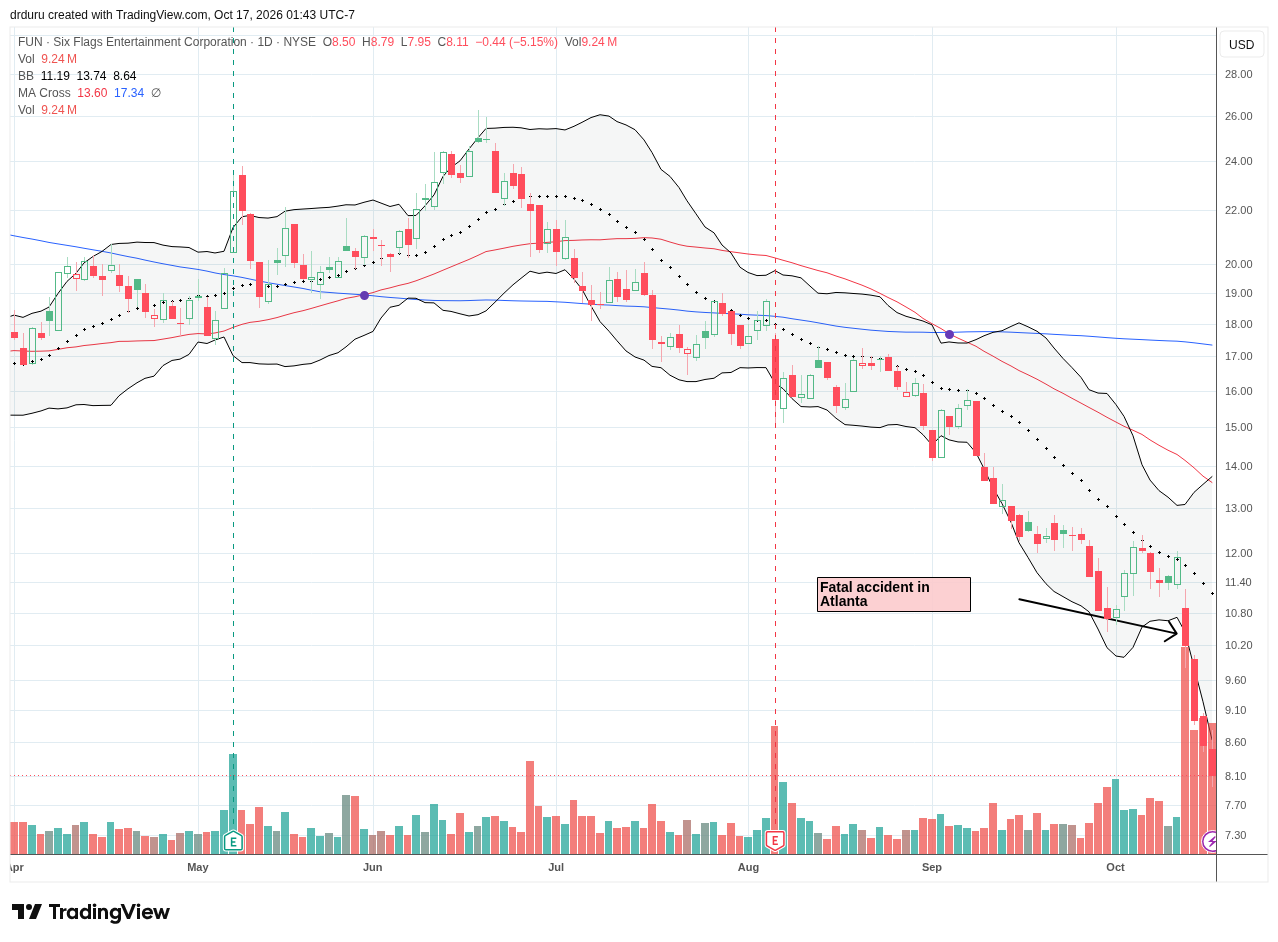
Six Flags Entertainment (FUN)
Description: Six Flags Entertainment operates amusement parks, water parks and resort properties across North America.
Technical Status: Six Flags Entertainment (FUN) lost 14.4% in the wake of a fatal accident in Atlanta. Continued selling has taken the stock to a 17-year low.
Trade Commentary: Tragedy struck Six Flags Entertainment on October 12 after a man fell to his death from a roller coaster in Atlanta. The company temporarily closed several similar roller coasters at other parks while the incident was investigated. FUN fell 14.4% on the news and ended the week down 29%. I made the case almost a year ago to bottom-fish in FUN. I took profits on the position after the stock stalled over the summer. The stock dropped from my watchlist soon after, and I cannot make a case to bottom-fish again.
Footnotes
Subscribe for free to get email notifications of future posts!
“Above the 50” (AT50) uses the percentage of stocks trading above their respective 50-day moving averages (DMAs) to measure breadth in the stock market. Breadth defines the distribution of participation in a rally or sell-off. As a result, AT50 identifies extremes in market sentiment that are likely to reverse. Above the 50 is my alternative name for “MMFI” which is a symbol TradingView.com and other chart vendors use for this breadth indicator. Learn more about AT50 on my Market Breadth Resource Page. AT200, or MMTH, measures the percentage of stocks trading above their respective 200DMAs.
Active AT50 (MMFI) periods: Day #311 over 20% (overperiod), Day #1 under 30% (underperiod), Day #27 under 40%, Day #28 under 50%, Day #44 under 60%, Day #284 under 70%
Source for charts unless otherwise noted: TradingView.com
Full disclosure: long SPY, long CBRS, long AMAT, long HPE put option, long IGV, long HACK, long CME, long USO put spread
FOLLOW Dr. Duru’s commentary on financial markets via StockTwits, BlueSky, and even Instagram!
*Charting notes: Stock prices are not adjusted for dividends. Candlestick charts use hollow bodies: open candles indicate a close higher than the open, filled candles indicate an open higher than the close.
* Blog notes: I use ChatGPT to help with editing and news discovery.