The Stock Market Fights Through Concerning Signals – Above the 40 (September 25, 2019)
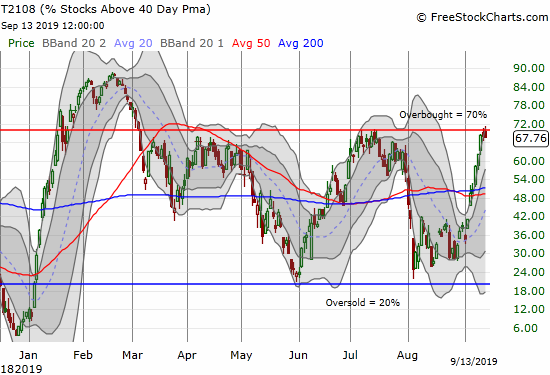
AT40 = 68.9% of stocks are trading above their respective 40-day moving averages (DMAs)AT200 = 55.6% of stocks are trading above their respective 200DMAsVIX = 16.0Short-term Trading Call: neutral Stock Market Commentary One More Risk to Ignore An impeachment inquiry, an “admission”, and fresh promises from President Trump about getting a trade deal done with … Read more