
AT40 = 68.9% of stocks are trading above their respective 40-day moving averages (DMAs)
AT200 = 55.6% of stocks are trading above their respective 200DMAs
VIX = 16.0
Short-term Trading Call: neutral
Stock Market Commentary
One More Risk to Ignore
An impeachment inquiry, an “admission”, and fresh promises from President Trump about getting a trade deal done with China. That was the neat and tidy summary offered by outlets like Nightly Business Report to explain the topsy-turvy trading day of selling and buying.
I think it is even easier to just say the market suffered yet another trigger reaction to new risks and once again showed a ready resilience to interpret any sliver of positivity as reason enough to ignore risk. The script of promising good outcomes from the Trade War has provided an amazingly consistent salve that never seems to wear thin.
From 0 to 60
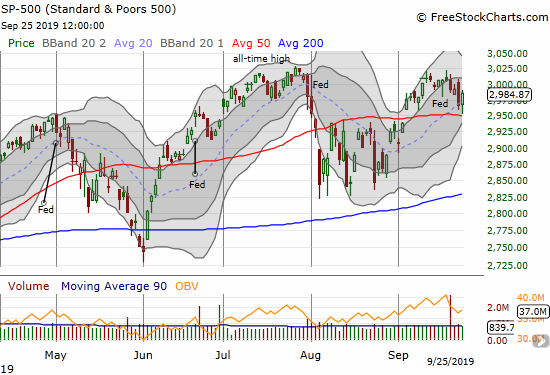
Wednesday’s trading day opened with me in a cautious and wary mood after noting a convergence of concerning signals on Monday. The market delivered with a seemingly confirming Tuesday sell-off. With AT40 (T2108), the percentage of stocks trading above their respective 40-day moving averages (DMAs), closing Tuesday right at my bearish threshold of 65%, I came into Wednesday with puts in hand and more puts on the shopping list. However, once the S&P 500 quickly tested its 50DMA support, I quickly decided to take bearish profits. I even did some buying (see stock charts below). The day ended with a flourish of buying that created some important technical feats.
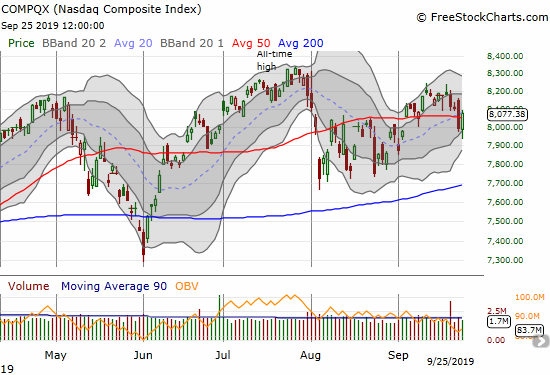
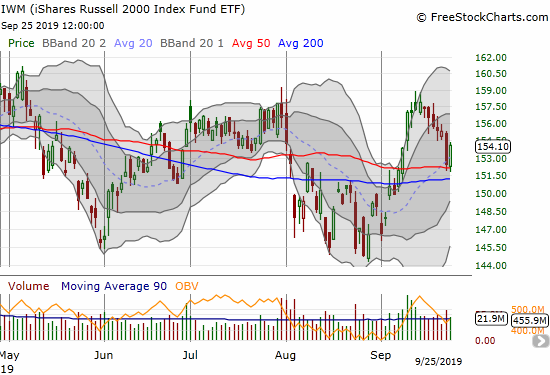
The S&P 500 successfully tested 50DMA support. The NASDAQ recovered from its 50DMA breakdown. Perhaps most importantly, iShares Russell 2000 Index Fund ETF (IWM) definitively bounced off its 50DMA support.
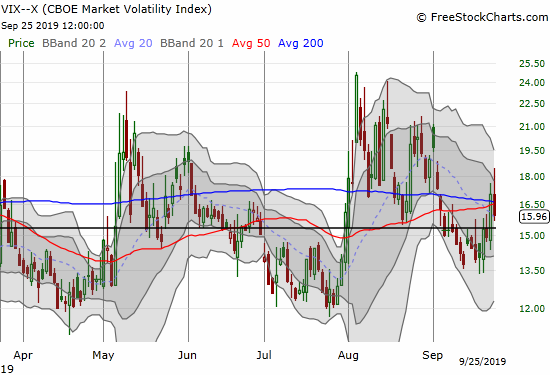
I might have been encouraged to treat these moves from 0 to 60 as bullish signs EXCEPT 1) the volatility index (VIX) still closed above its 15.35 pivot, and, 2) most importantly, the Australian dollar vs the Japanese yen (AUD/JPY) completely failed to confirm the rush of (re)optimism in the stock market. I am left with residual concerns over an unfolding bearish divergence (read “Why the Australian Dollar and Japanese Yen Matter for Stock Traders” for an explanation for why AUD/JPY matters for traders).
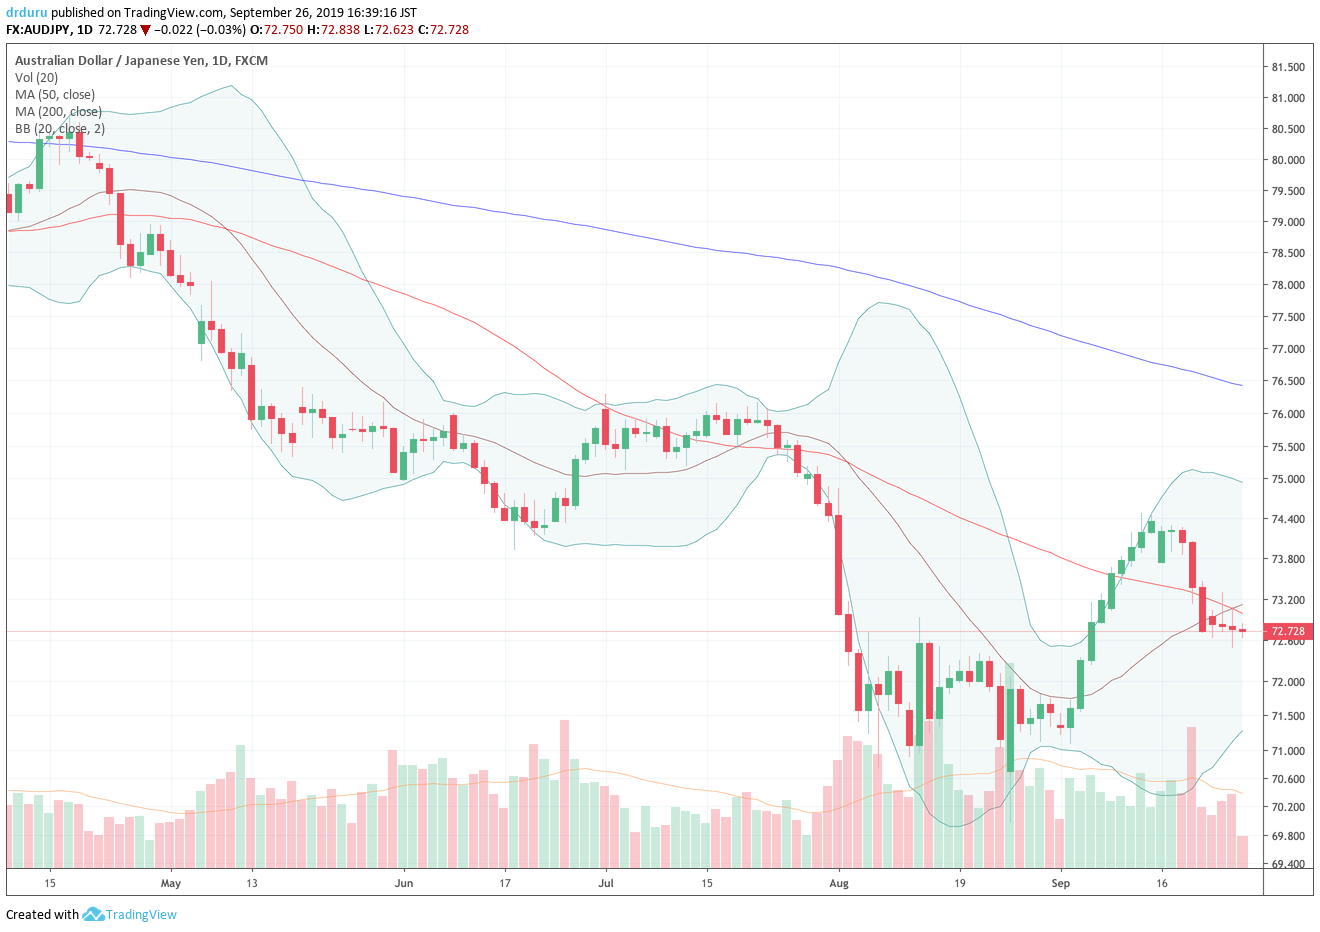
My short-term trading call remains comfortably at neutral as I continue to wait for a definitive bearish signal. With the major indices all trading above their 50DMAs again, I can be a lot more confident about being bearish once the market pulls back enough to send AT40 below 65%. In other words, the next 50DMA breakdowns should be a lot more meaningful than the NASDAQ’s 50DMA breakdown on Tuesday.
Stock Chart Reviews – Bearish
Facebook (FB)
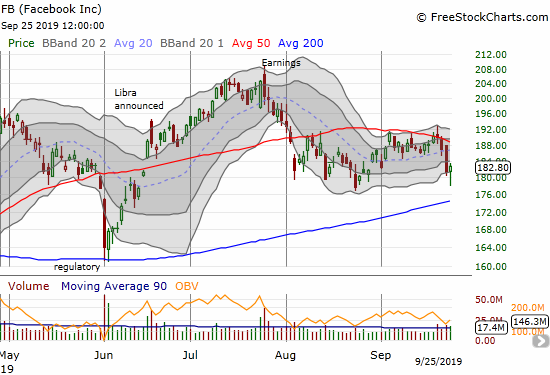
I gave Facebook (FB) too much credit for last week’s marginal 50DMA breakout. On Monday, FB closed below its 50DMA and confirmed resistance on a big one-day loss on Tuesday. I should have known better because FB has been in “fade mode” ever since sellers pounced on the stock’s initial post-earnings pop in July.
I used Wednesday’s drop below the lower Bollinger Band (BB) to buy a calendar put spread with the short side expiring this week and the long side set at the monthly October expiration. My target now is an eventual test of 200DMA support; a “worst case” scenario is a test of the June low.
Splunk (SPLK)
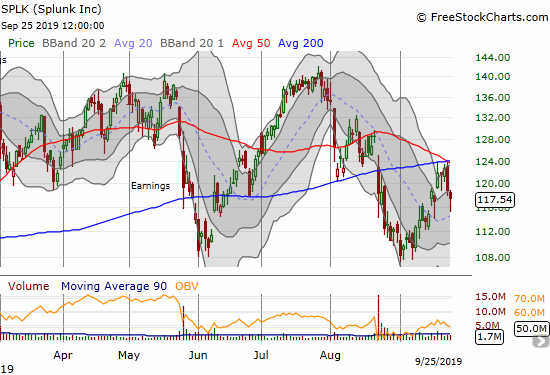
Splunk (SPLK) printed a picture-perfect test of its May/June lows before launching a slow and steady grind higher. That relief rally came to a screeching halt at converged 50/200DMA resistance. SPLK was slow to react to Tuesday’s selling so I got a chance to buy put options to play against resistance. I took profits into Wednesday’s follow-on selling. With the confirmed resistance, SPLK is now in the bearish column until it manages a breakout above converged resistance.
Stock Chart Reviews – Bullish
Intel (INTC)
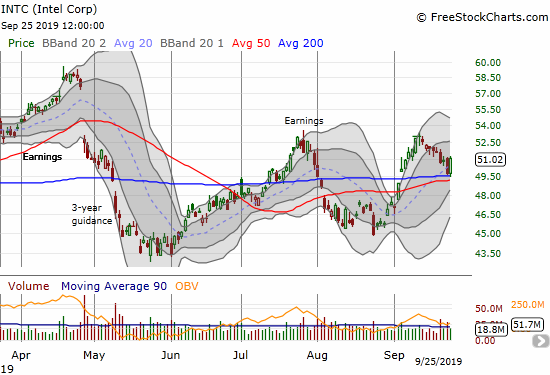
When I think of buying into a sell-off, Intel (INTC) is always at the top of the list (my favorite “between earnings” buy). When I noticed INTC perched on top of 200DMA support, my trigger fingers shot into action. With the stock up over 2%, I decided to flip the call options and take profits. Given the perfect failure at the peak ahead of earnings, the presumed potential additional upside was not worth the risk of sitting on the profits.
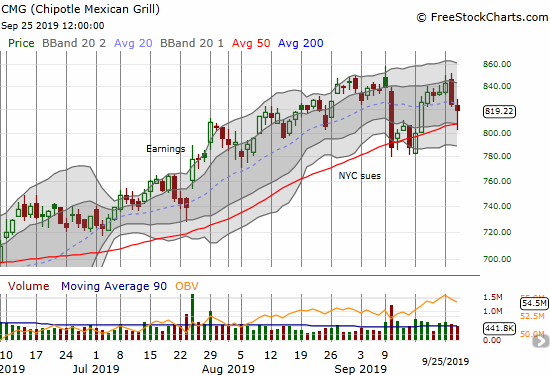
Chipotle Mexican Grill (CMG)
Chipotle Mexican Grill (CMG) survived a hold rating and rebounded off 50DMA support. I was watching the stock’s price swing wildly with a wide bid/ask spread because I hold a weekly $810/800 put spread left over from a successful hedged options position from last week. Unable to figure out how to effectively take profits on the put spread, I just set a limit price that I hoped to get filled. I did not even think to reload on a call option to play the 50DMA bounce.
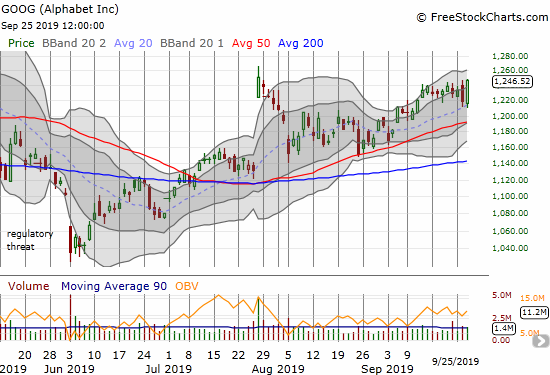
Alphabet (GOOG)
Similar to Facebook, Alphabet (GOOG) quickly faded after a strong post-earnings performance. Unlike Facebook, GOOG survived a test of 50DMA support. I bought a weekly $1260 call option at the beginning of the week in anticipation of a breakout. On Tuesday’s sell-off, the call option quickly dove to zero. Thinking that was too extreme a move, I decided to add more call options for pennies on the dollar. Wednesday’s 2.3% gain was a happy surprise that drove my position well into the green. I should have sold though; as I type I am just looking forward and hoping the stock can at least avoid a gap down open.
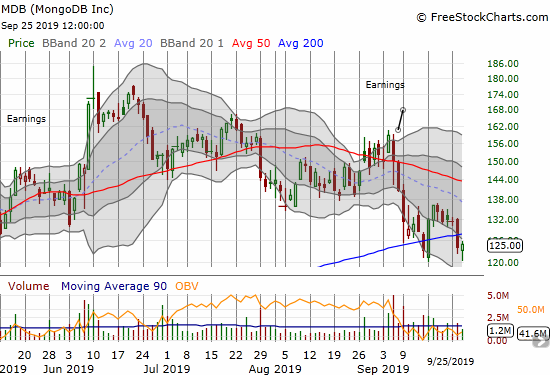
MongoDB (MDB)
MongoDB (MDB) disappointed me by failing to hold its recovery from a 200DMA breakdown. MDB broke down again in Tuesday’s sell-off. Wednesday’s rebound was meek, and I felt compelled to buy another put option to backstop the position. I still think the stock has at least one more run-up in it when these kinds of expensive, high-flying software stocks return to fashion.
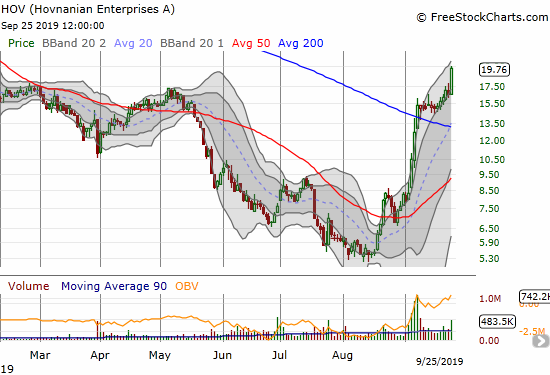
Hovnanian Enterprises (HOV)
I cannot wait to write my next Housing Market Review. Until then, I offer the stock of Hovnanian Enterprises (HOV). I was sure this stock was headed to sub $5 status. A 263% gain later and HOV now trades at an 8-month high. I watched this stock climb and climb but never acted because I consider HOV to be one of the worst home builders in the neighborhood. Otherwise, I should have bought the test of 50DMA support after the breakout. I had another chance with the bullish 200DMA breakout earlier this month. The ability of this kind of stock to soar like this says a lot about the swing in sentiment that home builders still enjoy for now.
— – —
FOLLOW Dr. Duru’s commentary on financial markets via email, StockTwits, Twitter, and even Instagram!
“Above the 40” uses the percentage of stocks trading above their respective 40-day moving averages (DMAs) to assess the technical health of the stock market and to identify extremes in market sentiment that are likely to reverse. Abbreviated as AT40, Above the 40 is an alternative label for “T2108” which was created by Worden. Learn more about T2108 on my T2108 Resource Page. AT200, or T2107, measures the percentage of stocks trading above their respective 200DMAs.
Active AT40 (T2108) periods: Day #177 over 20%, Day #16 over 30%, Day #28 over 40%, Day #12 over 50%, Day #11 over 60%, Day #4 under 70%
Daily AT40 (T2108)
")
Black line: AT40 (T2108) (% measured on the right)
Red line: Overbought threshold (70%); Blue line: Oversold threshold (20%)
Weekly AT40 (T2108)

*All charts created using FreeStockCharts unless otherwise stated
The T2108 charts above are my LATEST updates independent of the date of this given AT40 post. For my latest AT40 post click here.
Be careful out there!
Full disclosure: long VIXY calls, long GOOG calls, long FB calendar put spread, long MDB shares and put, long CMG put spread, short AUD/JPY
*Charting notes: FreeStockCharts stock prices are not adjusted for dividends. TradingView.com charts for currencies use Tokyo time as the start of the forex trading day. FreeStockCharts currency charts are based on Eastern U.S. time to define the trading day.