
AT40 = 62.1% of stocks are trading above their respective 40-day moving averages (DMAs)
AT200 = 55.2% of stocks are trading above their respective 200DMAs (finished reversing all of August’s decline)
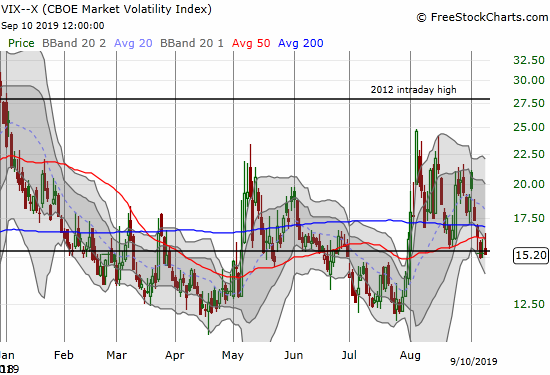
VIX = 15.2
Short-term Trading Call: neutral
Stock Market Commentary
Role reversal
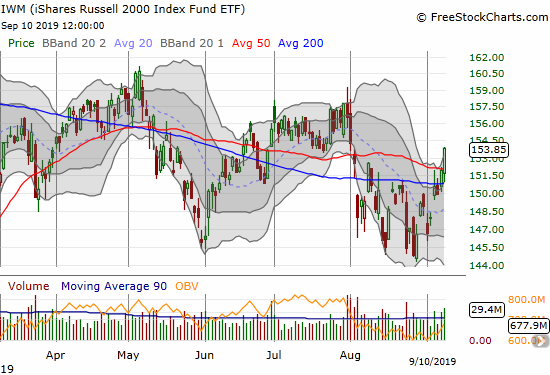
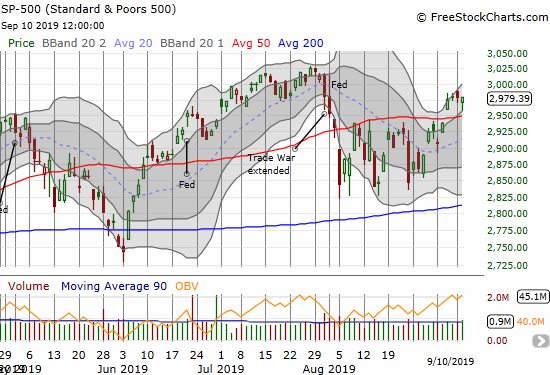
While the S&P 500 (SPY) and the NASDAQ (COMPQX) continue to fail at confirming their recent obvious breakouts, small caps, in the form of iShares Russell 2000 Index Fund ETF (IWM), have suddenly shaken off their slumber. IWM helped to answer the questions left open in the wake of the leading breakouts from the major indices. IWM brightened the market’s bullish outlook by gaining 1.3% in a confirmation of support of its 200-day moving average (DMA) and by punching a 50DMA breakout.
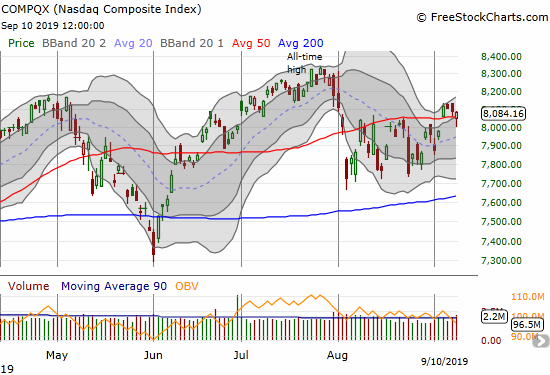
Surprisingly, the NASDAQ (COMPQX) looked ready to fall into a bearish 50DMA breakdown. Perhaps only a 1.2% gain from Apple (AAPL) helped prop up the tech-laden index.
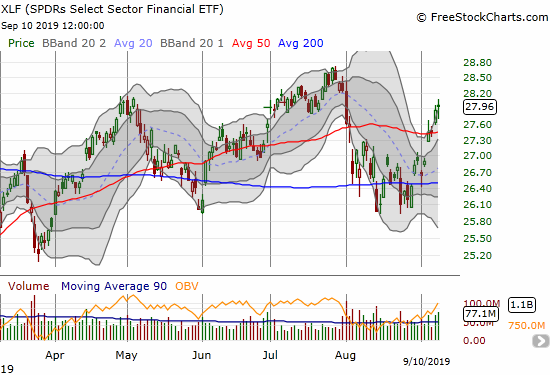
Financials are pushing higher and carrying their weight again with the SPDRS Select Sector Financial ETF (XLF) starting the week confirming a 50DMA breakout.
Bullish Implications
With small caps and financials suddenly accomplishing what the major indices are struggling to do, AT40 (T2108), the percentage of stocks trading above their respective 40DMAs, is suddenly soaring. My favorite technical indicator is out the neutral zone and closing in on the overbought threshold (70%). Perhaps even more importantly, AT200 (T2107), the percentage of stocks trading above their 200DMAs, closed the day at 55.2%. This longer-term indicator essentially reversed all its losses from the August sell-off. The move in AT200 strongly suggests that buyers will gather enough fuel to push the market right into overbought conditions (AT40 above 70%). At THAT point, an extended overbought rally goes into play. My short-term trading call will stay at neutral for the duration of this cycle given my expectations for at most a marginal new all-time high on the S&P 500.
The volatility index (VIX) is still flashing bullish signs. While the VIX is still hanging around its 15.35 pivot, it looks ready to continue its on-going implosion from the last highs.
September’s tendency for notable drawdowns remains an open wildcard. The average maximum drawdown for the S&P 500 in September since 1950 is 2.8%. September is the third worst month of the year on this score. This history is in a race against time versus the rush to challenge the AT40 overbought threshold. The charts below also remind me that there is still a very mixed environment with high-flyers suddenly falling off and even plunging from their perches.
Stock Chart Reviews – Bearish
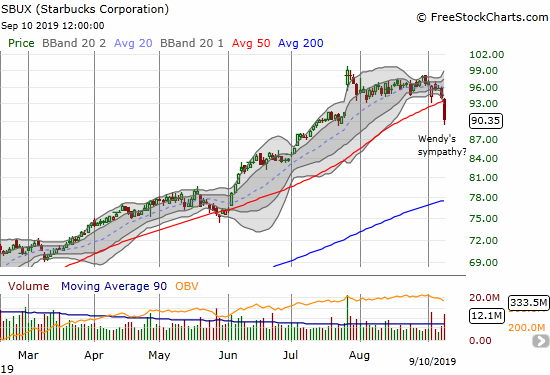
Starbucks (SBUX)
Starbucks (SBUX) apparently fell in sympathy with the Wendy’s Company (WEN) which will serve up competition at breakfast time. These are times when being an expensive high-flying stuck appears a lot less attractive. SBUX fell 4.1% on a dramatic 50DMA breakdown. After July earnings, SBUX perfectly tapped $100 and drifted away from there until today’s sell-off.
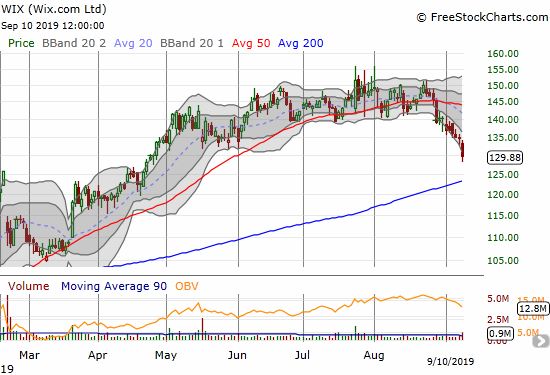
Wix.com (WIX)
Wix.com (WIX) is sliding toward its 200DMA support as sellers have managed to maintain the pressure after last month’s 50DMA breakdowns.
Stock Chart Reviews – Bullish
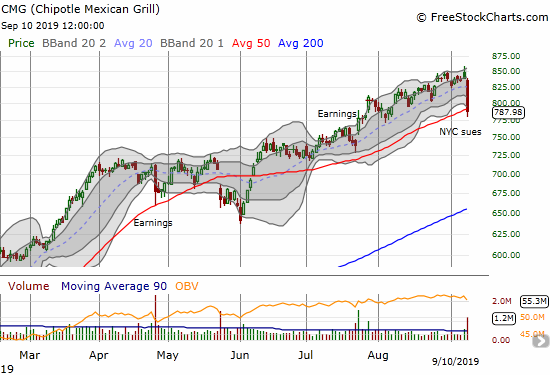
Chipotle Mexican Grill (CMG)
New York City is coming after Chipotle Mexican Grill (CMG) for unfair labor practices. The stock promptly fell 6.2% to close right on top of its 50DMA. The stock barely qualifies for the bullish column. CMG is back on my active radar for buying a bounce or chasing a 50DMA breakdown…
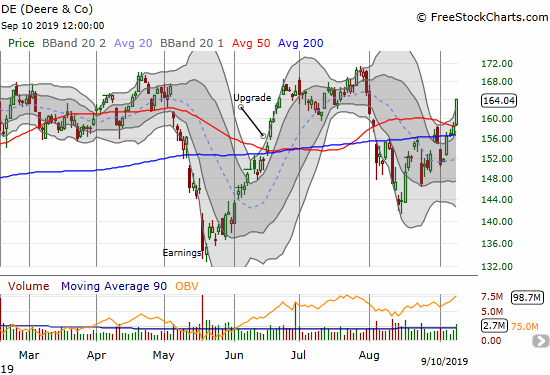
Deere & Co (DE)
Deere & Co (DE) is looking good again. The Trade War and troubles on U.S. farms are almost a distant memory with DE printing a 50DMA breakout.
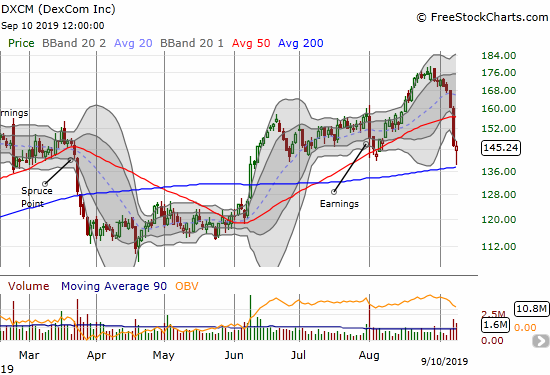
DexCom (DXCM)
DexCom (DXCM) came off its all-time high with a quickness. Buyers finally stepped up to defend 200DMA support. I used this sell-off to buy shares and a call spread, but once again this persistently wild stock has me wavering on my bullish expectations.
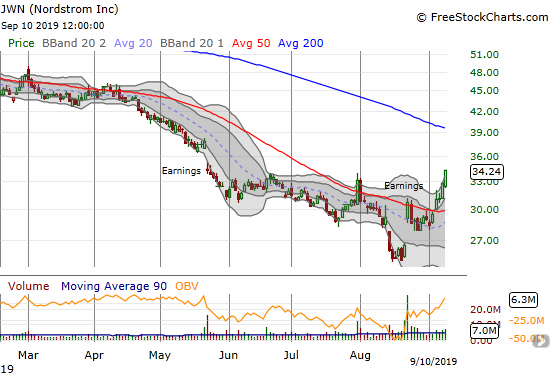
Nordstrom Inc (JWN)
Some kind of rotation is underway as a bread spectrum of retailers are catching bids. Nordstrom (JWN) jumped 4.5% today as part of a confirmation of last week’s 50DMA breakout. I have waited a long time for a fresh entry point in JWN. I bought last week’s breakout as a confirmation of the post-earnings gap up. JWN looks like it has a sustainable bottom, and I am targeting a challenge of declining 200DMA resistance.
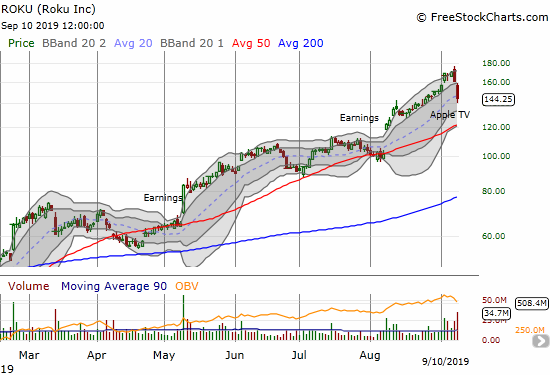
Roku (ROKU)
I just finished singing the praises of the bullish run in Roku (ROKU). Monday flashed a big warning sign with a topping bearish engulfing pattern. Apple’s announcement for Apple TV and its pricing confirmed some ROKU fears. I doubt the story is quite over for ROKU, so I am keeping the stock in the bullish column. Still, after a 2-day plunge like this, I do not like taking a swing until a successful challenge of 50DMA support.
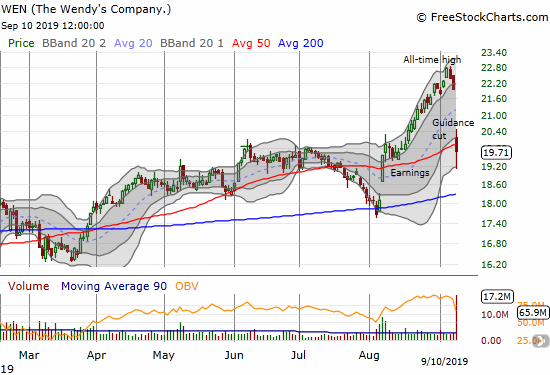
The Wendy’s Company (WEN)
I sang the praises of The Wendy’s Company (WEN) in “How to Invest in Chicken Sandwiches: Popeyes and Wendy’s.” I wanted to wait for a pullback before buying into the stock’s out-performing run-up in August. One guidance cut later (Wendy’s is investing in a nationwide breakfast menu), and I have one heckuva pullback. I stuck to the plan and bought some shares around 50DMA support. I am primed to add more around the 200DMA if the opportunity occurs. (In related news, Wingstop (WING) cleaved right through 50DMA support and is already out of my bullish column).
— – —
FOLLOW Dr. Duru’s commentary on financial markets via email, StockTwits, Twitter, and even Instagram!
“Above the 40” uses the percentage of stocks trading above their respective 40-day moving averages (DMAs) to assess the technical health of the stock market and to identify extremes in market sentiment that are likely to reverse. Abbreviated as AT40, Above the 40 is an alternative label for “T2108” which was created by Worden. Learn more about T2108 on my T2108 Resource Page. AT200, or T2107, measures the percentage of stocks trading above their respective 200DMAs.
Active AT40 (T2108) periods: Day #167 over 20%, Day #6 over 30%, Day #18 over 40%, Day #2 over 50%, Day #1 over 60% (ending 32 days under 60%), Day #124 under 70%
Daily AT40 (T2108)
")
Black line: AT40 (T2108) (% measured on the right)
Red line: Overbought threshold (70%); Blue line: Oversold threshold (20%)
Weekly AT40 (T2108)

*All charts created using FreeStockCharts unless otherwise stated
The T2108 charts above are my LATEST updates independent of the date of this given AT40 post. For my latest AT40 post click here.
Be careful out there!
Full disclosure: long VIXY calls, long DE put spread, long WIX puts, long AAPL call spread, long DXCM shares and call spread, long JWN calls
*Charting notes: FreeStockCharts stock prices are not adjusted for dividends. TradingView.com charts for currencies use Tokyo time as the start of the forex trading day. FreeStockCharts currency charts are based on Eastern U.S. time to define the trading day.
CORRECTION: Starbucks was down on financial reporting questions from the SEC. THAT is pretty serious! Especially at sky high valuations.