
AT40 = 67.8% of stocks are trading above their respective 40-day moving averages (DMAs)
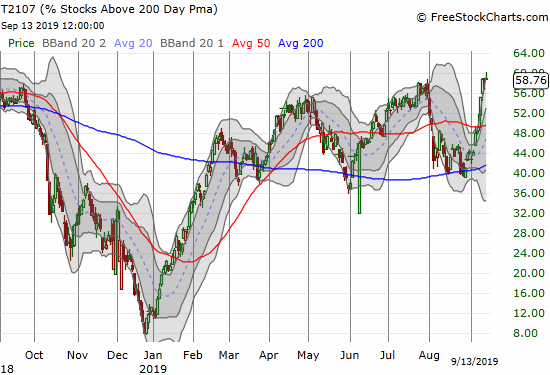
AT200 = 58.8% of stocks are trading above their respective 200DMAs (13-month high)
VIX = 13.7
Short-term Trading Call: neutral
Stock Market Commentary
Overbought Overrules
Times like these remind me of the significance of the overbought line.
AT40 (T2108), the percentage of stocks trading above their respective 40-day moving averages (DMAs), faded from the overbought threshold of 70% over the last two days.
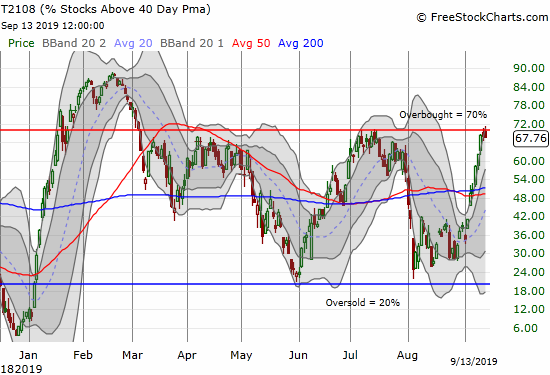
This juncture is a moment of truth for the stock market. Not only does the overbought line challenge the measure of momentum and breadth in the stock market, but also the S&P 500 (SPY) stopped cold just under its all-time high. Moreover, the U.S. Federal Reserve will deliver yet another missive on monetary policy on Wednesday, September 18th. This convergence of events and indicators seems to set up the market for a high chance of a little disappointment.
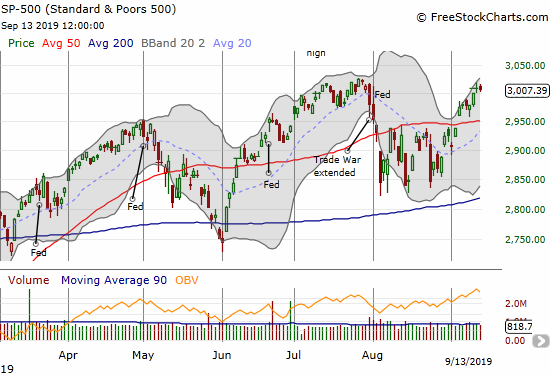
Of course, the sense of an imminent top is a bit obvious given the last three all-time highs were marginal improvements over the previous all-time high. Here is a list of the maximum (closing) gains for the S&P 500 (SPY) over the previous all-time high before another top.
- September 20, 2018: +2.0%
- April 30, 2019: +0.5%
- July 26, 2019: +2.7%
While the risk/reward looks good for shorting the market after it closes at its next all-time high, I will wait for AT40 to deliver the signal. I am always on the lookout for an extended overbought rally. I have two bearish scenarios:
- AT40 closes below 70% AFTER a close in overbought territory.
- AT40 gets rejected from the overbought threshold by dropping below 60-65% without ever going overbought.
Both conditions work sufficiently well for an extended pullback. I could suffer false triggers if the market simply goes into another extended trading range.
Freshly Bullish Breadth
AT200 (T2107), the percentage of stocks trading above their respective 200DMAs, is a strong positive for the stock market. T2108 shows that breadth has actually widened with each subsequent high/peak in the stock market. In other words, more and more stocks are participating in the rallies from a longer-term perspective: there is a widening range of candidates for buying on dips.
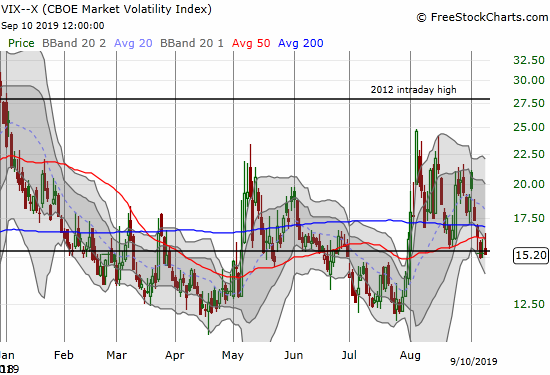
The volatility index (VIX) also confirmed bullish signs. The VIX made a clean break below its 15.35 pivot and looks like it wants to test is prior lows before ending the implosion from the latest spike higher.
What Inverted Yield Curve?
With the stock market helping people feel good, the hand-wringing over the inverted yield curve seems to be quickly fading to the background.
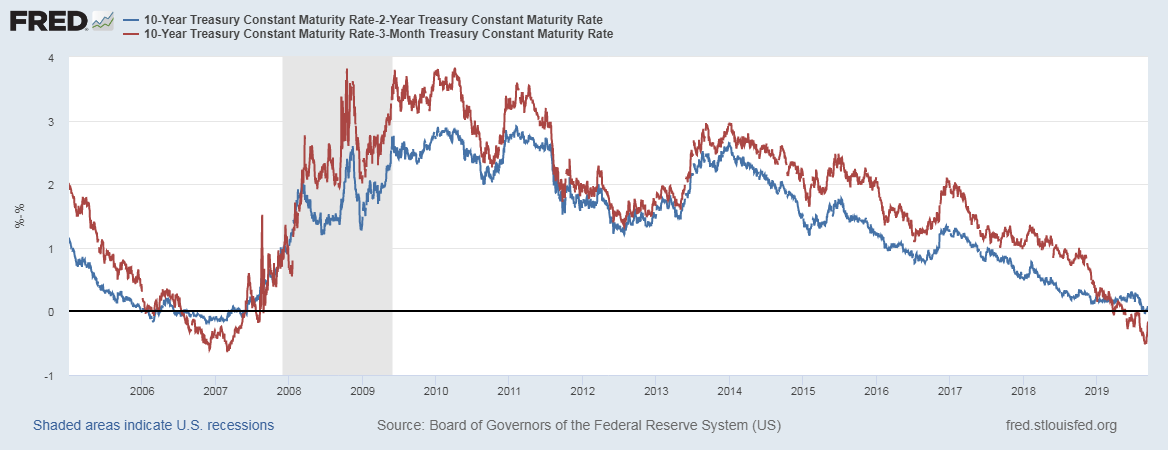
Source: Board of Governors of the Federal Reserve System (US), 10-Year Treasury Constant Maturity Rate [DGS10], retrieved from FRED, Federal Reserve Bank of St. Louis; September 15, 2019.
I will NOT forgot this inversion because history demonstrates this event starts an alarming timer (the above chart alone reminds us how long it took for the Great Recession to unfold after the yield curve inverted). The inversion also lasted long enough to raise concerns for 2020 or 2021. See “How to Understand the Inverted Yield Curve and Its Relationship to Recessions” for a reminder on why investors and traders should care about the inverted yield curve.
Trade War Hopes Spring Eternal
The Federal Reserve looms large for episodic catalysts, but the U.S. versus China Trade War provides on-going fuel. Currently, optimism rides high. The latest lift comes from the potential for the U.S. to settle for an “interim deal.” An interim deal accomplishes little to nothing but it would be enough of a detente to allow financial markets relief and a runway to assume all is well….jarring tweets notwithstanding.
Rotation Away from Momentum
The money to buy into the market and expand breadth seems to be leaching from the momentum stocks and expensive high-flyers that until now sucked up a lot of attention. This inflated “source of funds” can distribute lift to more stocks. The stock charts include some momentum stocks which have notably under-performed the S&P 500 over the past several days and weeks. Some of these declines are bearish, some look like natural pullbacks within strong uptrends. I am focused on these stocks for trades and expect the bearish setups to be particularly profitable if (when?) the bearish scenario unfolds for the general stock market.
Stock Chart Reviews – Bearish
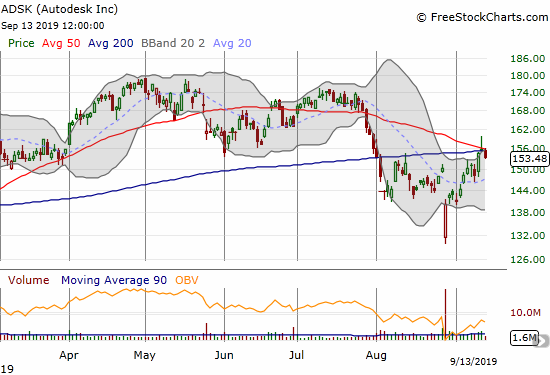
Autodesk (ADSK)
Autodesk (ADSK) has pulled off an impressive bounce from what was a near disastrous post-earnings gap down last month. Buyers picked the stock up from the intraday low and barely looked back from there. Now they face a fresh challenge. If they can push ADSK through converged resistance at the 50 and 200DMAs, then ADSK will become very bullish. Until then, the stock is setup for a bearish pullback from resistance.
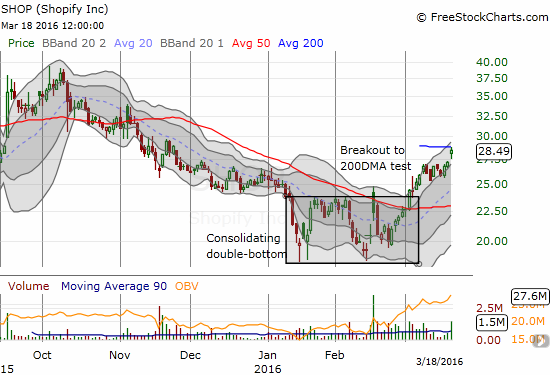
Shopify (SHOP)
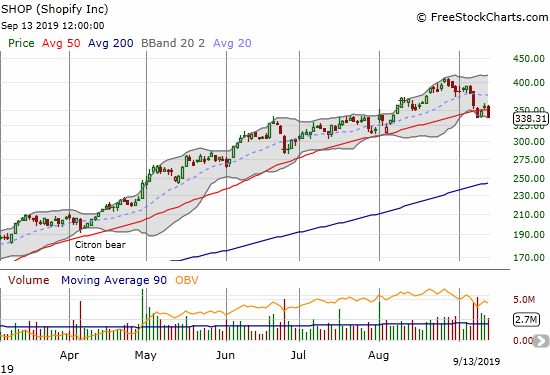
Shopify (SHOP) has defied the odds for a LONG time. It is hard to believe I identified a double-bottom in the stock around $20 in early 2016. If only I had pushed a bunch of chips into that moment. Who knows? Retirement by now? Incredibly, SHOP now trades around 16x those levels and is up 144% year-to-date alone. The stock is now teetering on its most challenging moment in a long time. The stock broke down below its 50DMA twice last week. SHOP last traded below this trendline right at the beginning of this year. Not even a Citron bearish note in April broke the stock’s momentum for long. Now SHOP looks like it may finally experience real profit-taking.
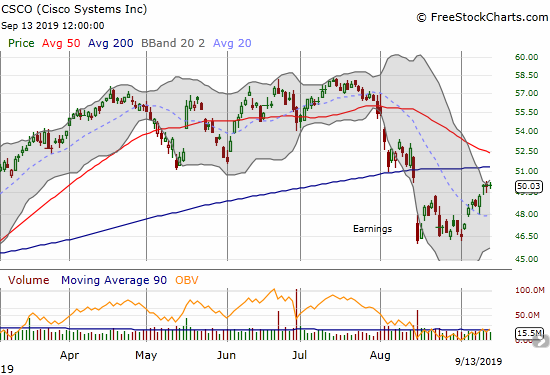
Cisco (CSCO)
I was bullish on Cisco (CSCO) earlier this year but sold out after it struggled multiple times to separate from its 50DMA. While I like the recovery since the stock’s post-earnings gap down last month, CSCO is still bearish given it trades below converging 50 and 200DMAs.
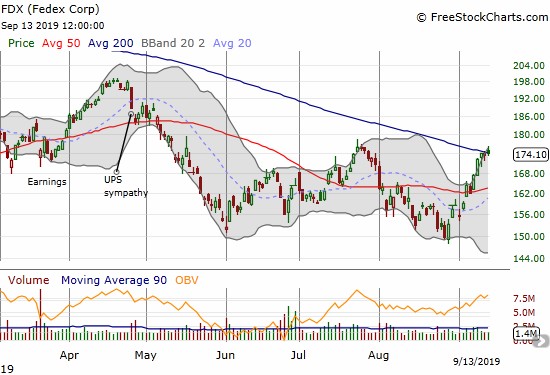
FedEx (FDX)
FedEx (FDX) could easily be a bullish chart given the healthy bounce from its 3+ year low. The stock may be making an extended triple bottom starting with the December lows. However, I need to see more than a marginal 200DMA breakout. Fedex reports earnings after the market closes on September 17th and should provide the catalyst to determine the bear/bull significance of the declining 200DMA.
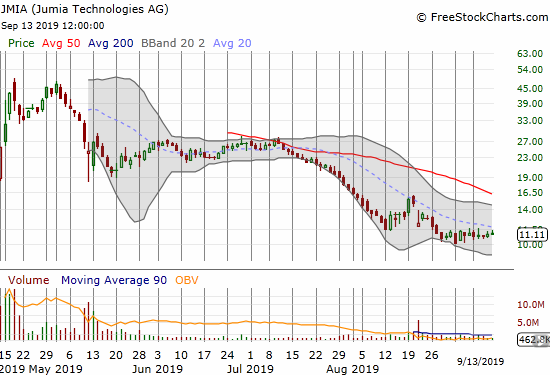
Jumia (JMIA)
It pains me to put Jumia (JMIA) in the bearish column, but the stock is barely stabilizing after a vicious sell-off this summer. JMIA also still trades below its downward trending 20DMA. I am being stubborn here and betting on the longer-term upside in African commerce. I have not yet accumulated more stock at these levels and prefer to wait for another earnings report before deciding on next moves.
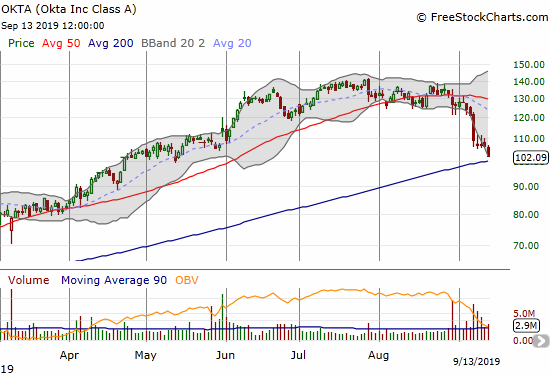
Okta (OKTA)
Okta (OKTA) could be the prototypical momentum stock suddenly falling from grace. I have it in the bearish column given the persistent selling this month below 50DMA resistance. However, I will be quick to buy the stock on a rebound from 200DMA support. A 200DMA breakdown would of course be extremely bearish for this stock.
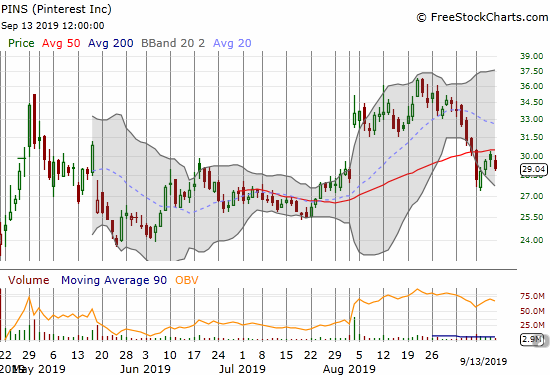
Pinterest (PINS)
Pinterest (PINS) is bearish after a 50DMA breakdown followed by a failure at 50DMA resistance. Yet on Friday I could not resist buying the stock here because I was so disappointed in missing the post-earnings gap up in early August. While the stock market’s opinion is swinging wildly on the stock, my opinion is much more steady. The current selling in expensive growth stocks has delivered what looks like to me a good opportunity to buy at a more reasonable price.
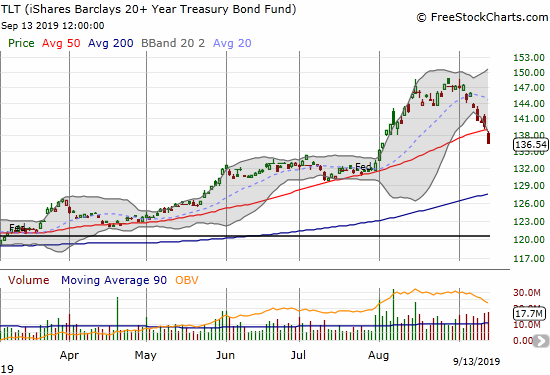
iShares Barclays 20+ Year Treasury Bond Fund (TLT)
The iShares Barclays 20+ Year Treasury Bond Fund (TLT) suffered a 50DMA breakdown on Friday’s 2.1% loss. Such a move is automatically bearish. I tried to time what I thought would be an inevitable pullback, but I completely failed by buying puts of various strikes in late July and early August. Timing is everything!
Now, perhaps ironically, I am buying call options in preparation for the next growth scare that sends bond buyers back into action. Conventional wisdom says the bond market is smarter than the stock market but this latest recession/growth fear episode shows the mercurial potential of the bond market. Is the bond market “correct” in this sharp pullback or in the prior sharp run-up for TLT?
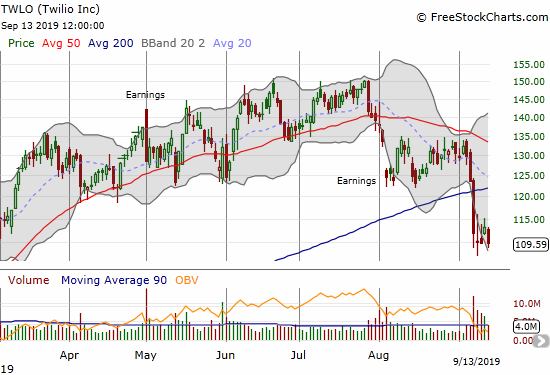
Twilio (TWLO)
I am tempted to buy into Twilio (TWLO) at the current growth stock “discount.” However, I must defer to the bearish 200DMA breakdown underway. The stock looked like it was stabilizing after the post-earnings gap down last month. The 200DMA breakdown was swift and deep enough to convince me that the healing process is going to take quite a long time yet.
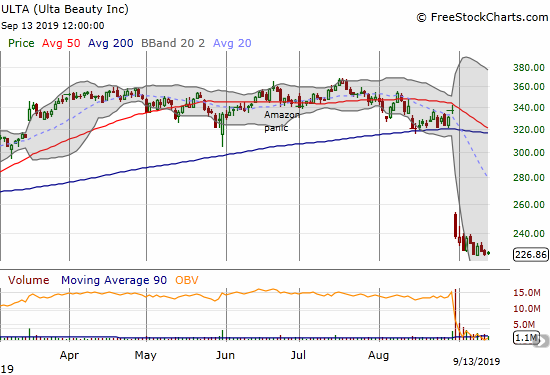
Ulta Beauty (ULTA)
Ulta Beauty (ULTA) was slammed bigtime in August as one of the biggest clarion calls for an end to the ascension of expensive momentum stocks. Follow-on trading has been slow-going but the downward bias is still apparent. I bought put options expiring Friday as a first trade on this bearish setup.
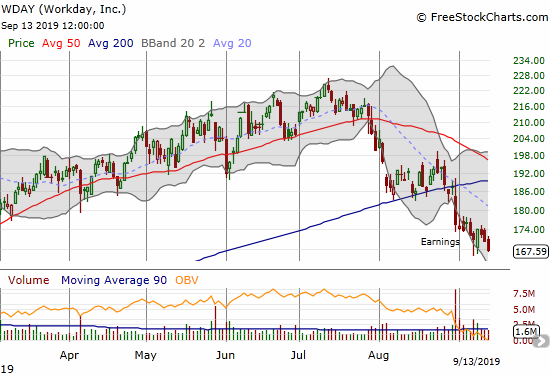
Workday (WDAY)
The pullback in momentum growth stock Workday (WDAY) has become quite bearish. Sellers are slowly following up on a post-earnings 200DMA breakdown. A one-day buying spurt off Tuesday’s intraday low was reversed. I bought put options just ahead of that pop.
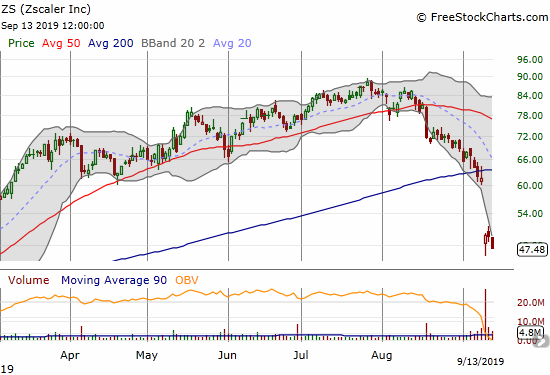
Zscaler (ZS)
The post-earnings chart in Zscaler (ZS) says it all. This former momentum stock is down almost 50% from its all-time high set less than two months ago. Now ZS trades at a 7-month low.
Stock Chart Reviews – Bullish
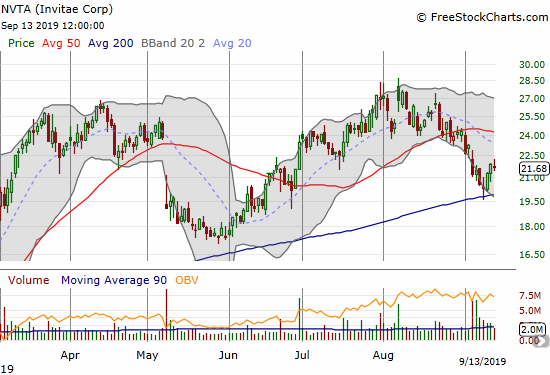
Invitae (NVTA)
I first heard of biotech firm Invitae (NVTA) after listening to an inspirational talk on Stanford University’s eCorner series called Entrepreneurial Thought Leaders. The featured guest for the April 8, 2015 episode was Invitae’s President and Chief Operating Officer Sean George. He titled his talk “Experience Is Your Reward.” George talked about the rewards from facing entrepreneurial challenges. He sounded like the kind of leader I want to invest in.
George spoke shortly after NTVA’s IPO. The stock lost as much as 2/3 of its value before making its first all-time high March of THIS year. That is some true stock adversity! Most of the way I just assumed this stock was an unknown value. While I successfully accumulated and traded in and out of NVTA a few times along the way, I only partly benefited from this year’s successes. So when the stock finally tagged its 200DMA, I rushed right in to buy back in. This stock should of course be immune to trade war tweets and recession fears.
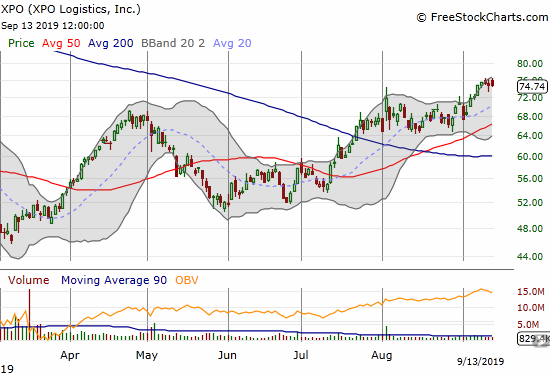
XPO Logisitics (XPO)
XPO Logistics (XPO) has stayed on my bullish list since December’s calamity. I have not participated in the latest upward cycle, but I plan to buy the next dip toward support.
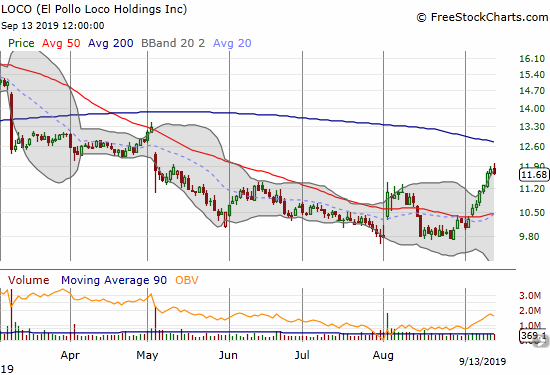
El Pollo Loco Holdings (LOCO)
I may have bought El Pollo Loco Holdings (LOCO) just in time. The bottoming in the stock is so far working out a lot better than I could have hoped. I am now trying to hold on for at least a challenge of downtrending 200DMA resistance.
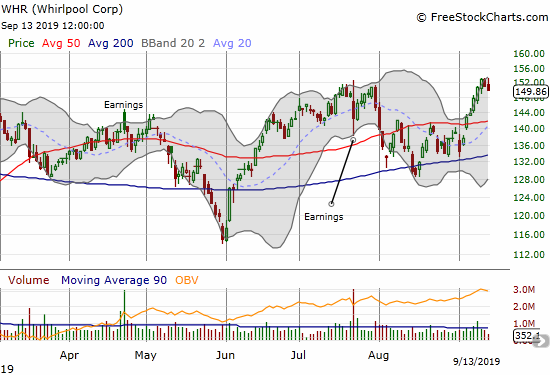
Whirlpool (WHR)
Whirlpool (WHR) neatly followed the pattern of the S&P 500 with its August bounce through the channel formed by its 50 and 200DMAs. WHR broke out earlier this month and made a new marginal high last week only to fall back a bit. I want to buy a test of 50DMA support.
— – —
FOLLOW Dr. Duru’s commentary on financial markets via email, StockTwits, Twitter, and even Instagram!
“Above the 40” uses the percentage of stocks trading above their respective 40-day moving averages (DMAs) to assess the technical health of the stock market and to identify extremes in market sentiment that are likely to reverse. Abbreviated as AT40, Above the 40 is an alternative label for “T2108” which was created by Worden. Learn more about T2108 on my T2108 Resource Page. AT200, or T2107, measures the percentage of stocks trading above their respective 200DMAs.
Active AT40 (T2108) periods: Day #170 over 20%, Day #9 over 30%, Day #21 over 40%, Day #5 over 50%, Day #4 over 60%, Day #127 under 70%
Daily AT40 (T2108)
")
Black line: AT40 (T2108) (% measured on the right)
Red line: Overbought threshold (70%); Blue line: Oversold threshold (20%)
Weekly AT40 (T2108)

*All charts created using FreeStockCharts unless otherwise stated
The T2108 charts above are my LATEST updates independent of the date of this given AT40 post. For my latest AT40 post click here.
Be careful out there!
Full disclosure: long NVTA, long LOCO, long TLT calls and puts, long PINS, long WDAY puts, long ULTA puts, long JMIA
*Charting notes: FreeStockCharts stock prices are not adjusted for dividends. TradingView.com charts for currencies use Tokyo time as the start of the forex trading day. FreeStockCharts currency charts are based on Eastern U.S. time to define the trading day.