
AT40 = 28.8% of stocks are trading above their respective 40-day moving averages (DMAs)
AT200 = 39.9% of stocks are trading above their respective 200DMAs (2-month low)
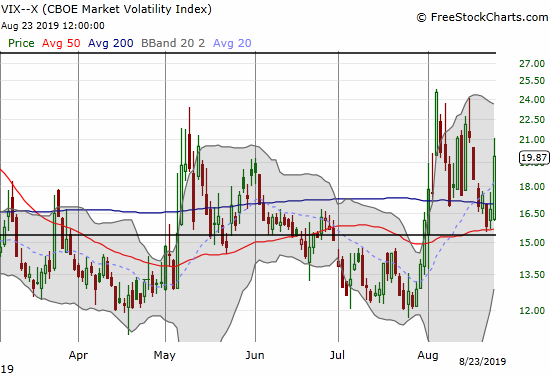
VIX = 19.9
Short-term Trading Call: cautiously bullish (see caveats below)
Stock Market Commentary
Presidential Decrees
“Q Six hundred and twenty-three points — that’s what the Dow was down today because of what you tweeted. Do you have a responsibility for that?
Remarks by President Trump Before Marine One Departure, Issued on: August 24, 2019
THE PRESIDENT: Not at all. Not at all. Because if you look at from November 9th — the day after the election — we’re up 50 percent or more. We’re up many, many points. We were at about sixteen or seventeen thousand. We’re at 25,000, so don’t tell me about 600 points.”
Quotes like these are what make this stock market “The 401K Stock Market.” The President keeps track of the stock market and has a sense of how it relates to his perceived performance.
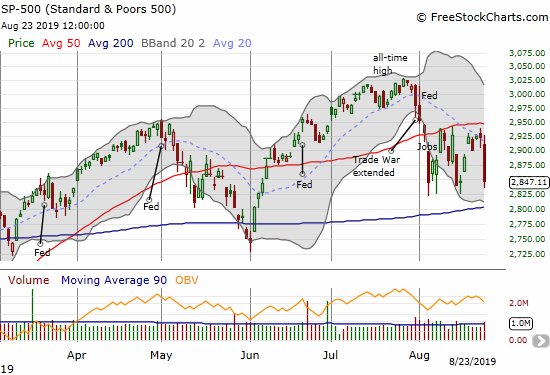
I ignore the Dow Jones Industrials, so I will restate the President’s calculations in S&P 500 (SPY) equivalents. On November 9, 2016, the S&P 500 closed up 1.1% at 2163; recall that stock market futures were down as much as 10% overnight and currency markets swung wildly. Since the market close on Election day (2139.56), the S&P 500 is up 33.1% (roughly 12% annualized) as of Friday’s close at 2847.11. From the Election Day close through last Thursday’s close at 2922.95, the S&P 500 gained 783.39 points. Friday’s 2.6% loss was a drop of 75.84 points on the S&P 500. So Friday’s loss was by itself a reversal of 9.7% of the post-Election gains (75.84/783.39). This setback is particularly notable given the S&P 500 has gone nowhere since the major peak on January 26, 2018 at 2872.87, a full 20 months ago.
The Ugly Sandwich
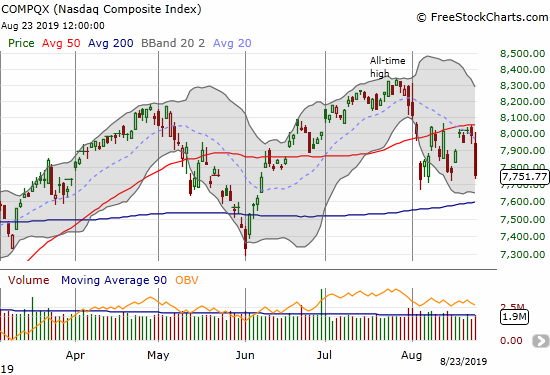
While the 401K Stock Market is once again wobbly, with another failure at overhead resistance from 50-day moving averages (DMAs), the extreme of August remains intact as support for the S&P 500 (SPY) and the NASDAQ (COMPQX). These major indices are sandwiched between key support and resistance.
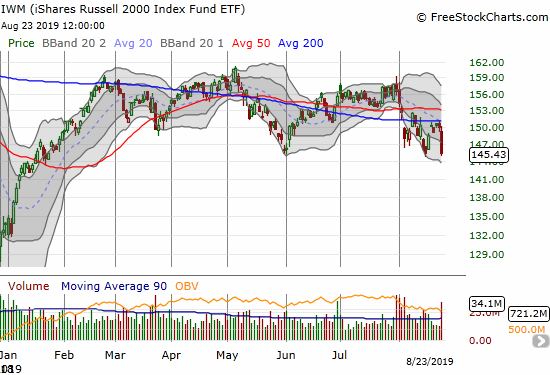
The iShares Russell 2000 Index Fund ETF (IWM) is doing its best to smear any optimism over the prospects for a bounce. Friday’s 3.1% loss reconfirmed 200DMA resistance and pounded away at the August low. If selling in IWM continues from here there is very little support between here and the lows from December/January.
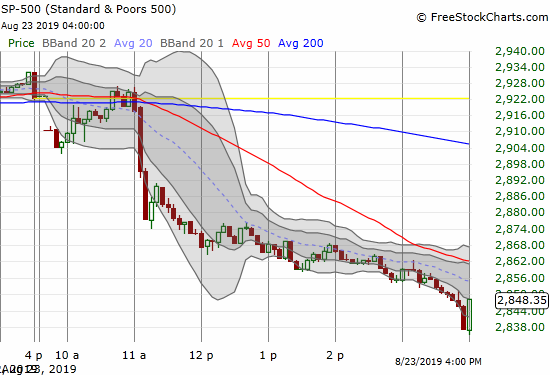
The stock market was buffeted by a sandwich of news on Friday. For the bottom slice of bread, the Chinese government tried to steal thunder from Fed Chair Jerome Powell and his much anticipated Jackson Hole speech by announcing tariffs on $75B of U.S. exports. At THAT point, I should have started thinking about the range of potential U.S. responses. Instead, I was overly focused on tracking the market’s response to Powell’s speech at Jackson Hole, the meat of Friday’s news sandwich. I duly noted how buyers quickly went to work reversing the initial gap down in anticipation of Powell. I increased my own odds of an imminent 50DMA breakout for the S&P 500. I had lowball limit orders in for SPY and AAPL calls (both soon filled, and I doubled down on SPY calls toward the close).
The market floated higher and closed the gap down about 40 minutes after Powell’s Fed speech was released. Five minutes later, I should have immediately noted that the downside risks greatly increased: in a tweet, President Trump expressed his displeasure with the Jackson Hole speech and even went so far as to ask who is the bigger enemy “Jay Powell or Chairman Xi?” That top slice of bread for the news sandwich was also the top for the day. When Trump slathered on a thick layer of condiments of more retaliatory tariffs and an order to U.S. companies to evacuate China, the market choked. The pressure was too much to bear. The sellers barely rested for the remainder of the day.
Residual Resilience?
I am honestly amazed the stock market is not a LOT lower given all the hits it keeps taking. Even the volatility index seems “low” given the presumed elevated amount of external risks. The volatility index (VIX) gained 19.1% but stll barely held onto the 20 level which is conventionally thought of as “elevated.”
Even more interesting is that my favorite technical indicator, AT40 (T2108), the percentage of stocks trading above their respective 40DMAs, closed higher than its close on the two prior August lows. AT40 closed at 28.8% while the previous closing lows were 24.9% and 26.1%. As I stated at the previous low, this move is not enough to declare a bullish divergence, but it does support the notion of some residual resilience. AT200 (T2107), the percentage of stocks trading above their respective 200DMAs, is a confounder with a marginal 2 1/2 month low at 39.9%.
CAVEAT. At the time of writing, currency markets were in turmoil under a barrage of freshly bad global news and the accompanying low liquidity conditions that precede the official opening of Asian markets to start the week. A gap down and on-going plunge in the Australian dollar (FXA) versus the Japanese yen (FXY) made me more pessimistic about the U.S. open (I typically expect such moves to fully reverse by the U.S. open). The only good news I can salvage here is AT40 might finally plunge into true oversold conditions (less than 20%).
My short-term trading call stays at cautiously bullish first based on the prospects for another bounce and challenge of 50DMA resistance and second based on the alternative of a quick visit to oversold conditions.
Stock Chart Reviews – Bearish
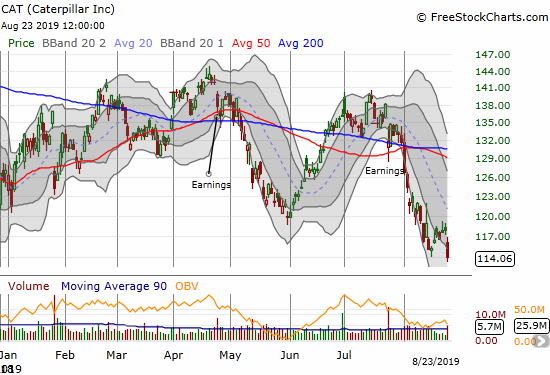
Caterpillar (CAT)
Caterpillar (CAT) is one of the few stocks that make sense in this environment. The stock has been under pressure since it gapped down post-earnings last month. Friday’s sell-off pushed the stock all the way back to a 10-month low. I am still holding my October $115/$110 put spread and will look to fade CAT on any rallies from here. The stock has not provided a good fade opportunity since the 200DMA breakout ahead of earnings.
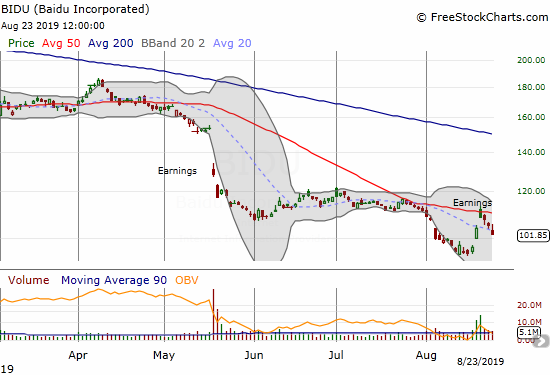
Baidu (BIDU)
Baidu (BIDU) soared into earnings and then gapped into 50DMA resitance post-earnings. The post-earnings fade has yet to end.
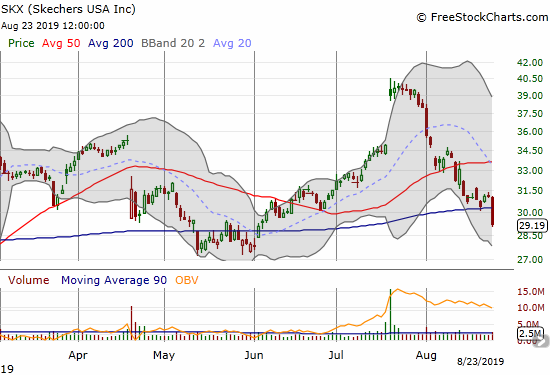
Skechers (SKX)
I do not know what to make of Skechers (SKX) any more. The stock is all over the place. Ahead of Friday, I was optimistically looking to buy it off 200DMA support. Friday’s 6.1% loss and 200DMA breakdown immediately shifted the stock into bearish territory looking for a confirmation.
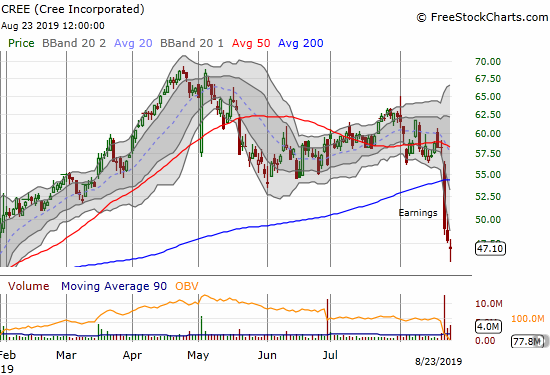
Cree Incorporated (CREE)
Cree Incorporated (CREE) smashed through its 200DMA support post-earnings. Interestingly, the stock made a doji pattern that increases the chances of a bottom. While the stock could be good for a rebound to 200DMA resistance, I am only interested in fading a rally in this stock with such a momentous breakdown.
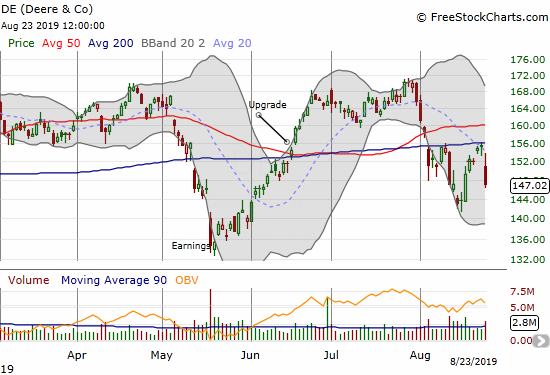
Deere & Co. (DE)
Deere & Co (DE) was one of the few stocks I chased lower on Friday. The stock’s post-earning surge the previous week did not make any sense to me. Friday’s 5.4% loss makes a lot of sense and confirmed 200DMA resistance. I bought a September $140/$135 put spread assuming the May lows will soon get tested. I was not willing to pay the premium of a straight put. Like CAT, DE is a good hedge on bullishness.
Stock Chart Reviews – Bullish
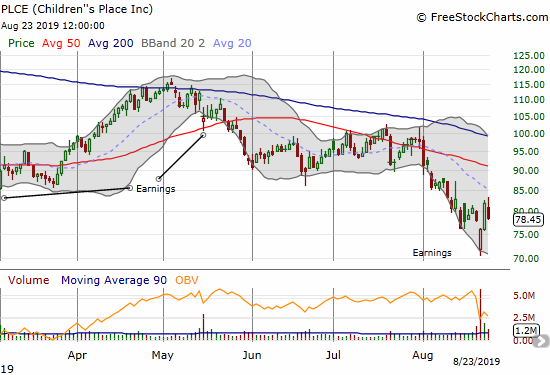
Children’s Place (PLCE)
I have been tracking Children’s Place (PLCE) for a while now. The large gap down post-earnings seemed to confirm all the bad news the market must have worried about going into earnings. Instead of looking to buy, I decided to short assuming the selling would resume. I had to bail quickly as buyers close the post-earnings gap and more. Needless to say I was displeased with my choice to take my attention off reasons to buy PLCE.
PLCE could not withstand the Friday negativity. The stock is back to being a speculative buy with a hard stop below the post-earnings low and an upside target at declining 50DMA resistance.
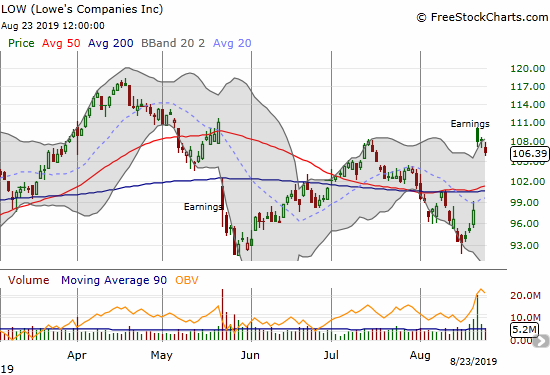
Lowe’s and Companies (LOW)
In a week of startling upside for certain retailers, Lowe’s and Companies (LOW) still surprised me. I was bullish coming off the April post-earnings lows but threw up my hands after the confirmed 50/200 DMA breakdown earlier this month. The bottoming hammer patter on August 15th gave me “permission” to buy back in, but I took profits into the pre-earnings pop. I am bullish on LOW once again, but I will not chase the stock higher. I think it is easily at risk here for a test of 50/200DMA support.
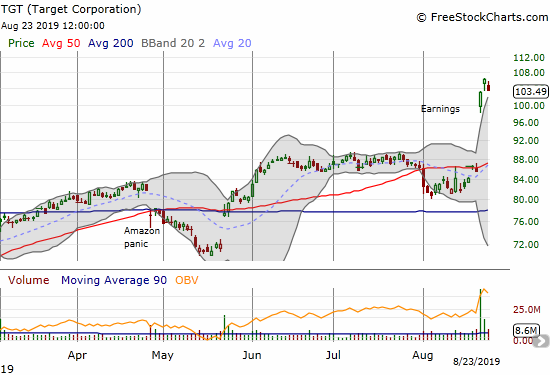
Target (TGT)
Target (TGT) soared an historic 20.4% post-earnings pop to an all-time high. This move clearly makes TGT a buy on dips. However, I pulled back to the long-term chart and noticed that TGT has relatively struggled for years. After a double-top in 2015/2016, TGT finally broke out again in 2018 on the heels of a sharp rally from 6-year lows in 2017. So, TGT is definitely not a stock to chase higher…
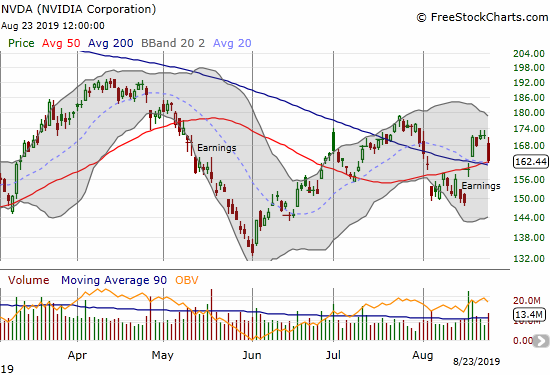
Nvidia (NVDA)
Nvidia closed Friday on top of important resistance. My bullish call is strictly based on the post-earnings pop that led to the stock’s 50/200DMA breakouts. NVDA is on the top of my buy list if the market dumps into oversold conditions or headlines turn the market’s mood back around.
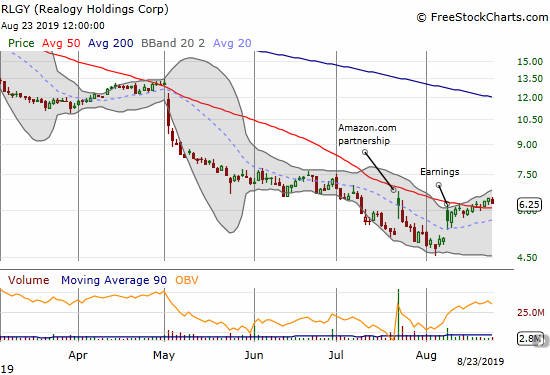
Realogy Holdings (RLGY)
Realogy Holdings (RLGY) made a very subtle 50DMA breakout last week. I bought the small dip on Friday as a purely speculative play. I have gone from bagging on the company to rooting for it…
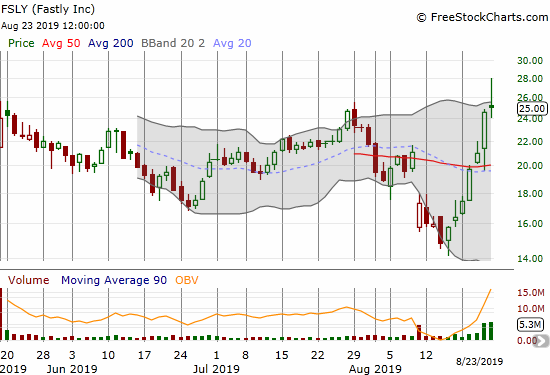
Fastly (FSLY)
Fastly (FSLY) is a classic example of how inefficient the stock market can be.
I highly anticipated Fastly’s IPO, but I was not able to grab shares. FSLY priced its IPO at $16 and opened for trading at $21.50. I was surprised the momentum stopped dead in its tracks. As the stock began to fade toward its IPO price, I accumulated shares. Surprised at the stock’s overall weakness, I decided to take profits into July’s run-up. From there, I somehow managed to pull off several fortuitous intraday trades. The biggest opportunity came as the stock broke its $16 IPO price post-earnings and in a few days traded as low as $14.10. I once again took profits when the stock sailed into 50DMA resistance.
I assumed the sellers would descend upon the stock on schedule. Instead, the stock managed to breakout. On Thursday, sellers retested 50DMA support but a positive report from Motley Fool sent FSLY soaring from $19.55 to a $24.53 close. I am pretty sure FSLY would have held $28 on Friday if not for the barrage of bad news and negativity. So, in effect, the market was waiting for an endorsement from Motley Fool before believing the bullish story…? Fascinating!
— – —
FOLLOW Dr. Duru’s commentary on financial markets via email, StockTwits, Twitter, and even Instagram!
“Above the 40” uses the percentage of stocks trading above their respective 40-day moving averages (DMAs) to assess the technical health of the stock market and to identify extremes in market sentiment that are likely to reverse. Abbreviated as AT40, Above the 40 is an alternative label for “T2108” which was created by Worden. Learn more about T2108 on my T2108 Resource Page. AT200, or T2107, measures the percentage of stocks trading above their respective 200DMAs.
Active AT40 (T2108) periods: Day #160 over 20%, Day #1 under 30% (underperiod ending 5 days over 30%), Day #11 under 40%, Day #18 under 50%, Day #27 under 60%, Day #117 under 70%
Daily AT40 (T2108)
")
Black line: AT40 (T2108) (% measured on the right)
Red line: Overbought threshold (70%); Blue line: Oversold threshold (20%)
Weekly AT40 (T2108)

*All charts created using FreeStockCharts unless otherwise stated
The T2108 charts above are my LATEST updates independent of the date of this given AT40 post. For my latest AT40 post click here.
Be careful out there!
Full disclosure: long UVXY calls, long SPY calls, long CAT put spread, long DE put spread, long RLGY, long AAPL calls and call spread
*Charting notes: FreeStockCharts stock prices are not adjusted for dividends. TradingView.com charts for currencies use Tokyo time as the start of the forex trading day. FreeStockCharts currency charts are based on Eastern U.S. time to define the trading day.
Dr Duru, I have been keeping up with your vision of where things are, where they are going and brilliant observations. Thank you kind Sir!
And thank you for reading!
Regarding FSLY: my introduction to Motley Fool’s amazing ability to spike obscure, thinly traded “story” stocks came with Lifeway (LWAY), which the Fool took from $7 to $17 in a week in early 2004. Apparently they’re still up to their old tricks.
Sorry, flaky memory; I just checked my records, and it was not $7 to $17, it was $4 to $14 – a much bigger % jump!
Sure – NOW you remind me! 😉