
Panic Buying, Catch-Up Trades Further Extend Overbought Stock Market – Above the 40 (June 5, 2020)

Stock Market Statistics AT40 = 90.5% of stocks are trading above their respective 40-day moving averages (DMAs) (overbought 13 of last 14 trading days)AT200 = 37.4% of stocks are trading above their respective 200DMAs (highest since February 26, 2020)VIX = 24.5Short-term Trading Call: cautiously bullish Stock Market Commentary The on-going recovery in the stock market … Read more
Green Shoots Push Into the Next Downtrend Threatening to Trample Stocks – Above the 40 (March 27, 2020)

AT40 = 3.8% of stocks are trading above their respective 40-day moving averages (DMAs) (23rd oversold day)AT200 = 5.0% of stocks are trading above their respective 200DMAs (new low for the oversold period)VIX = 65.5Short-term Trading Call: bullish Stock Market Commentary First a dose of hope: “Coronavirus treatment: Palo Alto woman recovers from coronavirus after … Read more

An Ugly Weekly Gain for An Extremely Oversold Stock Market – Above the 40 (March 6, 2020)

AT40 = 9.4% of stocks are trading above their respective 40-day moving averages (DMAs) (8th oversold day)AT200 = 23.2% of stocks are trading above their respective 200DMAsVIX = 41.9Short-term Trading Call: bullish Stock Market Commentary The Shake and Bake bottom barely held as support last week. It was a week of dramatic ups and downs … Read more

Resilience Cracks: Market’s Bearish Divergence Ends In Topping Pattern – Above the 40 (January 24, 2020)

AT40 = 52.2% of stocks are trading above their respective 40-day moving averages (DMAs)AT200 = 58.2% of stocks are trading above their respective 200DMAs VIX = 14.6Short-term Trading Call: neutral Stock Market Commentary The stock market finally pushed into overbought territory on Thursday, January 16th. The breakout quickly turned into a bust with AT40 (T2108), … Read more

A Resilient Stock Market Barely Blinks At Fresh Bearish Signals – Above the 40 (January 3, 2020)

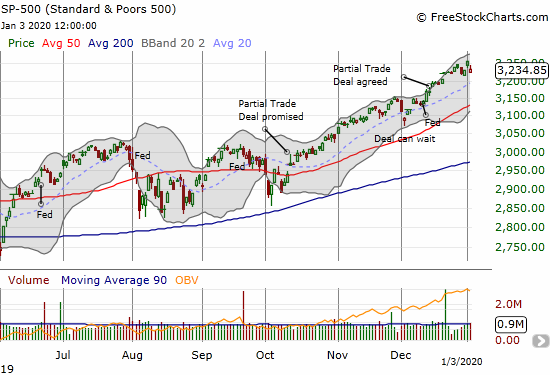
The S&P 500 (SPY) lost 0.7% and closed right at the lower boundary of its upper Bollinger Band. The pattern left behind an island reversal.

AT40 = 63.5% of stocks are trading above their respective 40-day moving averages (DMAs)AT200 = 60.3% of stocks are trading above their respective 200DMAsVIX = 14.0Short-term Trading Call: neutral Stock Market Commentary The stock market started the new decade with wild swings. After starting the first trading day of the decade with a 0.8% gain … Read more