
Stock Market Statistics
AT40 = 90.5% of stocks are trading above their respective 40-day moving averages (DMAs) (overbought 13 of last 14 trading days)
AT200 = 37.4% of stocks are trading above their respective 200DMAs (highest since February 26, 2020)
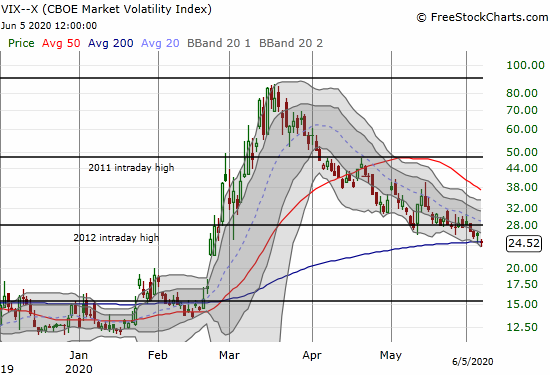
VIX = 24.5
Short-term Trading Call: cautiously bullish
Stock Market Commentary
The on-going recovery in the stock market may have finally reached a stage of panic buying. The strong May jobs report likely solidified the bottom in the stock market from March. That realization alone can drive money off the sidelines and rushing back into the stock market. The strong buying on Friday also likely solidified the recent breakouts across individual stocks and various indices and ETFs. The extended overbought rally looks like it has a lot more left in the tank. Certainly a retest of support at 200-day moving averages (DMAs) would be the next major buying opportunity – if the market ever gets around to serving such a thing up in the near-term.
The Stock Market Indices
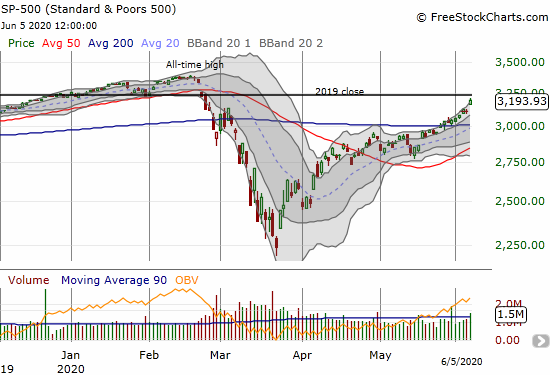
The S&P 500 (SPY) started the week on a positive note, and it never looked back. Friday’s 2.6% gain was the index’s strongest one-day gain since the major gap up on May 18th that launched the current overbought period. During this overbought period, the index has neatly followed its upper Bollinger Band (BB) upward. However, the strong move on Friday bent the index into a near parabolic move with a close above the upper Bollinger Band. With the index near flat for the year, I will not be surprised if the stock market cools off a bit this week.
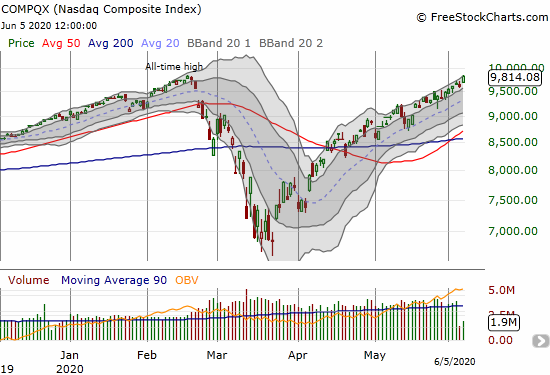
The NASDAQ (COMPQX) continued its orderly march upward through its upper-BB. The tech-laden index is incredibly within three points of an all-time high. The NASDAQ did not bend into a parabolic shape to get to this point. I will not be surprised if the NASDAQ continues to march right along as sellers take some profits in the S&P 500.
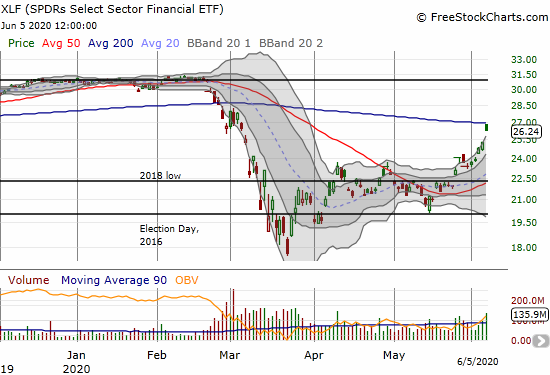
The swift rebound in financials caught me flat-footed. The SPDR Select Sector Financial (XLF) went from an ominous laggard in mid-May to a poster-child example of a parabolic move. XLF gapped higher on Friday and ran smack into 200DMA resistance. The 3.7% gain bent the upper-BB sharply upward into the classic parabolic shape. XLF could easily let off steam for the coming week while other sectors continue playing catch-up with the stock market.
Volatility
The volatility index, the VIX, lost its resilience from the previous week. The fear gauge broke down again and closed the week right at its own 200DMA. The VIX is close to reversing its entire incremental gain from the big gap on February 24th that marked synchronized 50DMA breakdowns across stock indices.
Overbought

AT40 (T2108), the percentage of stocks trading above their respective 40DMAs, has been overbought (over 70%), for 12 straight trading days and 13 of the last 14. AT40 closed Friday at a stratospheric 90.5%. Since 1986, AT40 has closed at or above 90% for just 37 trading days. Current levels are the extreme of the extremes! AT40 last hit these levels May 11, 2009. AT40 traded at or above 90% for 11 trading days after the historic March, 2009 low. The two other 90%+ periods for AT40 were after the 2003 stock market bottom and in early 1991 in the waning days of the recession at that time. This pattern means that such extremes are NOT bearish in of themselves. Indeed, they confirm a bullish under-current for the stock market.
Until AT40 drops out of overbought conditions, the most important indicator is AT200 (T2107), the percentage of stocks trading above their respective 200DMAs. AT200 has blazed a trail of bullish 200DMA breakouts. AT200 closed on Friday at 37.4%, its highest level since February 26th. In other words, there is still plenty of upside left from here with more latecomer 200DMA breakouts on catch-up trades.
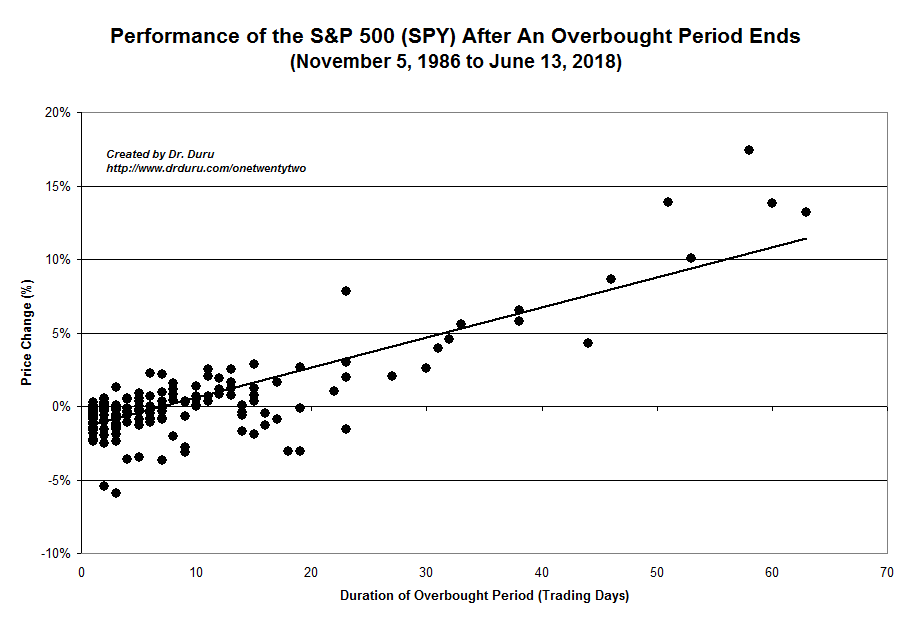
The current overbought period started on May 20th. The S&P 500 is up 7.5% since then. Per the chart below, the index is pacing well ahead of historic performance. So either the overbought period is going to last for several more weeks or more or a swift correction is around the corner. I am not expecting the latter.
The Short-Term Trading Call
I am currently expecting the overbought period to continue extending. So the short-term trading call remains at cautiously bullish. However, I did use Friday’s surge as an opportunity to lock in more profits. The most important move was selling another large chunk of my position in the ProShares Ultra S&P500 (SSO). SSO gained another 5.2% on Friday and has doubled from the March low. While I certainly wish I held onto all my SSO shares through Friday, I am very satisfied in my switch in strategy from buying SSO call options to shares. The extended duration of the previous oversold period could have destroyed a lot of value in call options and caused me to doubt the wisdom of sticking by my AT40 trading rules.
Stock Chart Reviews – Below the 50DMA
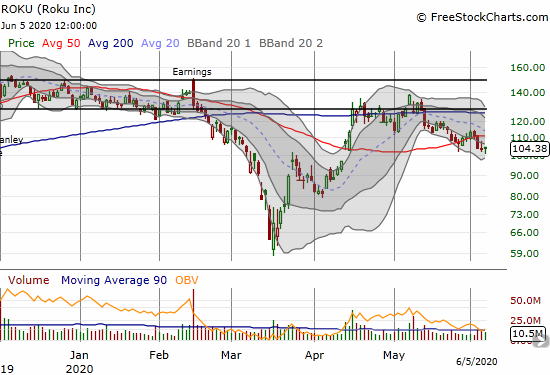
Roku (Roku)
Roku (ROKU) continues to lag the soaring stock market. After a small rebound, ROKU broke down below its 50DMA again. I made profits on my latest batch of put options, but I had to move fast. ROKU bounced off the $100 level again to eke out a gain on Friday. ROKU goes back on my bearish list on a close below $100, and I do not trust it on a 50DMA breakout.
iShares Barclays 20+Year Treasury Bond Trust (TLT)
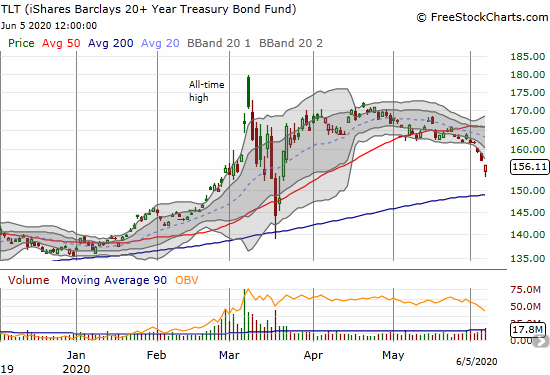
Last month I called bonds expensive. Last week, iShares Barclays 20+Year Treasury Bond Trust (TLT) accelerated to the downside. While Friday’s move was just as over-extended as the upside move in XLF, I fully expect TLT to retest 200DMA support sooner than later. At that point, I will likely buy up some call options as a bet on a continuation of an ultra-low interest rate environment.
Stock Chart Reviews – Above the 50DMA
American Airlines Group Inc (AAL)
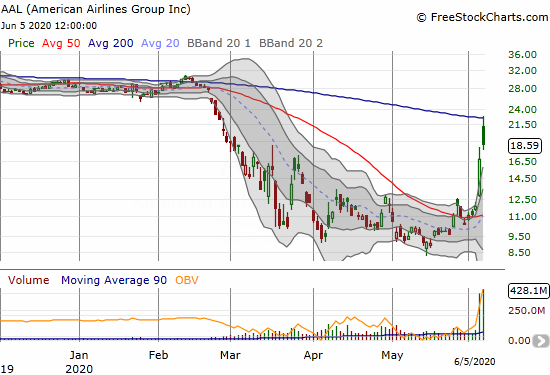
The airlines symbolized a lot of catch-up trades with a sharp change in expectations for consumer discretionary spending and participation in the old economy. On June 4th, Doug Parker, CEO of American Airlines (AAL), appeared on CNBC and talked about authentic conversations about race. The stock gained 41.1%. I thought that was enough of a move. AAL went on to gain another 11.2% on Friday despite a sharp pullback from 200DMA resistance. AAL gained as much as 36.4% on the day. The massive 428.1M shares traded suggest a rash of panic buying that likely exhausted buyers for a while. The last two days each delivered record trading volume for AAL. I would not touch this stock without some kind of pullback and test of key support levels like the 20 or even 50DMA.
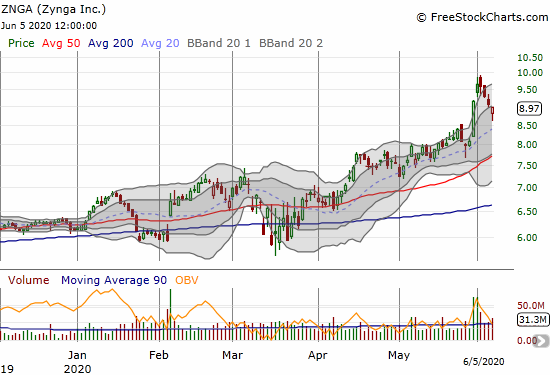
Zynga (ZNGA)
The gaming app company Zynga (ZNGA) is another stock coming on out of nowhere. I thought I missed it the previous week with the stock soaring two straight days above its upper-BB. Last week delivered the cool-off period. Friday’s hammer-like pattern provides the setup for an entry. I am buying on the first trade above Friday’s close with a tight stop below Friday’s intraday low. The next logical support point comes from the uptrending 50DMA.
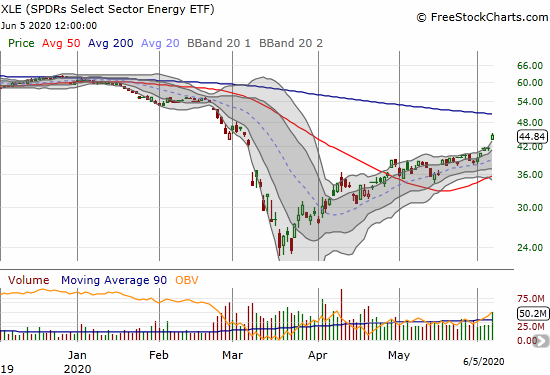
SPDRs Select Sector Energy (XLE)
The SPDRs Select Sector Energy (XLE) made its own mini parabolic move on Friday with a 7.4% gain. XLE is another example of the catch-up trade that is in full swing as market participants accept the March lows as an important bottom. XLE is now in play to test 200DMA resistance.
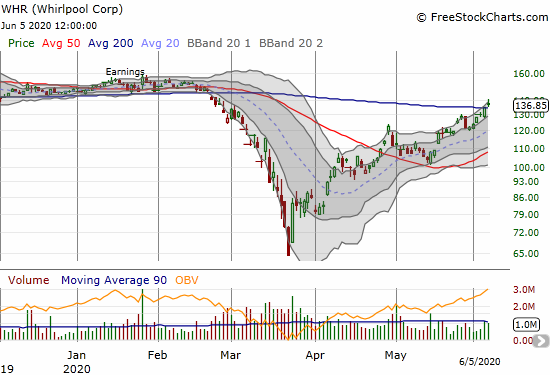
Whirlpool Corp (WHR)
Whirlpool (WHR) cracked its 200DMA resistance with Friday’s gain. I am long calls and short the stock as a hedge play on what comes next. I really need to see earnings on WHR to get convinced that a full recovery in the stock makes sense.
Tesla (TSLA)
It took over three weeks for Tesla (TSLA) to finally break out to the upside after I described a Bollinger Band squeeze. TSLA conveniently launched on the first trading day after a successful Space X rocket launch took Americans into orbit from American soil for the first time since 2011. Fortunately, I have stayed persistent. TSLA looks poised to hit $1000 in coming weeks.

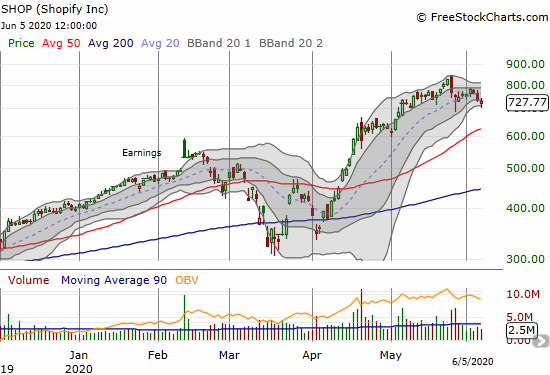
Shopify (SHOP)
E-commerce platform Shopify (SHOP) finally looks tired. The stock under-performed last week as selling follow-through to a bearish engulfing pattern from May 26th on high trading volume. I jumped into a calendar put spread at the $700 strike as a low-risk bet on a little more downside in the next 1-2 weeks.
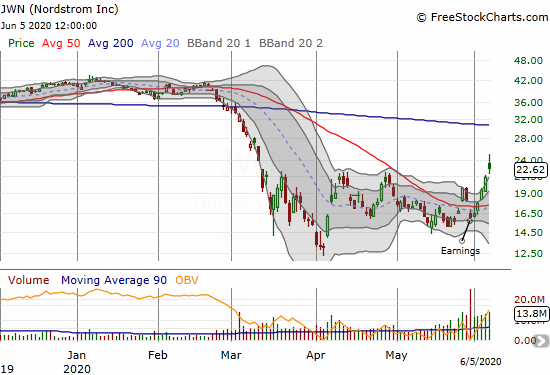
Nordstrom Inc. (JWN)
Retailer Nordstrom (JWN) came through after all. I started the week with the residue from my pre-earnings calendar call trade. The stock’s 11% loss on Friday surprised me given the pass markets have served up to a lot of consumer discretionary names. The catch-up trade lit up the stock from there and allowed me to salvage my long calls and turn an overall profit on the pre-earnings trade. However, I severely under-estimated the potential for the catch-up trade and completely missed Friday’s additional 6.1% push higher.
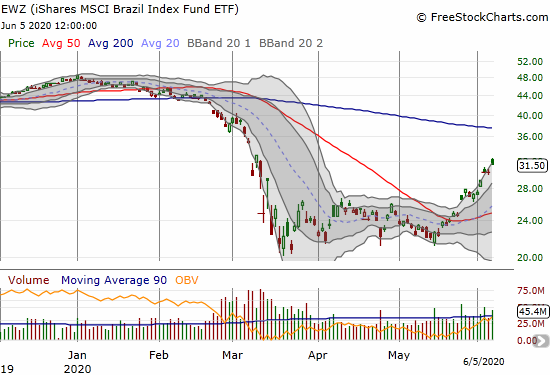
iShares MSCI Brazil Index Fund (EWZ)
The 20% rule on the iShares MSCI Brazil Index Fund (EWZ) worked once again. I took profits on Friday as EWZ neared a 30% gain from where I bought it as a contrary bet that the news could not get worse in Brazil.
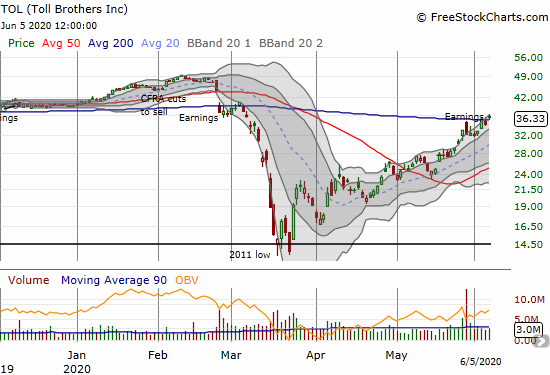
Toll Brothers (TOL)
Home builder Toll Brothers (TOL) managed to cling to its tenuous post-earnings gain from May 26th. On Friday, the stock traded above its 200DMA for the first time since early March. The stock is one confirmation away from making a run at 2020 highs. Given the apparent V-shaped recovery in TRI Pointe Group (TPH), I think TOL has a clear shot at maintaining its rally from the March lows.
Stock Chart Spotlight – Bullish Breakout
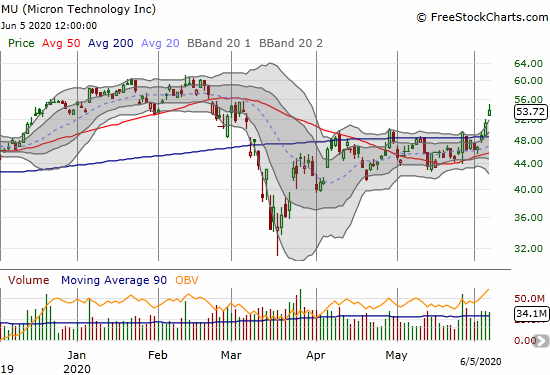
Micron Technology (MU)
Micron Technology (MU) broke out into an “open field” on Friday. The stock is a buy on the dips as it confirmed a 2000DMA breakout from a solid base of 2 1/2 months of consolidation. If the stock does not pullback much this week, I will have to settle for more complicated trades like calendar call spreads, covered call trades, and/or selling puts.
— – —
FOLLOW Dr. Duru’s commentary on financial markets via email, StockTwits, Twitter, and even Instagram!
“Above the 40” uses the percentage of stocks trading above their respective 40-day moving averages (DMAs) to assess the technical health of the stock market and to identify extremes in market sentiment that are likely to reverse. Abbreviated as AT40, Above the 40 is an alternative label for “T2108” which was created by Worden. Learn more about T2108 on my T2108 Resource Page. AT200, or T2107, measures the percentage of stocks trading above their respective 200DMAs.
Active AT40 (T2108) periods: Day #38 over 20%, Day #32 over 30%, Day #30 over 40%, Day #29 over 50%, Day #14 over 60%, Day #12 over 70% (overbought 13 of last 14 trading days and 21 of the last 27 days)
Daily AT40 (T2108)
")
Black line: AT40 (T2108) (% measured on the right)
Red line: Overbought threshold (70%); Blue line: Oversold threshold (20%)
Weekly AT40 (T2108)

*All charts created using FreeStockCharts unless otherwise stated
The T2108 charts above are my LATEST updates independent of the date of this given AT40 post. For my latest AT40 post click here.
Be careful out there!
Full disclosure: long SSO shares, long SHOP calendar put spread, short TSLA shares and long a call option, long TOL, short WHR shares and long calls
*Charting notes: FreeStockCharts stock prices are not adjusted for dividends. TradingView.com charts for currencies use Tokyo time as the start of the forex trading day. FreeStockCharts currency charts are based on Eastern U.S. time to define the trading day.