
AT40 = 3.8% of stocks are trading above their respective 40-day moving averages (DMAs) (23rd oversold day)
AT200 = 5.0% of stocks are trading above their respective 200DMAs (new low for the oversold period)
VIX = 65.5
Short-term Trading Call: bullish
Stock Market Commentary
First a dose of hope: “Coronavirus treatment: Palo Alto woman recovers from coronavirus after being treated with remdesivir” from SF Bay Area ABC News…
I am not sure why this news did not generate more national attention, but I went ahead and bought a call option on Gilead (GLD) in anticipation of at least a short-term rally by April 9th. I am already a long-term holder in GILD shares. Now on to the the stock market commentary…
Last week was truly a week of green shoots as numerous stocks finally broke primary downtrends defined by their lower Bollinger Bands (BBs). Those breakouts became classic buying opportunities as they provided 2-3 days of gains. The S&P 500 (SPY) strung together its first 2 and then 3 days of gains since its 200DMA breakdown. However, in most stock charts that I reviewed the downtrending 20-day moving average (DMA) provided stiff resistance for these green shoots. This coming week the green shoots are at high risk of getting trampled if buyers cannot summon enough energy to push through this next level of resistance.
Oversold
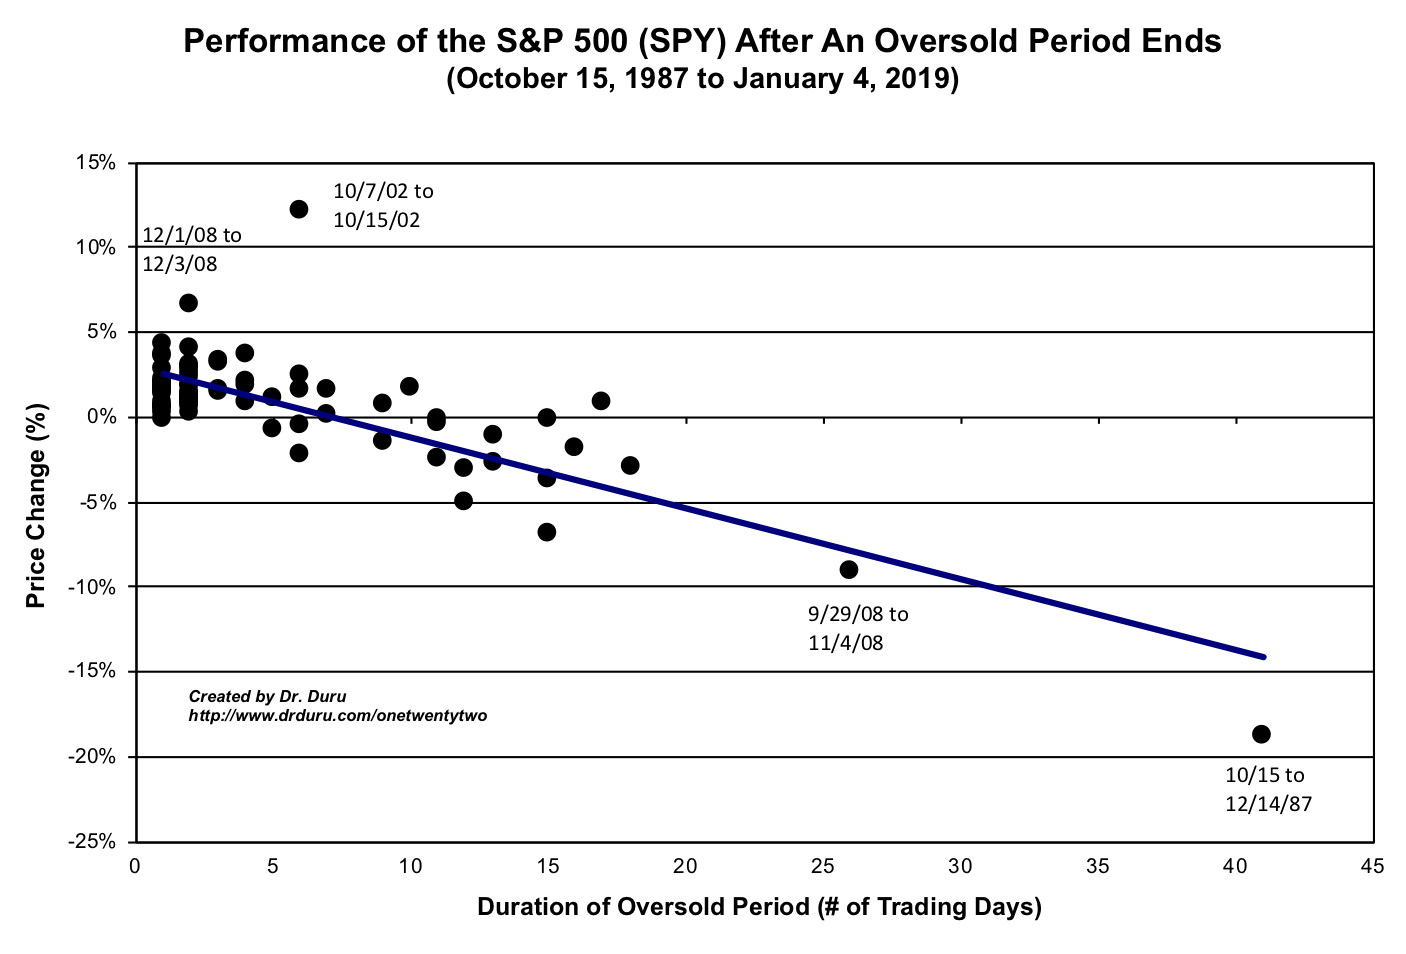
I call the stock market oversold when AT40 (T2108), the percentage of stocks trading above their 40DMAs, closes below 20%. This historic oversold period is now a mind-numbing 23 days long. This oversold period is easily on pace to take the mantle of second longest on record (since 1986), and I gulp hard considering the prospect of this market challenging the record of 41 days set by the 1987 stock market crash. Since the first oversold day, the S&P 500 (SPY) has lost 18.4%. Per the chart below, the index still has potential upside left if the oversold period ends well ahead of all-time records.
The Stock Market Indices
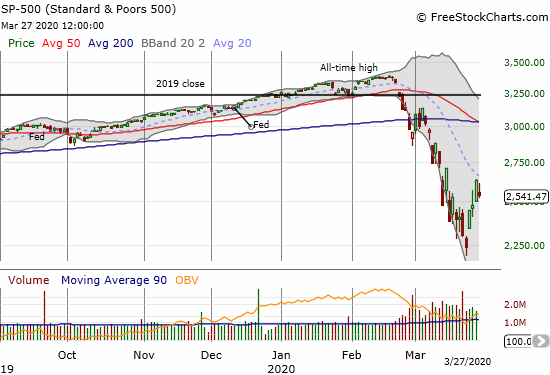
The S&P 500 (SPY) lost 3.4% after failing to challenge its downtrending 20DMA. Still, the index’s 10.3% gain for the week seemed inconceivable after the week started with a gap down, 2.9% loss, which effectively completed a reversal of all the gains after the November, 2016 Presidential election.
The S&P 500 closed at 2139.56 on election day, November 8, 2016. The index closed last Monday at 2237.41 and traded as low as 2191.86. Hopefully that close call serves as a “close enough” test of the key support level. Note well that the S&P 500 formed a kind of bottoming hammer along with an “abandoned baby” bottoming pattern. This 1-2 combo featured 1) a sharp reversal off the intraday lows on extremely high trading volume and a close “near enough” to the open (the hammer) and 2) a gap down followed by a gap up that left over eager shorts stranded and forced the day’s motivated sellers to buy back into the market at much higher prices (the abandoned baby).
A similar pattern on February 28th failed spectacularly on March 9th in the form of the first of 4 market crashes. That day provided an extreme and dramatic example of the bearish implications of invalidating important bottoming patterns.
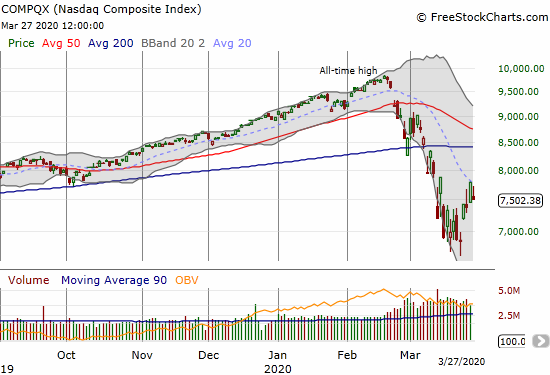
The NASDAQ (COMPQX) more clearly failed at downtrending 20DMA resistance given it closed Thursday right at that line. The tech-laden index lost 3.8% but gained 9.1% for the week (a surprising under-performance relative to the S&P 500).
Volatility
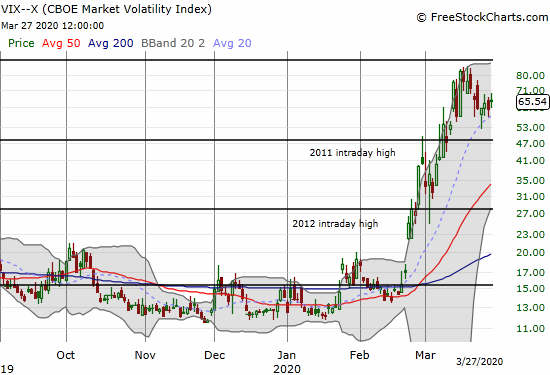
The volatility index (VIX) gained 7.4% on Friday to stay at extremely elevated levels. The VIX is stubbornly hanging out above the 58 level where I drew my bear/line. So the potential for anything and everything to happen in the stock market remains very real and very high.
The Short-Term Trading Call
The destruction in credit markets was epic even as the Federal Reserve scrambled to apply trillions of band-aids across markets. Extraordinary and historic emergency actions by the Federal Reserve, the U.S. government, central banks across the globe, etc.. are the main reason to hold out hope that last week’s green shoots will not get trampled completely back into the ground. Moreover, in mid-March apparently insider buying finally outpaced insider selling for the FIRST week in 10 years (I could not tell whether this happened because of a collapse in selling or a surge in buying). These historic extreme responses are also the reason to be extremely worried if last week’s bottom gives way.
Still, my short-term trading call remains solidly bullish based on the oversold trading conditions. I am laser focused on potential upside opportunities whether short or long-term. At the same time, I fully recognize the risks ahead as human misery increases from health and economic calamities. This is not a time to get aggressive and take out-sized risks. It is a time to stay liquid, stay nimble, and prepare for opportunities at even lower prices.
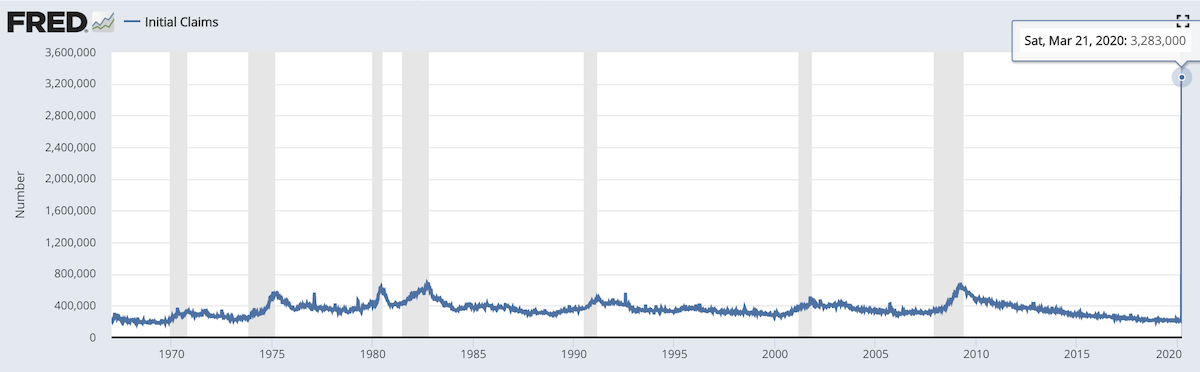
Source: U.S. Employment and Training Administration, Initial Claims [ICSA], retrieved from FRED, Federal Reserve Bank of St. Louis, March 28, 2020.
Stock Chart Reviews – Below the 200DMA
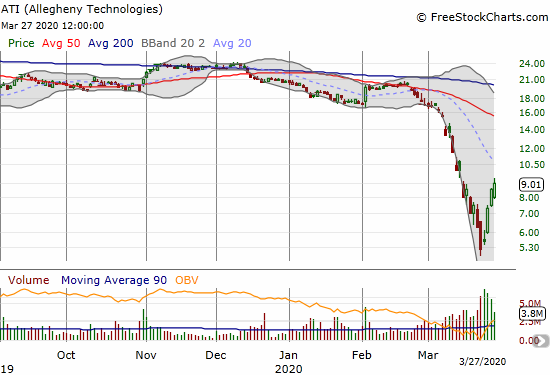
Allegheny Technologies (ATI)
Allegheny Technologies (ATI) is the kind of materials company I want to own when the economy is doing well. Its specialty materials show up in a broad array of industries. Right now, the business in energy and aerospace must be hurting mightily. Still, with the recent lows hitting prices last seen 17 years ago, I should have already started accumulating. The rebound last week doubled the price of the stock to levels last seen 4 years ago (that is what elevated levels of volatility can do!). I will buy the dips from here. ATI trades at half book value and 0.3 times sales – already recession like levels. The week prior was depression-like levels.
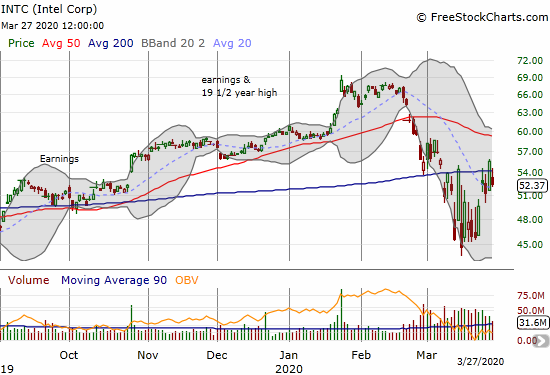
Intel (INTC)
I have been impressed with the relative resilience of Intel (INTC). I bought a call spread and shares during the churn above the recent lows, expecting to wait out an extended period of pain that would give me more shares at lower prices. Instead, INTC rebounded sharply into its 200DMA. I took all profits there. I expect to wait until after April earnings to make the next between earnings play(s).
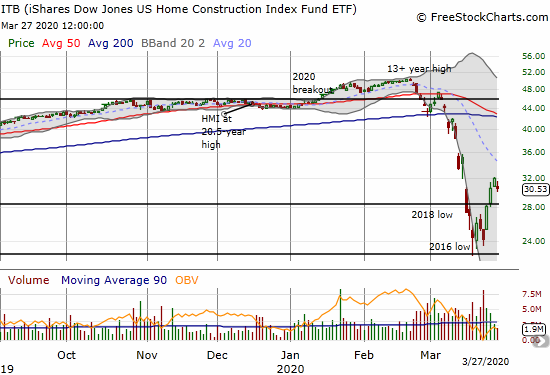
iShares Dow Jones US Home Construction Index Fund ETF (ITB)
A sharp 2-day rally took the iShares Dow Jones US Home Construction Index Fund ETF (ITB) out of the dumps of a 4-year low. ITB is a buy on the dips down to the 2016 low. Given the market’s response to the last two major earnings reports (Lennar (LEN) and KB Home (KBH)), I am more optimistic that the market will be looking past the housing downturn that is sure to come alongside the virus-generated recession. The risks here are extremely high because fears of an extended economic calamity could grind the entire industry to a complete halt…which could then create a brutal race for survival among home builders.
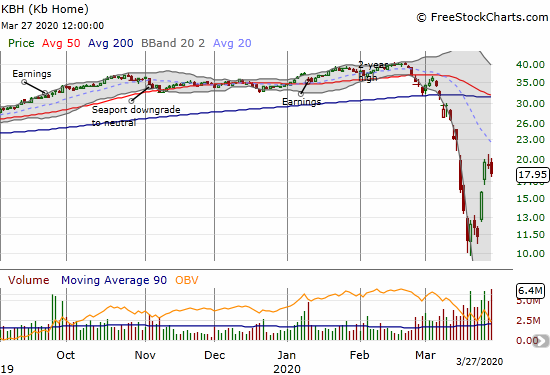
KB Home (KBH)
KB Home (KBH) rallied so sharply into earnings that I had no chance to make a fresh trade. KBH essentially doubled from its 4-year low to the high just before earnings. The stock dropped post-earnings on Friday by 5.9%. That pullback felt almost like a “relief” pullback compared to the previous collapse in the stock price.
I listened to much of the conference call. The management at KB Home sounded similar to Lennar (LEN) in that they emphasized the durability of the balance sheet, rationalization of expenses, and the acceleration of their digital sales platform. I expect other home builders to relay similar stories. I duly noted that KBH highlighted their build-to-order model whereas a lot of builders have popularized spec building which works well when demand is robust and outpacing supply.
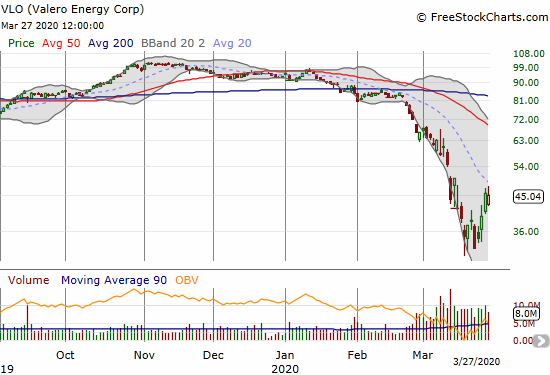
Valero Energy Corp (VLO)
I have been watching oil refiner Valero (VLO) for quite some time for a re-entry point. I finally pulled the trigger on Friday with shares and a Jun/Jan $60 calendar call spread. I fully expect that when Americans have income and places to visit again, they are going to hit the road in huge numbers as pent-up demand gets released and people economize on vacation plans (choosing driving destinations over air destinations). I am trying to look out to 2021 for this play especially with VLO failing resistance at its downtrending 20DMA.
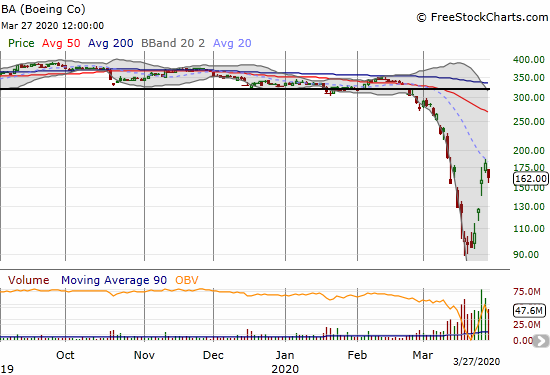
Boeing (BA)
Two weeks ago, I noted the irony in the sell-off in Boeing (BA). The following Monday, the sell-off continued apace and suddenly BA looked too cheap to resist. I accumulated two tranche of shares as well as bought a May/Jan $200 calendar call spread. I fully expected to sit in these positions through months of nail-biter headlines. However, the subsequent rebound in the stock was outright startling. On Wednesday, BA gained 24% on its best single-day performance since its IPO in the 1960s. I had to take all profits on such an outlier day. Like many stocks with sharp rebounds, BA’s ended right at the downtrending 20DMA. I am keeping BA on my active watch list.
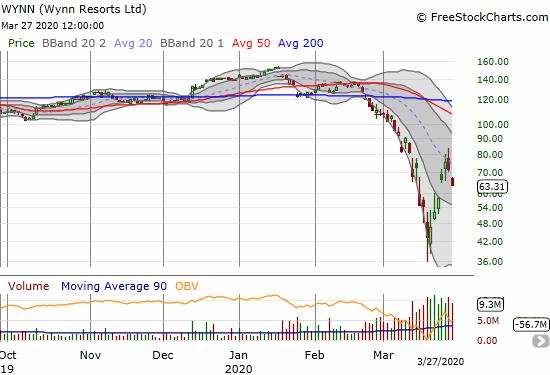
Wynn Resorts Ltd (WYNN)
Wynn Resorts Ltd (WYNN) is one of the most alarming examples of an individual stock failing at 20DMA resistance. WYNN under-performed the market on Thursday with a 4.7% loss after first breaking through 20DMA resistance. On Friday, the stock gapped down and lost 11.5%. WYNN still gained 21.8% for the week, but I have to assume all those gains are subject to reversal in short order based on the definitive 20DMA failure.
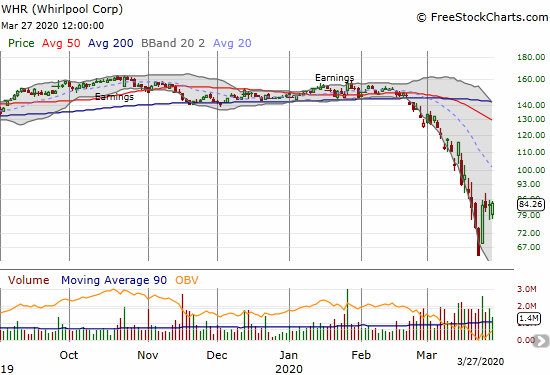
Whirlpool (WHR)
The collapse in Whirlpool (WHR) reached a crescendo after most housing-related and consumer-related stocks hit their bottoms on March 18th. On March 23rd, WHR lost 13.7% for a 54.2% loss since its 200DMA breakdown last month. I am not interested in buying WHR as the stock is less attractive than buying other positions that represent a rebounding consumer economy. Instead, WHR is a candidate for future backstops although put options may no longer be an option as liquidity for them has dried up….very telling in of itself.
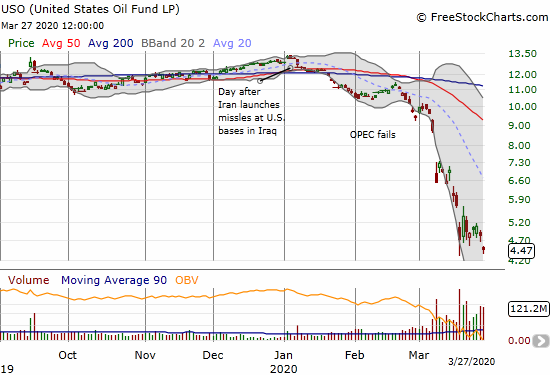
United States Oil Fund LP (USO)
The United States Oil Fund LP (USO) hit a new closing all-time low on Friday’s 7.5% loss. I heard on CNBC speculation about $10 and even single-digit oil prices. I heard such alarm bells during the last collapse in oil prices. It never happened. Is this time different? Who knows. I am a running skeptic of all predictions of oil prices given the market is so highly manipulated. With oil around $20 and down $30 in less than a month, I am sympathetic to predictions of $10 oil. What I DO know is that USO is one UGLY chart!
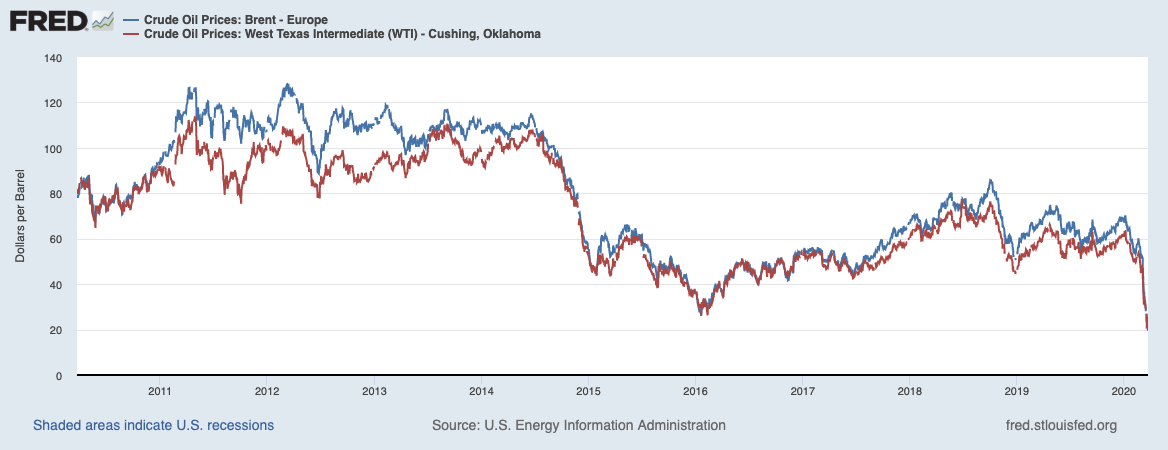
Source: U.S. Energy Information Administration, Crude Oil Prices: Brent – Europe [DCOILBRENTEU], retrieved from FRED, Federal Reserve Bank of St. Louis; West Texas Intermediate (WTI) – Cushing, Oklahoma [DCOILWTICO], retrieved from FRED, Federal Reserve Bank of St. Louis, March 29, 2020.
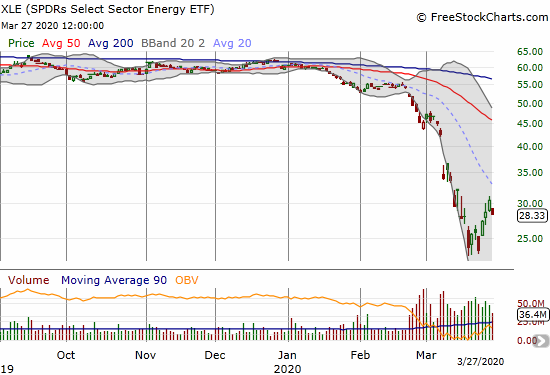
SPDRs Select Sector Energy ETF (XLE)
The SPDRs Select Sector Energy ETF (XLE) somehow escaped oil’s fate last week. I am guessing XLE followed the flows of money back into stocks and ignored the continued collapse in the oil patch. Assuming oil is not going to suddenly rebound, XLE looks like a short with a stop above last week’s high of $31.15.
Stock Chart Reviews – Above the 200DMA
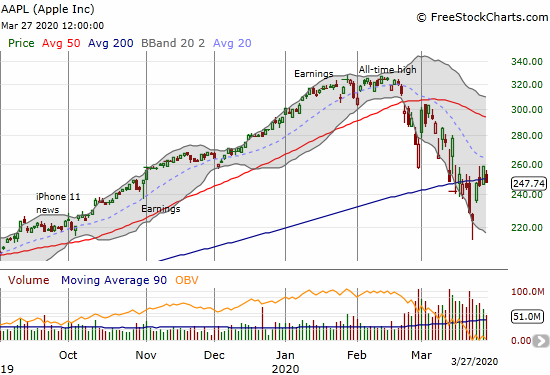
Apple (AAPL)
We lost Apple (AAPL) 2 weeks ago, but this venerable stock is putting up a valiant battle at its 200DMA. Accordingly, I gave AAPL honorary placement in the section of stocks trading above their respective 200DMAs.
I previously expected a 200DMA breakdown to catalyze a major market moment. AAPL’s breakdown March 20th and 23rd was like the final cards falling as the stock market finally found a bottom there. Minus those two days of collapse, AAPL has become a bear/bull stalemate since the first 200DMA breakdown. This chop is just fine for the weekly call trade. On Friday’s dip, I bought a weekly call calendar with a $265 strike.
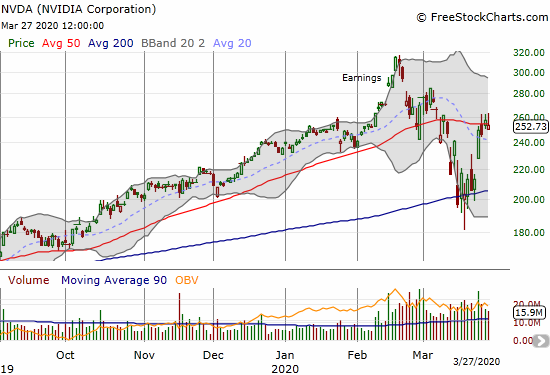
NVIDIA (NVDA)
NVIDIA (NVDA) continues to stand above most stocks (after all, only 5% are above their respective 200DMAs!). After a bumrush to 50DMA resistance, NVDA is now pivoting. I am keeping a close watch on a resolution of this bear/bull stand-off. A fresh breakout is a clear buying signal. A fresh breakdown, puts me on pause until a fresh test of 200DMA support.
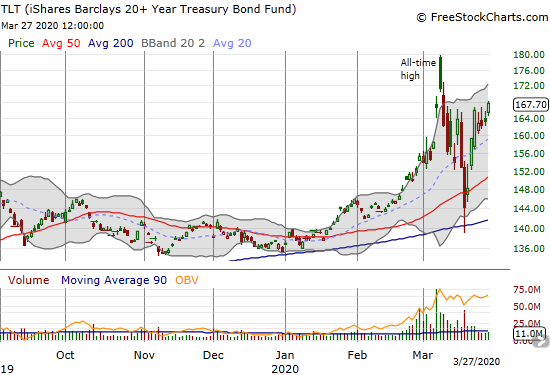
iShares Barclays 20+ Year Treasury Bond Fund (TLT)
It looks like iShares Barclays 20+ Year Treasury Bond Fund (TLT) has healed its collapse after its parabolic run-up. TLT pulled off a successful test of 200DMA support although a violent and sloppy one. Suddenly, TLT is back to its second highest close ever. With the government ramping up borrowing, I do not expect rates to go much lower (TLT higher). But who knows with the Fed standing ready to buy up whatever Treasury bonds the market refuses to buy
— – —
FOLLOW Dr. Duru’s commentary on financial markets via email, StockTwits, Twitter, and even Instagram!
“Above the 40” uses the percentage of stocks trading above their respective 40-day moving averages (DMAs) to assess the technical health of the stock market and to identify extremes in market sentiment that are likely to reverse. Abbreviated as AT40, Above the 40 is an alternative label for “T2108” which was created by Worden. Learn more about T2108 on my T2108 Resource Page. AT200, or T2107, measures the percentage of stocks trading above their respective 200DMAs.
Active AT40 (T2108) periods: Day #23 under 20% (oversold day #23), Day #24 under 30%, Day #35 under 40%, Day #26 under 50%, Day #45 under 60%, Day #49 under 70%
Daily AT40 (T2108)
")
Black line: AT40 (T2108) (% measured on the right)
Red line: Overbought threshold (70%); Blue line: Oversold threshold (20%)
Weekly AT40 (T2108)

*All charts created using FreeStockCharts unless otherwise stated
The T2108 charts above are my LATEST updates independent of the date of this given AT40 post. For my latest AT40 post click here.
Be careful out there!
Full disclosure: long QQQ shares and calendar call spread, long SSO, short UVXY shares and long call spreads, long KBH shares, long ITB shares and various call options, long AAPL calendar call spread, long VLO shares and calendar call spread, long GILD shares and call option
*Charting notes: FreeStockCharts stock prices are not adjusted for dividends. TradingView.com charts for currencies use Tokyo time as the start of the forex trading day. FreeStockCharts currency charts are based on Eastern U.S. time to define the trading day.