Stock Market Slams Into October’s Average Drawdown In Two Days Flat – Above the 40 (October 2, 2019)
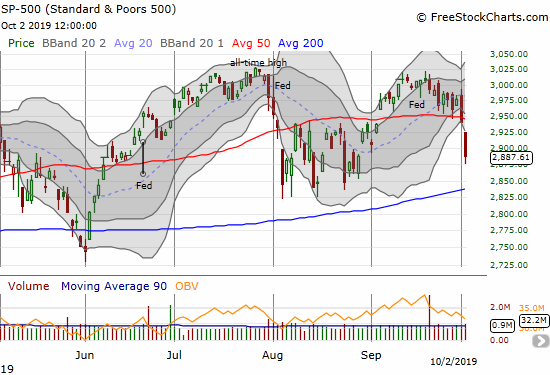
AT40 = 39.0% of stocks are trading above their respective 40-day moving averages (DMAs) (intraday low at 34.5%)AT200 = 45.3% of stocks are trading above their respective 200DMAsVIX = 20.6Short-term Trading Call: cautiously bearish (caveats below) Stock Market Commentary A Broad-Based Exit The selling today was so broad that even Invesco S&P 500 Low Volatility … Read more