
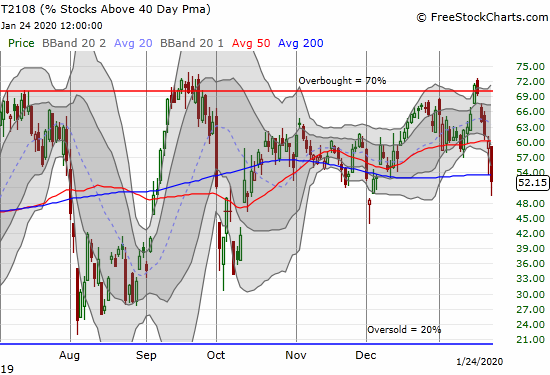
AT40 = 52.2% of stocks are trading above their respective 40-day moving averages (DMAs)
AT200 = 58.2% of stocks are trading above their respective 200DMAs
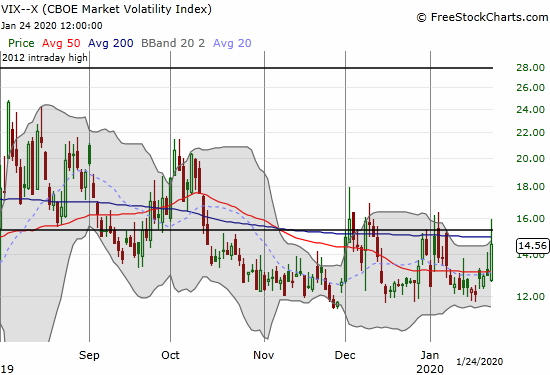
VIX = 14.6
Short-term Trading Call: neutral
Stock Market Commentary
The stock market finally pushed into overbought territory on Thursday, January 16th. The breakout quickly turned into a bust with AT40 (T2108), the percentage of stocks trading above their respective 40-day moving averages (DMAs), dropping for the next 5 trading days.
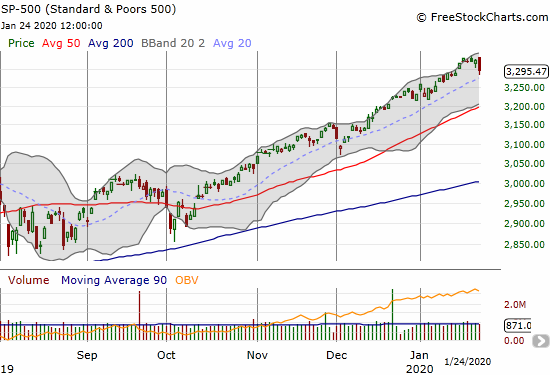
The stock market descended into a bearish divergence until Friday’s trading action pushed the S&P 500 (SPY) into a 0.9% loss. Even at the open the divergence worsened with the index gapping UP at first. Before that, the S&P 500 blissfully spent the week churning in a very tight range with a small down day, a flat day, and a small up day (Monday was a holiday in the U.S. for Martin Luther King’s birthday).
The NASDAQ (COMPQX) was even more notable on Friday. The tech laden index also lost 0.9%, but it gapped up enough at the open to finish the day with an official bearish engulfing pattern indicative of a top after an uptrend.
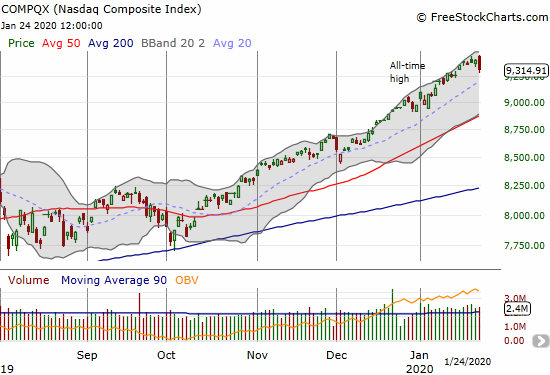
Recall that refreshed bullishness is the flip side of a topping pattern after it gets invalidated. Until that point, I am sympathetic to Carter Worth’s bearish outlook on the Invesco QQQ Trust (QQQ) which is mainly a case for QQQ falling to the bottom of an impressive 10-year uptrending channel. Worth also pointed out that the top 5 stocks in the S&P 500 are about 18% of the index’s value which is closing in on the record 20% set in 1999 (yikes).
Volatility
The 12 level once again proved itself as solid support for the volatility index (VIX). While the VIX closed with a 12.2% gain, the volatility faders were able to push the VIX back from a 23.1% gain. As a result, I doubt the latest fear cycle is quite over. Maybe one more pop in the coming week before the faders regain control?
The Currency Market Speaks
The Australian dollar (FXA) versus the Japanese yen (FXY) delivered as a reliable check of the market’s underlying risk sentiment. AUD/JPY slid right alongside AT40 and firmed up my conclusion that a meaningful bearish divergence was unfolding. At the time of writing, AUD/JPY fell further with the launch of Asian trading. The currency pair is a bit off its lows so far. I took profits on a short AUD/JPY position given the regularity with which markets manage to print some kind of bottom going into the Monday morning open for the U.S.
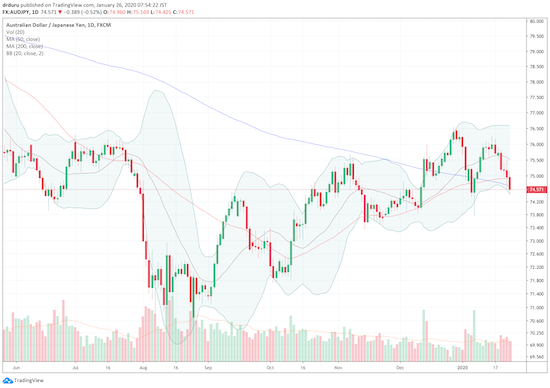
Source: TradingView.com
The Short-Term Trading Call
The presumed catalyst for Friday’s selling was the news/rumor of U.S. cases of the corona virus. The U.S. stock market tried all week to ignore the growing global concerns about the virus, so I was a bit surprised there was much selling on Friday given the persistent reassurances about the limited dangers. In the context of a bearish divergence, the selling makes sense as the release of pent-up pressures. This coming week chock full of earnings could give the stock market its next set of excuses to sell off and release more pent-up pressures.
As I stated in my last Above the 40 post, I am keeping my short-term trading call at neutral until/unless SPY drops below $326.50. The growing bearish divergence convinced me to buy SPY put options last Wednesday and more on Thursday. I bought yet more on Friday when SPY first gapped up. I sold the first two tranches into the subsequent selling with the intent to keep the third tranche for the potential of a Monday gap down. However, those puts soon doubled in price, so, by rule, I locked in the sudden profits. I will next go after SPY put options below $326.50. Earnings season is of course a major wildcard for any and all trading plans!
Stock Chart Reviews – Below the 50DMA
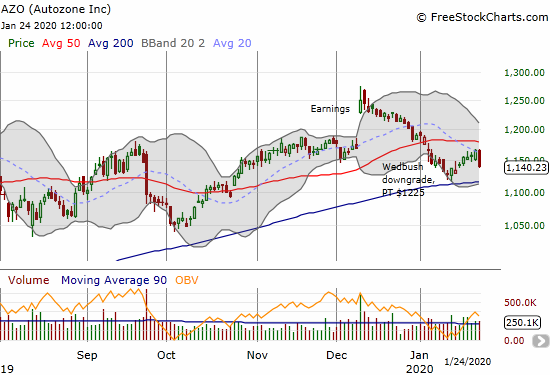
Autozone (AZO)
My trade on Autozone (AZO) ended up a bust. On Thursday, my $1165/$1180 call spread was on the edge of a decent profit with AZO closing at $1166. My worst case scenario was salvaging a good portion of the purchase price. Instead, AZO sank on Friday by 2.2% (on no new news I could find). If only just half of those 26 downside points were upside points. I think of Friday’s move as just one of those random moves that can work against a trade. So I stubbornly refreshed the call spread for expiration this Friday.
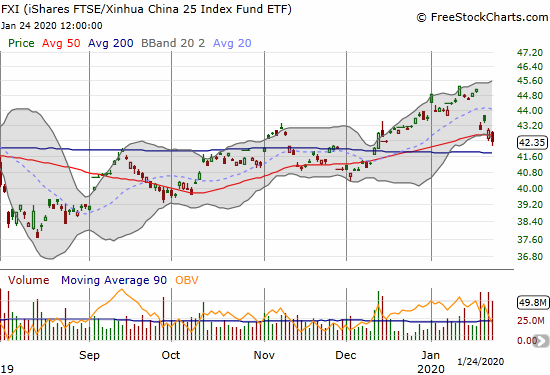
iShares FTSE/Xinhua China 25 Index Fund ETF (FXI)
Watching the trade action in the iShares FTSE/Xinhua China 25 Index Fund ETF (FXI) made me wonder why the S&P 500 was so resilient. FXI provided added a bearish piece to the puzzle for justifying loading up on SPY put options. FXI reversed its entire breakout from December and closed below its 50DMA.
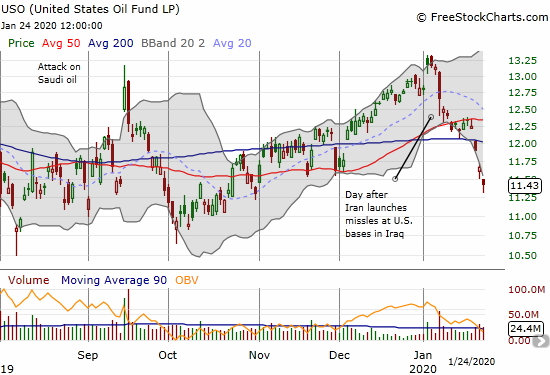
Unites States Oil Fund (USO)
The United States Oil Fund (USO) closed at a 3-month low on the heels of bearish 50 and 200DMA breakdowns. While I understand the worldwide glut situation, I remain surprised by oil’s bias for weakness. I am tempted to interpret this weakness as bad news for global economic growth ahead.
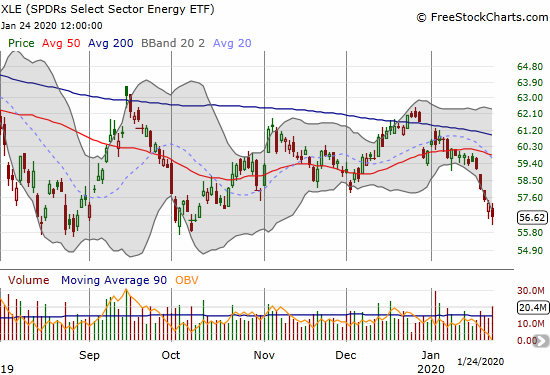
SPDRS Select Sector Energy ETF (XLE)
Weakness in oil is weakness in the SPDRS Select Sector Energy ETF (XLE). XLE was my contrarian play for the year. The ETF is back to where it traded in early October. XLE looks as bearish as ever with another confirmed failure at 200DMA resistance and another 50DMA breakdown. I will doa final add of XLE call options between $55-$56.
Stock Chart Reviews – Above the 50DMA
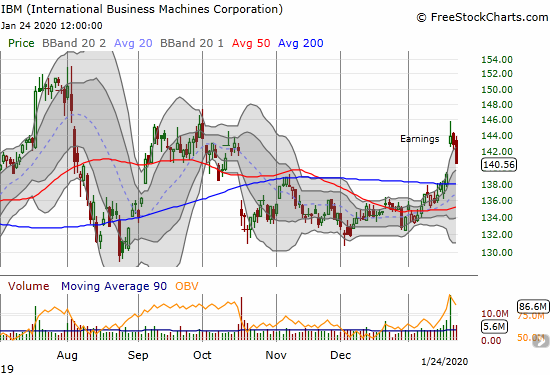
International Business Machines Corporation (IBM)
The struggle in International Business Machines (IBM) continues. Last week he stock gapped up to a 3.4% post-earnings gain. A 1.6% loss on Friday puts IBM on track for quickly filling its post-earnings gap. IBM remains trapped in a 1-year trading range and a 7-year downtrend from its all-time high. IBM could be worth a short-term trade on a test of 200DMA support.
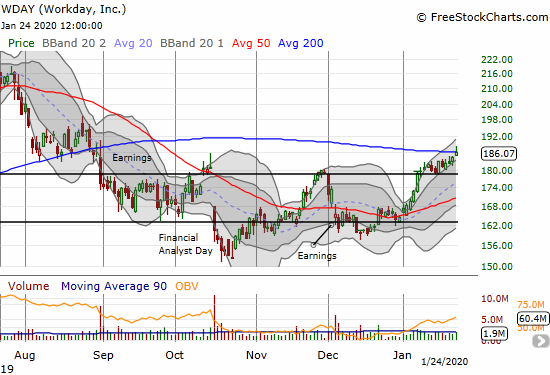
Workday (WDAY)
Workday (WDAY) continues an almost subtle recovery. A brief 200DMA breakout on Friday allowed me to take profits on my latest call options in WDAY. I will buy shares on a confirmed 200DMA breakout.
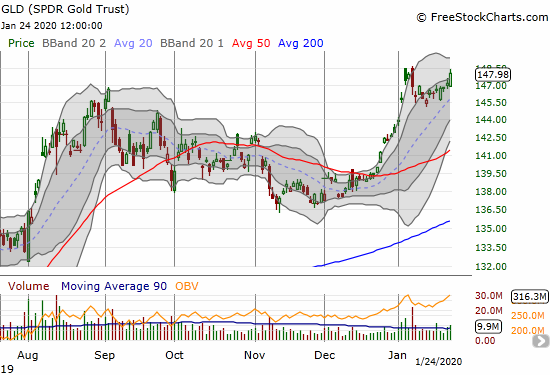
SPDR Gold Trust (GLD)
SPDR Gold Trust (GLD) broke out from a brief consolidation period. On Friday, I rushed to buy a March $150 call option. I think the options are too cheap given the upside potential here. I am back in accumulation mode on call options and will also roll into SLV call options on dips.
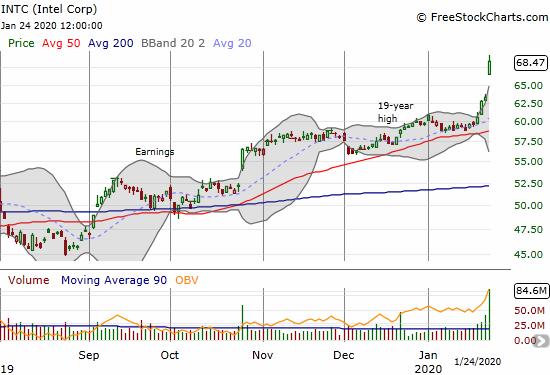
Intel (INTC)
Intel (INTC) impressed me with an 8.1% post-earnings gain on Friday despite general market weakness. Needless to say, I will be buying the dips. This was one of the few times I wish my INTC strategy was to buy call options ahead of earnings instead of between earnings!
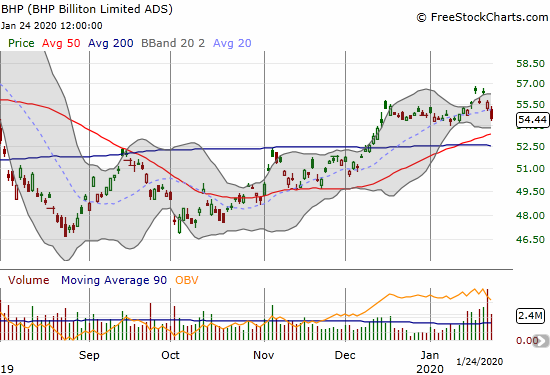
BHP Billiton Limited (BHP)
BHP Billiton Limited (BHP) lost 2.2% on Friday. I am watching this closely for a 50/200DMA breakdown. I will chase the stock downward with put options or an outright short if it breaks down.
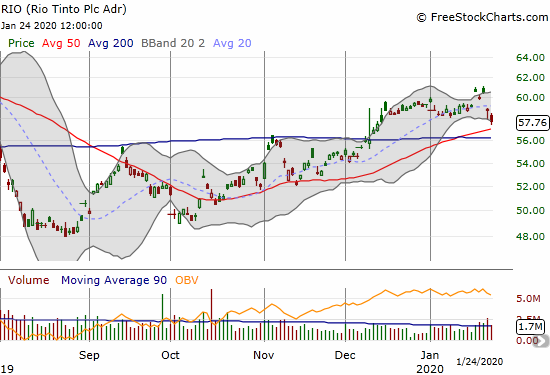
Rio Tinto (RIO)
Rio Tinto (RIO) lost 2.0% to close at a 5-week low. I did not wait for a breakdown before buying put options. I am assuming iron ore hit peak recovery last week.
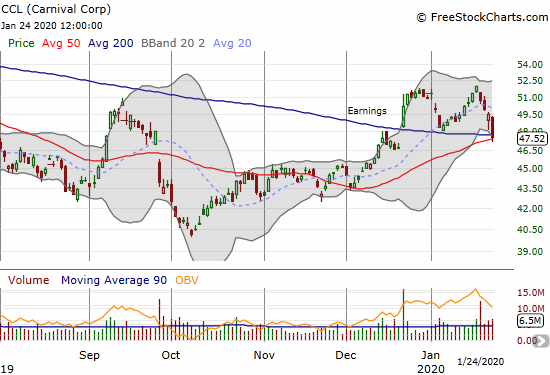
Carnival Corp (CCL)
Carnival Corp (CCL) dropped 3.9% on fears that the apetite for global travel will implode with fears of the corona virus. I already bought shares of CCL based on what I thought was an earlier confirmed 200DMA breakout. CCL bounced off 50DMA support, but I doubt this support will last. In the coming days or weeks, I plan to accumulate CCL along with other select stocks getting hit by virus fears. I am not in a rush given the overall stock market is well overdue a cooling a period.
Separately, one of those reminders that nothing is guaranteed in life….Rest In Peace Kobe Bryant. Bryant’s last tweet before his tragic helicopter accident was a shout out to LeBron James who recently surpassed his NBA scoring record.
— – —
FOLLOW Dr. Duru’s commentary on financial markets via email, StockTwits, Twitter, and even Instagram!
“Above the 40” uses the percentage of stocks trading above their respective 40-day moving averages (DMAs) to assess the technical health of the stock market and to identify extremes in market sentiment that are likely to reverse. Abbreviated as AT40, Above the 40 is an alternative label for “T2108” which was created by Worden. Learn more about T2108 on my T2108 Resource Page. AT200, or T2107, measures the percentage of stocks trading above their respective 200DMAs.
Active AT40 (T2108) periods: Day #254 over 20%, Day #93 over 30%, Day #68 over 40%, Day #35 over 50%, Day #1 under 60% (underperiod ended 8 days over 60%), Day #5 under 70%
Daily AT40 (T2108)
")
Black line: AT40 (T2108) (% measured on the right)
Red line: Overbought threshold (70%); Blue line: Oversold threshold (20%)
Weekly AT40 (T2108)

*All charts created using FreeStockCharts unless otherwise stated
The T2108 charts above are my LATEST updates independent of the date of this given AT40 post. For my latest AT40 post click here.
Be careful out there!
Full disclosure: long VIXY calls, long CCL, long GLD shares and call option, long AZO call spread, long RIO puts, long XLE calls, long AAPL calendar call spread
*Charting notes: FreeStockCharts stock prices are not adjusted for dividends. TradingView.com charts for currencies use Tokyo time as the start of the forex trading day. FreeStockCharts currency charts are based on Eastern U.S. time to define the trading day.