Market Breadth Firms to Start the Year – The Market Breadth

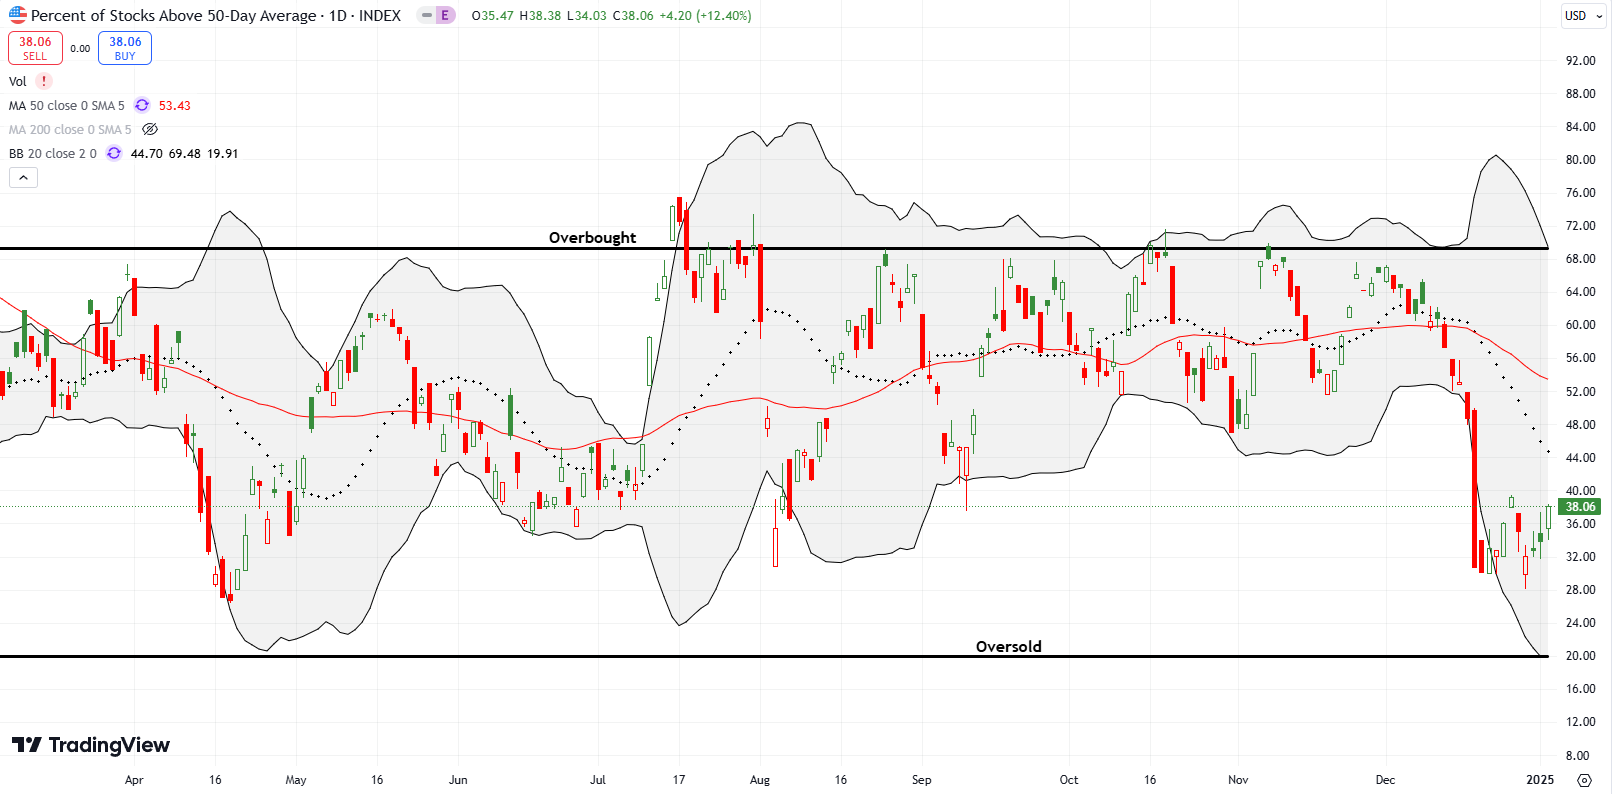
AT50 (MMFI) set a new low for 2024 before firming to start the year.

Stock Market Commentary The new year of 2025 got off to a rocky start with the weight of the last Federal Reserve decision on monetary policy pushing fresh losses across the indices. I assumed this price action signaled the market’s readiness to cash in on the capital gains that it did not want to register … Read more

The Extended Overbought Rally Quickly Overcomes Its Third Strike – The Market Breadth

Extended Overbought Rally Quickly Overcomes Third Strike – The Market Breadth

Stock Market Commentary After the stock market rally suffered strike one and strike two, Wednesday’s sudden pullback had all the signatures of a third strike to start the end of the extended overbought rally. Sellers surged in the final 90 minutes of trading that day. However, they failed to sustain the stampede for the exits. … Read more

Bulls Explode Out of Oversold Trading Conditions – The Market Breadth

bulls explode out of oversold trading conditions

The bear market intrusion to the oversold period gave way to an explosion of bullish trading action this week. The maximum drawdown of October for the S&P 500 (SPY) was 4.0% well above the average for the month. This extreme move provided the perfect setup for the sharpness of the current oversold bounce. The rubber … Read more

Why Oversold Matters: The Jobs Dip and Rip – The Market Breadth

dip and rip (Credit: Google Workspace Labs, AI-generated)

Stock Market Commentary The economist “consensus” expectations for September job growth missed the mark by a mile, 336,000 actual versus 170,000 projected. These big misses represent the on-going struggles of conventional economics to understand the dynamics of today’s post-pandemic economy. Initially, the good jobs news frightened financial markets which think of good news as bad … Read more

How A Bear Finds A Sector Full of Ugly Stocks – The Market Breadth

ugly stocks (Credit: "Jenn's Ugly Face" by lorenabuena is licensed under CC BY-NC-ND 2.0. To view a copy of this license, visit https://creativecommons.org/licenses/by-nd-nc/2.0/jp/?ref=openverse.)

Small caps were hit particularly hard in today’s follow-through to tech stocks pushing against technical limits. The iShares Russell 2000 ETF (IWM) went from a breakout above its 50-day moving average (DMA) despite a surge in interest rates and oil prices to a sharp 50DMA breakdown along with a further spike in interest rates and … Read more

A Resilient Stock Market Barely Blinks At Fresh Bearish Signals – Above the 40 (January 3, 2020)

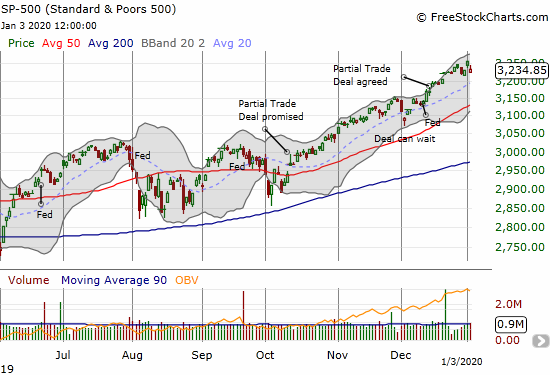
The S&P 500 (SPY) lost 0.7% and closed right at the lower boundary of its upper Bollinger Band. The pattern left behind an island reversal.

AT40 = 63.5% of stocks are trading above their respective 40-day moving averages (DMAs)AT200 = 60.3% of stocks are trading above their respective 200DMAsVIX = 14.0Short-term Trading Call: neutral Stock Market Commentary The stock market started the new decade with wild swings. After starting the first trading day of the decade with a 0.8% gain … Read more

An Obvious Stock Market Breakout Leaves Open Questions – Above the 40 (September 6, 2019)

AT40 = 49.7% of stocks are trading above their respective 40-day moving averages (DMAs) AT200 = 48.1% of stocks are trading above their respective 200DMAsVIX = 15.0Short-term Trading Call: neutral Stock Market Commentary One Obvious Pattern to Another The S&P 500 (SPY) and the NASDAQ (COMPQX) transitioned from an obvious trading range to an obvious … Read more

Above the 40 (December 28, 2018) – A Day of Relative Rest as the Stock Market Limps Away from 2018

AT40 = 8.8% of stocks are trading above their respective 40-day moving averages (DMAs) (oversold day #10)AT200 = 11.8% of stocks are trading above their respective 200DMAsVIX = 28.3Short-term Trading Call: bullish Commentary Trading is finally calming down a bit. From its high of the day to its low of the day, the S&P 500 … Read more