
AT40 = 8.8% of stocks are trading above their respective 40-day moving averages (DMAs) (oversold day #10)
AT200 = 11.8% of stocks are trading above their respective 200DMAs
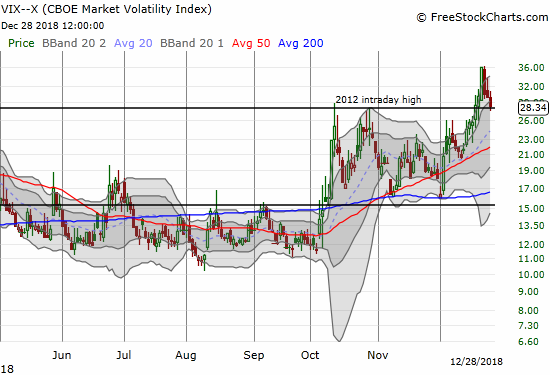
VIX = 28.3
Short-term Trading Call: bullish
Commentary
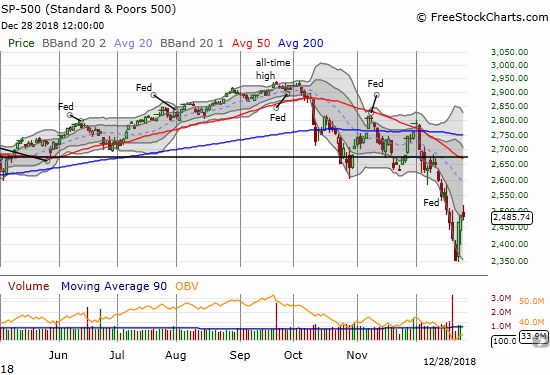
Trading is finally calming down a bit. From its high of the day to its low of the day, the S&P 500 (SPY) changed 1.9%. This range was the lowest since 1.8% on December 18th. Since then, the intraday ranges have been (in chronological order): 3.9%, 2.8%, 4.0%, 2.5% (Christmas Eve), 5.2% (day after Christmas), 3.8%. I suspect the last calendar day and trading day of the year will be even more calm.
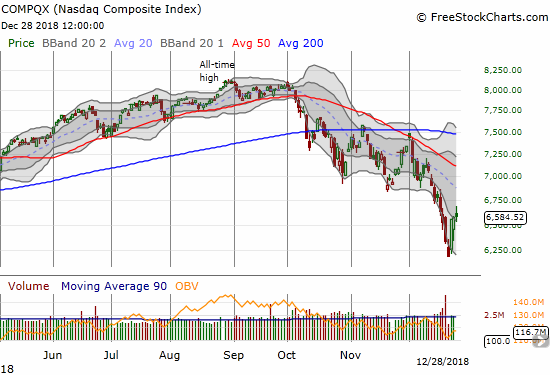
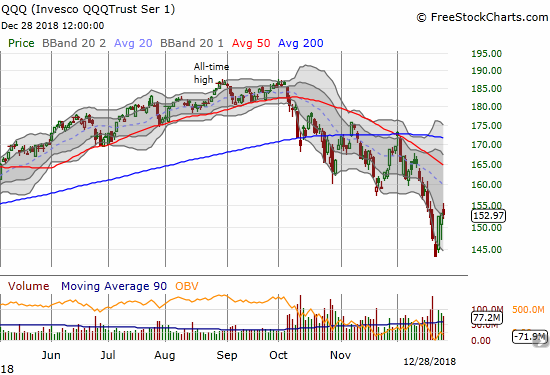
Like the the S&P 500, the NASDAQ and the Invesco QQQ Trust (QQQ) ended the day with minute changes. The tech-laden indices changed 0.1% and -0.1% respectively.
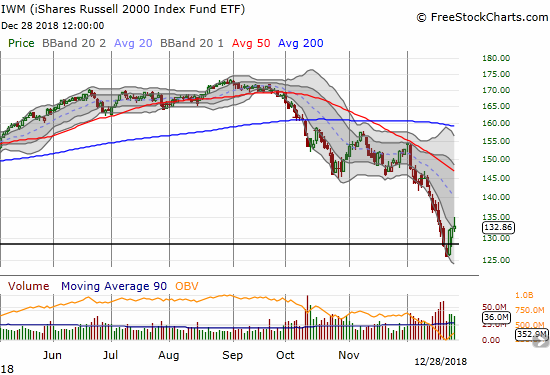
The iShares Russell 2000 ETF (IWM) gained 0.3% and closed above its lower-BB channel for the first time since the beginning of the month. If the “January effect” works next month, IWM should be a major winner. So I am now watching closely for signs of follow-on buying interest that could put 50DMA resistance into play about 10% away.
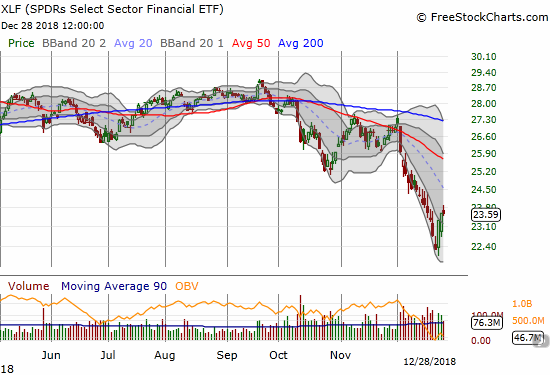
The Financial Select Sector SPDR ETF (XLF) closed flat on the day. The ETF is currently in the middle of an extremely sharp V-shaped bounce. XLF’s decline in December featured many days when the ETF actually managed to touch or approach the top and bottom of its lower Bollinger Band channel.
The volatility index, the VIX, dropped for the third day in a row. The VIX lost 5.4% but remains elevated (above 20).
The breadth indicators made no progress and remain stuck near rock bottom levels. AT40 (T2108), the percentage of stocks trading above their respective 40-day moving averages (DMAs), only moved from 8.1% to 8.8%. AT200 (T2107), the percentage of stocks trading above their respective 200DMAs, stayed flat at 11.8%. The S&P 500 is now down 4.4% since closing in oversold territory on December 14th.
The stock market is now on its 9th day in oversold territory. This is an extended oversold period. Per the chart below, if the oversold period ended today after its 9th day, the performance of the S&P 500 would be at the lower extremes of historical performance shown by the blue circles. The best I expect for the end of the oversold period is a reversal of the 4.4% loss at that point. A retest of the recent closing low would represent a 5.4% loss, so the risk/reward for going long here is presumably around 1:1.
In the last Above the 40, I discussed three separate paths for ending the oversold period according to the projections shown by the red bubbles in the chart below (updated by 2 trading days): 1) a very strong rally in the next one or two trading days to get the S&P 500 close to a flat performance for the oversold period, 2) a lot of churn for as many as 8 more trading days where the downtrending 40DMAs fall low enough for a small rally to push stocks over resistance, or 3) a very extended and historic oversold period that stretches beyond 17 total trading days. The first case sets up the market for a big January fade as the market’s remaining sellers seize the opportunity of higher prices. The second case keeps the market guessing and in suspense until the December jobs numbers are released and perhaps until companies begin releasing early earnings surprises. The third case is a bear market extreme that would be consistent with all the extremes of December.
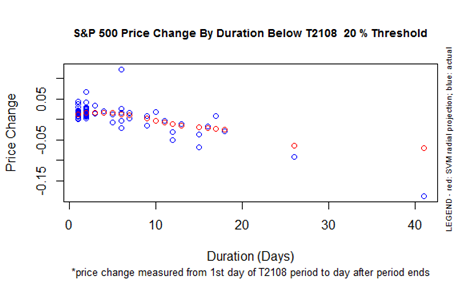
CHART REVIEWS
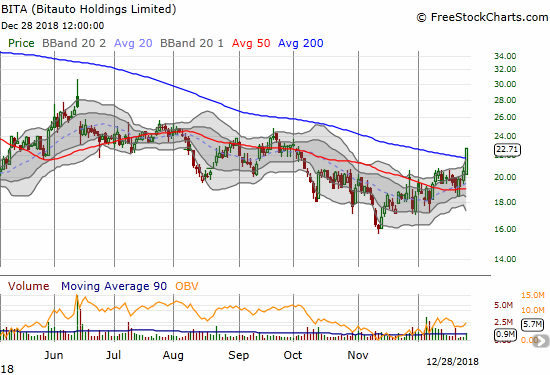
Bitauto Holdings (BITA)
BITA caught my interest as one of a few stocks with a solid breakout above 200DMA resistance. The stock gained a healthy 10.7%. The stock last traded above this resistance at the end of January, so this move could be significant even on the average volume. I will be looking for follow-through buying before considering pulling the trigger. The company reported earnings on November 28th and was able to trade counter to market weakness for most of December. BITA does not report earnings again until March. I used SwingTradeBot to find BITA; it was listed under stocks with the most bullish technical alerts.
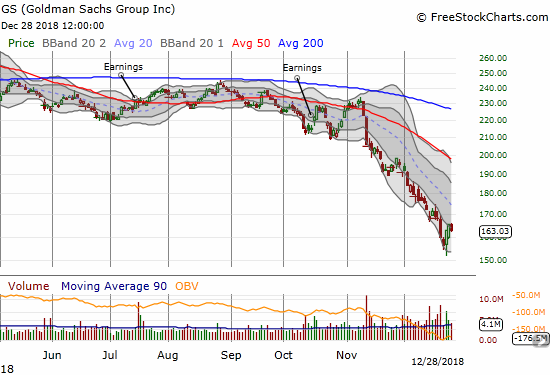
Goldman Sachs (GS)
Even GS showed some signs of life last week. Still, the stock could not quite break out of its lower Bollinger Band (BB) channel. I am looking to increase my puts on GS as a hedge. I am sitting on the long side of a calendar spread whose short side expired last Friday. GS is the poster child for the post-Trump reversal, so I see the stock as a key tell for how the rest of the market will fight with the gravitational pull back to prices around the 2016 Presidential election.
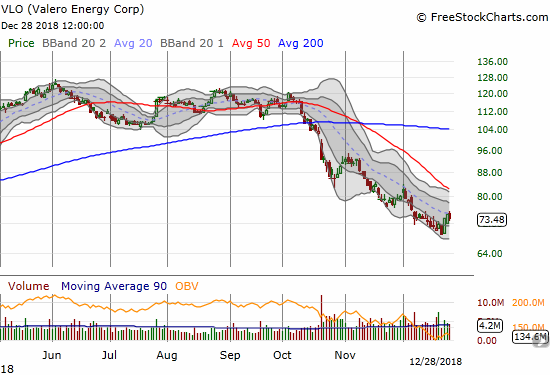
Valero (VLO)
The recent collapse in the energy complex did not spare refiner VLO. Last week, VLO was down as much as 44% from its June, 2018 peak. VLO was also trading at a 15-month low. With a very low valuation and 4.3% dividend, VLO looks VERY interesting here and is on my dividend buy list.
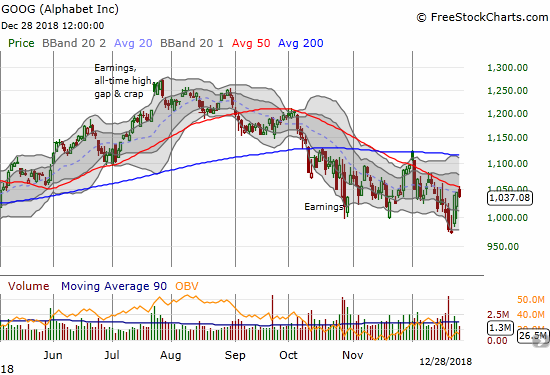
Alphabet (GOOG)
GOOG broke down below its 200DMA in October. The stock tried and failed to break out at the end of November. Now the declining 50DMA has served as tight resistance twice in December. If the stock experiences follow-through selling from here, the December low will be in play.
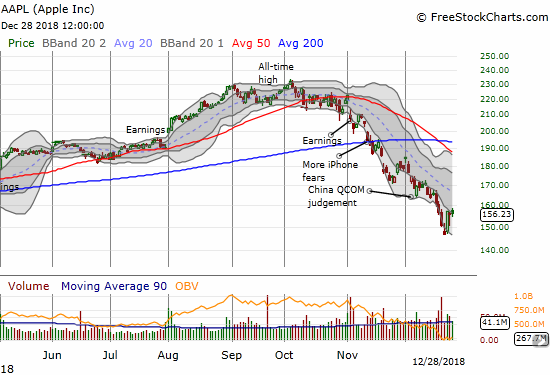
Apple (AAPL)
It feels like forever ago when AAPL was making headlines as the world’s first trillion dollar company – another one of those euphoric moments we will look back upon as signs of a top. AAPL is now “only” a $741B company with a broken down stock. The lower Bollinger Band channel is guiding the stock ever lower. AAPL has been so bearish that both 50 and 200DMA breakdowns were clean cut moments to short the stock.
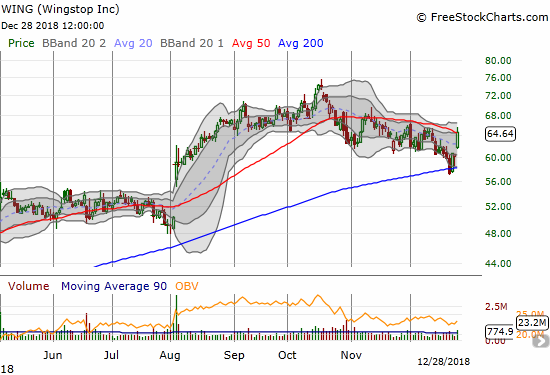
Wingstop (WING)
WING is one of those rare relative outperformers. The stock only spent one day closed below its 200DMA during the market’s sell-off. The stock soared 6.7% on Friday in an important test of 50DMA resistance. Sellers just barely managed to push the stock back under the 50DMA. WING is also interesting because 21.5% of its float is sold short. If the market rally continued even for a few more days, I could see WING quickly trading at and around its all-time high. This is another stock I found from SwingTradeBot.
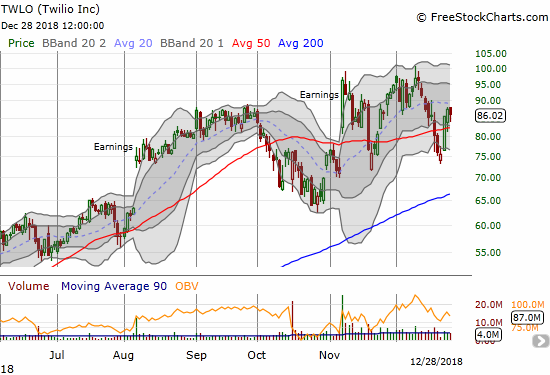
Twilio (TWLO)
TWLO came up just short of my $90 price target. I took the small loss on my position of call options and reloaded.
— – —
FOLLOW Dr. Duru’s commentary on financial markets via email, StockTwits, Twitter, and even Instagram!
“Above the 40” uses the percentage of stocks trading above their respective 40-day moving averages (DMAs) to assess the technical health of the stock market and to identify extremes in market sentiment that are likely to reverse. Abbreviated as AT40, Above the 40 is an alternative label for “T2108” which was created by Worden. Learn more about T2108 on my T2108 Resource Page. AT200, or T2107, measures the percentage of stocks trading above their respective 200DMAs.
Active AT40 (T2108) periods: Day #10 under 20% (10th oversold day), Day #15 under 30%, Day #17 under 40%, Day #67 under 50%, Day #83 under 60%, Day #138 under 70% {corrected 1/6/19}
Daily AT40 (T2108)
")
Black line: AT40 (T2108) (% measured on the right)
Red line: Overbought threshold (70%); Blue line: Oversold threshold (20%)
Weekly AT40 (T2108)

*All charts created using freestockcharts.com unless otherwise stated
The T2108 charts above are my LATEST updates independent of the date of this given AT40 post. For my latest AT40 post click here.
Related links:
The AT40 (T2108) Resource Page
You can follow real-time T2108 commentary on twitter using the #T2108 or #AT40 hashtags. T2108-related trades and other trades are occasionally posted on twitter using the #120trade hashtag.
Be careful out there!
Full disclosure: long SSO, long TWLO call, long GS puts
*Charting notes: FreeStockCharts.com stock prices are not adjusted for dividends. TradingView.com charts for currencies use Tokyo time as the start of the forex trading day. FreeStockCharts.com currency charts are based on Eastern U.S. time to define the trading day.