

Stock Market Commentary
After the stock market rally suffered strike one and strike two, Wednesday’s sudden pullback had all the signatures of a third strike to start the end of the extended overbought rally. Sellers surged in the final 90 minutes of trading that day. However, they failed to sustain the stampede for the exits. Buyers went right back to work the final two days of the week and left pundits and the like scratching their heads even more trying to explain the trading action for the week. In review, it looks like the extended overbought rally flexed its muscles and dominated sentiment. One of the pundits on CNBC’s Fast Money confidently nailed the call on Wednesday: “I think this was a one-day event.” Now the runway looks clear for the extended overbought rally to extend into year-end.
Everyone’s favorite permabull Tom Lee was even more confident in his interpretation of Wednesday’s “profit-taking”: “…65% of fund managers are underperforming their benchmarks….$24 billion was pulled out of equities. Between now year-end…fund managers are trying to catch up, and a lot of investors are reorienting their portfolios towards a nicer Fed.”
The Stock Market Indices
The S&P 500 (SPY) dropped 1.5% on Wednesday. Buyers almost reversed the entire loss by the close on Friday. With the index peeled off its upper Bollinger Band (BB), trading conditions are no longer quite so extended. However, the uptrending 20-day moving average (DMA) is practically begging for a test whenever the extended overbought rally takes a real rest. On the flip side, the all-time high sits a tantalizing 50 points away.
")
The NASDAQ (COMPQ) is still well off its all-time high, but buyers completely reversed Wednesday’s 1.5% loss. Thus, the tech-laden index looks ready to resume its march toward the all-time high set over 2 years ago. Looking back, I can see now how the NASDAQ created a definitive upside resolution to the Bollinger Band squeeze earlier in the month.
")
The iShares Russell 2000 ETF (IWM) slid 2.3% on Wednesday. The ETF of small caps made an even stronger comeback than the other two major indices. IWM ended the week at a fresh 21-month high. The rebound on Thursday took me out of a calendar call spread with profits. I reloaded on a position on Friday’s breakout. More than ever, IWM looks done with its bear market. So as long as IWM trades above the bear market line, I want to aggressively buy its dips. Note IWM is also one of the strongest supporters of extended overbought conditions.
")
The Short-Term Trading Call With Extended Overbought Conditions
- AT50 (MMFI) = 84.1% of stocks are trading above their respective 50-day moving averages (16th overbought day)
- AT200 (MMTH) = 65.4% of stocks are trading above their respective 200-day moving averages
- Short-term Trading Call: neutral
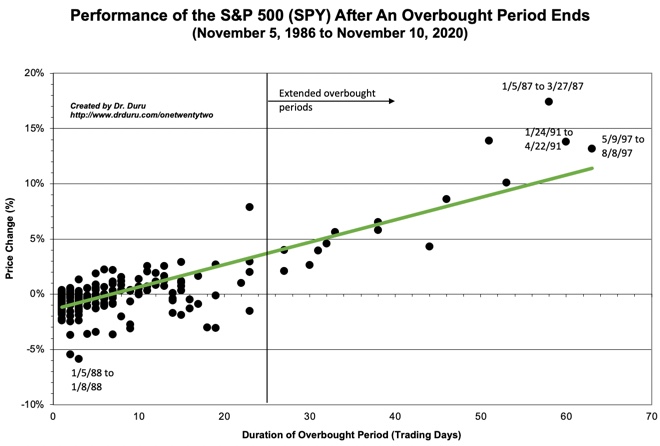
AT50 (MMFI), the percentage of stocks trading above their respective 50DMAs, extended overbought conditions to a 16th straight day. At 84.1%, my favorite technical indicator sits at a near 3-year high. As a reminder, these overbought conditions are NOT themselves bearish. Trading conditions only get bearish once the overbought period ends. Aggressive bears could get excited if the market generates a blow-off top technical pattern. Otherwise, the path of least resistance belongs to the buyers. In the meantime, I remain neutral so that I am mentally prepared for the eventual end of the extended overbought period.
Note in the chart below I previously defined an extended overbought period by the historical point where I no longer expect a negative end to the overbought period. There are precious few overbought periods that achieved such a hurdle so I am now using a looser definition).
As Wednesday’s selling unfolded, I reached for a Caterpillar, Inc (CAT) put option as my favorite hedge. Once it looked like Wednesday’s selling was a false alarm, I took a small profit. However, on Friday, I bought a fresh put option. With the extended overbought period at 16 days, I will be more active in reaching for such hedges when I see smoke. Last week CAT broke out to a new all-time high and then stalled. So the stock’s behavior from here could be one of my key tells for the market.
")
In early June, I made the case for CarGurus Inc (CARG) as a breakout play with less risk than Carvana (CVNA). I happened to take profits ahead of an awful earnings warning two months later. Interestingly, most of the selling pressure dissipated from there. Investors turned happy all over again after November earnings. CARG has glided with the market’s coattails ever since then. CARG closed last week at a 16-month high. Unfortunately, I missed this entire move!
I point to CARG as another classic example demonstrating how the market can show it “knows nothing” about a company’s prospects. CARG is back on my watchlist of bullish stocks.
")
Wingstop, Inc (WING) continues to astound me. The buying has pushed nearly nonstop since November earnings. After the 1-day 7.5% post-earnings gain, WING is up another 31.4%. I was too slow in pivoting my attitude about WING from bearish to bullish. So now I can only look back and ponder “what if”….
")
Speaking of a market that shows it sometimes knows nothing, FedEx Corporation (FDX) has cycled through wild swings in sentiment since October. FDX pulled off a sharp V-recovery from the October lows and rallied sharply into last week’s earnings. All that bullish expectation was cut off at the knees by a 12.1% post-earnings collapse the next day. I quickly faded FDX at 50DMA resistance (the red line). I rolled profits into a put calendar spread. Until FDX closes above its 50DMA again, the stock stays on my bearish watchlist.
")
Home and building products company Griffon Corporation (GFF) hit new all-time highs last week. This stock is on my housing and construction watchlist, but I completely lost track of it. With the housing market looking upbeat I am angling to buy GFF on the next dip (likely to the 20DMA uptrend).
")
I have long been a skeptic on the Buy Now Pay Later (BNPL) stocks like Affirm Holdings, Inc (AFRM). Last week’s deal with Walmart (WMT) further solidifies AFRM as a player here to stay for a while. My skepticism got a glimmer of validation when sellers almost reversed the entire 15.5% gain on the WMT news. AFRM closed the week looking ready to resume its rally and thus put more nails in the coffin of my skepticism!
")
Royal Caribbean Cruises Ltd (RCL) caught my attention on a list of new 52-week highs. I panned back and was shocked to see RCL is almost back to all-time highs! RCL barely skipped a beat on Wednesday’s pullback. The stock even seemed to get reenergized from the selling as it surged 5.2% the next day.
")
")
")
Be careful out there!
Footnotes
Subscribe for free to get email notifications of future posts!
“Above the 50” (AT50) uses the percentage of stocks trading above their respective 50-day moving averages (DMAs) to measure breadth in the stock market. Breadth defines the distribution of participation in a rally or sell-off. As a result, AT50 identifies extremes in market sentiment that are likely to reverse. Above the 50 is my alternative name for “MMFI” which is a symbol TradingView.com and other chart vendors use for this breadth indicator. Learn more about AT50 on my Market Breadth Resource Page. AT200, or MMTH, measures the percentage of stocks trading above their respective 200DMAs.
Active AT50 (MMFI) periods: Day #33 over 20%, Day #31 over 30%, Day #29 over 40%, Day #28 over 50%, Day #25 over 60%, Day #16 over 70% (16th day overbought)
Source for charts unless otherwise noted: TradingView.com
Full disclosure: long CAT put, long IWM call spread, long FDX calendar put spread
FOLLOW Dr. Duru’s commentary on financial markets via StockTwits, Twitter, and even Instagram!
*Charting notes: Stock prices are not adjusted for dividends. Candlestick charts use hollow bodies: open candles indicate a close higher than the open, filled candles indicate an open higher than the close.
CNN Fear and Greed index wobbling between Extreme Greed and Greed. Usually, I wait for it to go from Extreme Greed to Greed as well as a lagging indicator, such as Supertrend.
Left Twitter for a monthly blog instead.
Good luck with the blog!
And thanks again for the reminder about the CNN Fear and Greed Index!