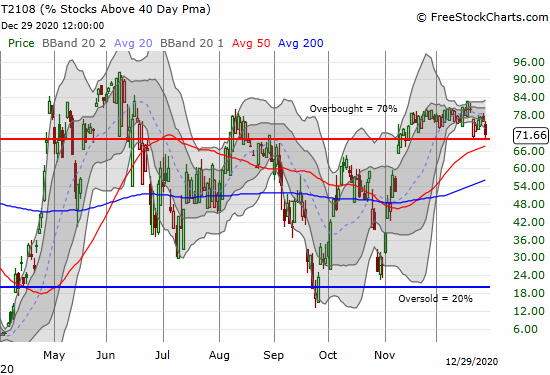
Above the 40 (July 27, 2017) – The S&P 500 Slips, Not Falls, Off the Edge

AT40 = 58.7% of stocks are trading above their respective 40-day moving averages (DMAs) AT200 = 59.4% of stocks are trading above their respective 200DMAs VIX = 10.3 (volatility index) Short-term Trading Call: cautiously bullish Commentary When AT40 (T2108), the percentage of stocks trading above their respective 40-day moving averages (DMAs), fades from overbought status, … Read more

Above the 40 (April 26, 2017) – A Stretched Stock Market Loses Bid for Overbought Status

AT40 = 68.1% of stocks are trading above their respective 40-day moving averages (DMAs) AT200 = 65.4% of stocks are trading above their respective 200DMAs VIX = 10.9 (volatility index) Short-term Trading Call: bullish Commentary AT40 (T2108), the percentage of stocks trading above their respective 40-day moving averages (DMAs), pushed into overbought territory today with … Read more

T2108 Update (January 26, 2017) – Another Overbought Period Bites the Dust for the S&P 500

(T2108 measures the percentage of stocks trading above their respective 40-day moving averages [DMAs]. It helps to identify extremes in market sentiment that are likely to reverse. To learn more about it, see my T2108 Resource Page. You can follow real-time T2108 commentary on twitter using the #T2108 hashtag. T2108-related trades and other trades are … Read more

T2108 Update (January 25, 2017) – A Bullish S&P 500 Breakout Meets A Bearish VIX Breakdown

(T2108 measures the percentage of stocks trading above their respective 40-day moving averages [DMAs]. It helps to identify extremes in market sentiment that are likely to reverse. To learn more about it, see my T2108 Resource Page. You can follow real-time T2108 commentary on twitter using the #T2108 hashtag. T2108-related trades and other trades are … Read more

T2108 Update (January 9, 2017) – Overbought Conditions End With the NASDAQ Leaning Against Bearish Hints

(T2108 measures the percentage of stocks trading above their respective 40-day moving averages [DMAs]. It helps to identify extremes in market sentiment that are likely to reverse. To learn more about it, see my T2108 Resource Page. You can follow real-time T2108 commentary on twitter using the #T2108 hashtag. T2108-related trades and other trades are … Read more

T2108 Update (January 6, 2017) – A Surprising Bearish Divergence for the S&P 500

(T2108 measures the percentage of stocks trading above their respective 40-day moving averages [DMAs]. It helps to identify extremes in market sentiment that are likely to reverse. To learn more about it, see my T2108 Resource Page. You can follow real-time T2108 commentary on twitter using the #T2108 hashtag. T2108-related trades and other trades are … Read more

T2108 Update (January 4, 2017) – A Tantalizing Day for the Stock Market

(T2108 measures the percentage of stocks trading above their respective 40-day moving averages [DMAs]. It helps to identify extremes in market sentiment that are likely to reverse. To learn more about it, see my T2108 Resource Page. You can follow real-time T2108 commentary on twitter using the #T2108 hashtag. T2108-related trades and other trades are … Read more

T2108 Update (January 3, 2017) – The S&P 500 Makes Another Tentative Return to Overbought Conditions

(T2108 measures the percentage of stocks trading above their respective 40-day moving averages [DMAs]. It helps to identify extremes in market sentiment that are likely to reverse. To learn more about it, see my T2108 Resource Page. You can follow real-time T2108 commentary on twitter using the #T2108 hashtag. T2108-related trades and other trades are … Read more

T2108 Update (December 28, 2016) – Caution Confirmed: The S&P 500 Ends A Feeble Overbought Period

(T2108 measures the percentage of stocks trading above their respective 40-day moving averages [DMAs]. It helps to identify extremes in market sentiment that are likely to reverse. To learn more about it, see my T2108 Resource Page. You can follow real-time T2108 commentary on twitter using the #T2108 hashtag. T2108-related trades and other trades are … Read more

T2108 Update (December 19, 2016) – The S&P 500 Makes A Feeble Return to Overbought Conditions

(T2108 measures the percentage of stocks trading above their respective 40-day moving averages [DMAs]. It helps to identify extremes in market sentiment that are likely to reverse. To learn more about it, see my T2108 Resource Page. You can follow real-time T2108 commentary on twitter using the #T2108 hashtag. T2108-related trades and other trades are … Read more