
Stock Market Commentary
One hundred and fifty minutes. The bearish signal that hit the stock market after the last overbought period ended essentially lasted just 150 minutes. Buyers stepped into the market on Monday after lunchtime on the East Coast and essentially barely took a pause until the last 2 hours of trading today (Wednesday, January 6, 2021). The pause was all the concern the stock market could muster in the wake of political chaos and rioting in Washington D.C. as Congress attempted to deliberate over certification of the Electoral College votes. These votes gave Joe Biden and Kamala Harris the victory in the 2020 U.S. Presidential election. The blithe buying spree was a classic triumph of liquidity over headlines including images of a defiant and instigating sitting President.
As I indicated in my last Above the 40 post, the stock market picks and chooses when to care about the news and which news. For example, in today’s case, current liquidity, and the promise of yet more liquidity from a Democrat-controlled government, won the day. The chart below suggests how a triumph of liquidity can happen as the money supply soared shortly after the pandemic. MZM and M1 are different measures of money tracked by the Federal Reserve (see the St. Louis Fed’s FRED for definitions).
Sources: Federal Reserve Bank of St. Louis, MZM Money Stock [MZM], retrieved from FRED, Federal Reserve Bank of St. Louis; Board of Governors of the Federal Reserve System (US), M1 Money Stock [M1], retrieved from FRED, Federal Reserve Bank of St. Louis, January 7, 2021
Before the Federal Reserve and the Federal government responded to the pandemic with relief measures, money grew in the economy at a relatively steady pace. For example, the roughly $3 trillion increase from March to May equals the increase from the previous 4 years.
Moreover, this money is apparently not translating in economic transactions. The velocity of money is as low as ever. Large swaths of the economy in various states of shutdown and lockdown, so folks with money cannot spend as they like. Additionally, folks with little money are inclined to save what they can (or pay down debt). “Excess” liquidity is likely pouring into the stock market.
Sources: Federal Reserve Bank of St. Louis, Velocity of MZM Money Stock [MZMV], retrieved from FRED, Federal Reserve Bank of St. Louis; Federal Reserve Bank of St. Louis, Velocity of M1 Money Stock [M1V], retrieved from FRED, Federal Reserve Bank of St. Louis, January 7, 2021.
The Stock Market Indices
The S&P 500 (SPY) gained 0.6% on the day despite. However, the index faded from an intraday all-time high. The uptrending 20-day moving average (DMA) held as support.
The NASDAQ (COMPQX) continues to lag. At one point, the tech-laden index traded in positive territory but ended the day with a 0.6% loss. The NASDAQ is clinging to uptrending 20DMA support.
Small caps handed the mantle of weakness to the NASDAQ. The iShares Trust Russell 2000 Index ETF (IWM) managed to hold support at its 20DMA as well as launch into an all-time high. IWM gained a startling 4.1% on a clean breakout.
Stock Market Volatility
The triumph of liquidity is downward pressure on the volatility index (VIX). This pressure was enough to completely reverse all of Monday’s gain at today’s intraday low. However, the VIX managed a sharp rebound going into the close that left the VIX with a minimal 1.1% loss. Per my last post, I took profits on my UVXY call options on Tuesday with the first sign of VIX weakness. I am looking to buy back in.
The Short-Term Trading Call: Looking Past the Triumph of Liquidity…for now
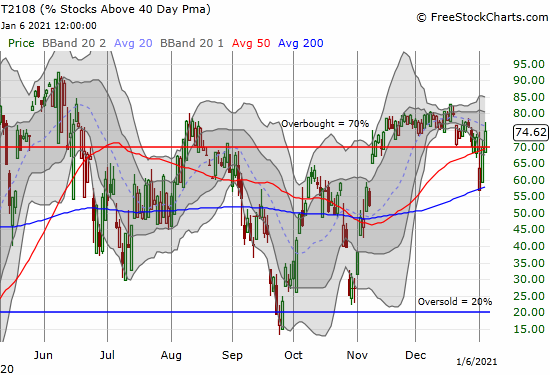
- AT40 = 74.6% of stocks are trading above their respective 40-day moving averages (first day of overbought period)
- AT200 = 87.3% of stocks are trading above their respective 200-day moving averages (TradingView’s calculation).
- Short-term Trading Call: bearish
AT40 (T2108), the percentage of stocks trading above their respective 40DMAs, closed at 74.6%. As a result, a new overbought period began after a mere two day break from the last one. Yesterday, my favorite technical indicator briefly punched above the 70% overbought threshold before retreating to 69%.
Market liquidity is showing off in the unequivocally bullish signals indicated by SwingTradeBot. Moreover, all the main indicators this technical site monitors were bullish on the day:
- 3,774 advancers versus 1,877 decliners
- 1,405 new highs versus 74 new lows
- 3,872 bullish signals versus 1,898 bearish signals
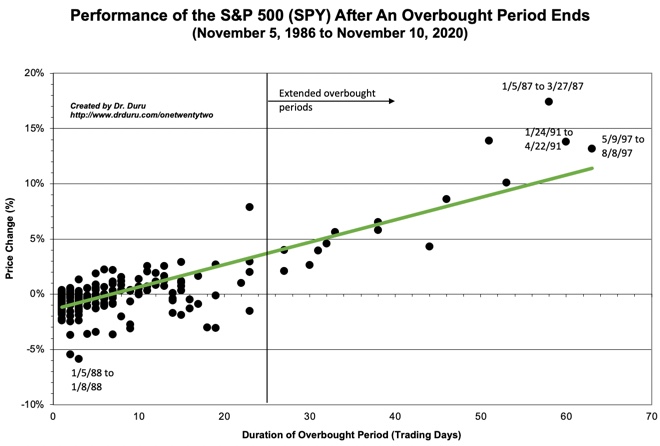
With liquidity proving its mettle, why does the short-term trading call still sit at bearish? Firstly, the S&P 500 did not invalidate the bearish call with a close at an all-time high. Secondly, I am loathe to churn the trading call. As a result, even if the S&P 500 achieves the invalidation point, I will cling to the bearish call unless the overbought period stretches beyond three days. Most overbought periods last just 1 or 2 days. So, an overbought period extending further makes me unwilling to be a stubborn bear with major indices notching one all-time high after another. At that point, I will flip all the way back to neutral.
The Message in the Currency Market
In my last Above the 40 post, I used a rebound in the Australian dollar versus the Japanese yen (AUD/JPY) as a warning against shorting the market just yet. Sure enough, this indicator of risk-on sentiment surged the last two days. As a result, AUD/JPY is at a 21-month high.
Stock Chart Reviews – Below the 50DMA
iShares 20+ Year Treasury Bond ETF (TLT)
Bond traders are waking up to the inflationary implications of growing liquidity in the market. Interest rates have slowly but surely crept higher since August. Today, the iShares 20+ Year Treasury Bond ETF (TLT) gapped down to a 2.1% loss. TLT last traded this low in March during a time when the market feared liquidity would not arrive in time to save financial markets.
Stock Chart Reviews – Above the 50DMA
iShares Trust US Home Construction ETF (ITB)
Home buyers have taken full advantage of the liquidity washing through the system by snapping up homes. The iShares Trust US Home Construction ETF (ITB) benefited with a sharp rebound from the March lows. However, shares of home builders are stuck in an extended trading range. The sharp jump in interest rates did not deter buyers from taking ITB off its gap down, intraday lows to a 1.0% gain.
Caterpillar Inc (CAT)
I was a big a fan of industrial type stocks for the several months going into the end of 2020, and I remain so. Thus, I was highly disappointed to have nothing in hand as Caterpillar (CAT) surged 5.6%. The triumph of liquidity stirred fresh hopes and expectations for large increases in infrastructure spending. In case this run continues even from here, I snatched a $195 weekly calendar call spread.
CME Group Inc (CME)
I saw no news to explain the surge for CME Group Inc (CME). The 8.0% pop provided one more sign that the market is showing off bullish colors. CME is clearly a buy on the dips here with converging support at the 50 and 200DMAs. Accordingly, this is a case where I am willing to make an exception to short-term bearishness!
Be careful out there!
Footnotes
“Above the 40” (AT40) uses the percentage of stocks trading above their respective 40-day moving averages (DMAs) to measure breadth in he stock market. Breadth indicates the distribution of participation in a rally or sell-off. As a result, AT40 can identify extremes in market sentiment that are likely to reverse. Above the 40 is my alternative name for “T2108” which was created by Worden. Learn more about T2108 on my T2108 Resource Page. AT200, or T2107, measures the percentage of stocks trading above their respective 200DMAs.
Active AT40 (T2108) periods: Day #59 over 20%, Day #43 above 30%, Day #42 over 40%, Day #41 over 50%, Day #40 over 60%, Day #1 over 70% (first overbought day ending 2 days under 70%)


Red line: Overbought threshold (70%); Blue line: Oversold threshold (20%). Source: FreestockCharts
Source for charts unless otherwise noted: TradingView.com
Full disclosure: long UVXY shares, long SPY put spread, long CAT calendar call spread
FOLLOW Dr. Duru’s commentary on financial markets via StockTwits, Twitter, and even Instagram!
*Charting notes: FreeStockCharts stock prices are not adjusted for dividends. TradingView.com charts for currencies use Tokyo time as the start of the forex trading day.